
Volume profile and VWAP are two powerful technical indicators that, when combined, help you identify high-probability entry and exit points with precision. Volume profile highlights historical price levels with the highest trading activity, while VWAP provides a real-time average price that reveals institutional market sentiment. By the end of this guide, you'll know exactly how to spot institutional support zones and execute trades where the real money is flowing.
You've probably watched a stock break out, only to reverse violently and stop you out. That frustrating experience happens when you trade against hidden institutional levels. We're going to walk you through exactly how to combine these two tools so you can avoid those common traps and trade with confidence.
Our team recommends this combination because it filters out market noise and focuses entirely on where actual transactions are concentrated. When you understand the relationship between these indicators, you gain a significant edge over traders relying on price action alone.
What Is the Difference Between Volume Profile and VWAP?
Bottom Line: The core insight here is that volume profile and VWAP are most valuable when used together, not separately. Confluence between a high-volume price level and VWAP gives you a specific, defensible reason to enter a trade rather than a gut feeling. Strict position sizing of 1% to 2% per trade is what keeps the strategy viable long enough to let the edge play out.
The difference between volume profile and VWAP comes down to time versus price. Volume profile displays the total volume traded at specific price levels over a set period, creating horizontal support and resistance zones. VWAP calculates the volume-weighted average price throughout the trading day, acting as a dynamic trendline that institutional traders watch closely.
Volume profile turns traditional volume analysis on its side. Instead of showing when volume occurred, it shows exactly where transactions took place. This creates a visual map of High Volume Nodes (HVN), which represent areas of heavy accumulation or distribution.
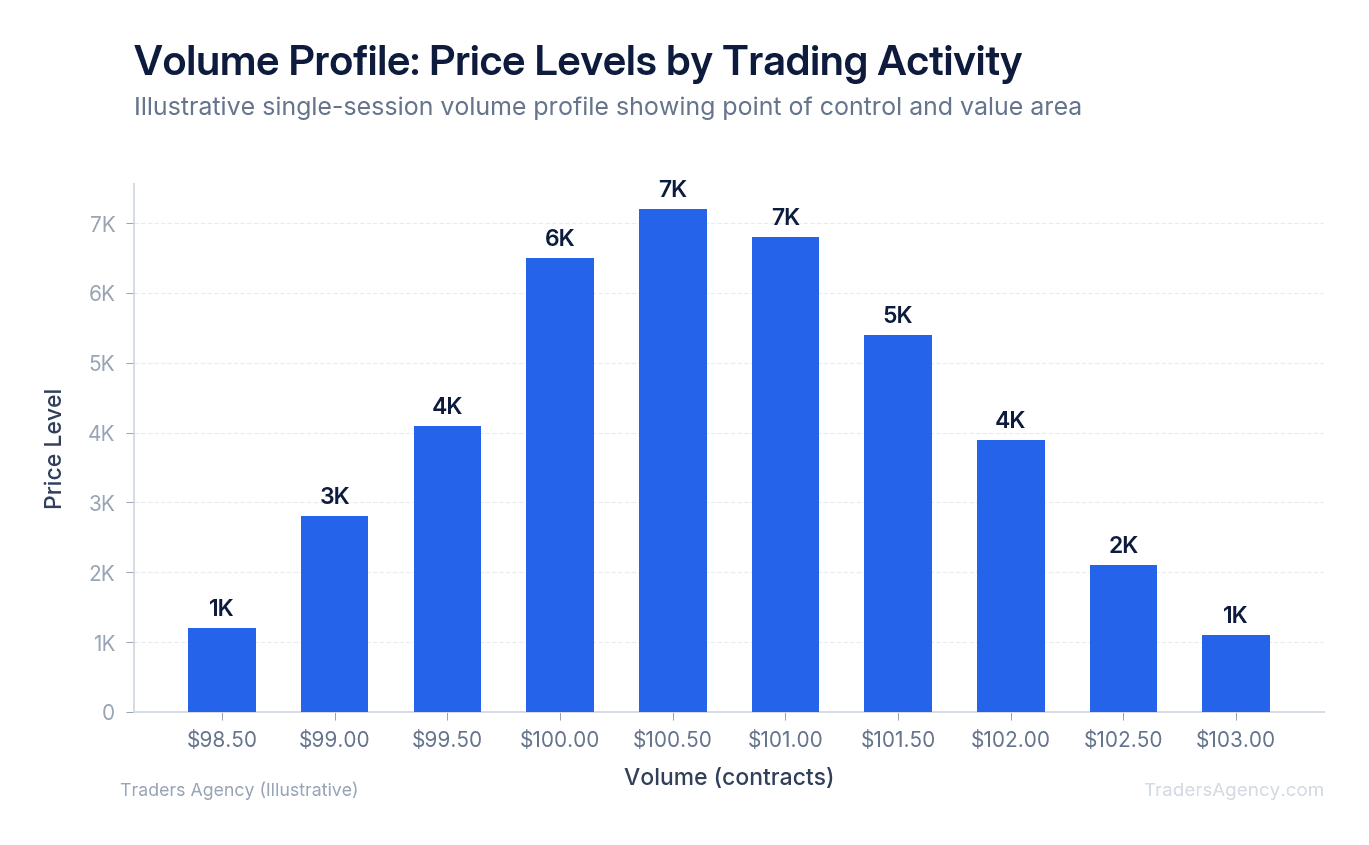
Key Concept: The Value Area represents the price range where 70% of the trading volume occurred during a specific session. Traders view the edges of this value area as natural boundaries for price action, making them powerful support and resistance levels.
VWAP, or Volume-Weighted Average Price, serves a completely different function. It calculates the average price a security has traded at throughout the day, based on both volume and price. The SEC and major exchanges frequently cite VWAP as the primary execution benchmark for institutional investors.
Institutions use VWAP to ensure they are not overpaying for large block orders. If a stock is trading below VWAP, it is considered cheap relative to the day's average. If it trades above VWAP, it is considered expensive. Understanding this dynamic gives you a window into how the biggest players in the market are thinking.
How Do You Use Volume Profile With VWAP?
You use volume profile with VWAP by looking for areas where both indicators align to create high-probability support or resistance zones. When a stock's price pulls back to the VWAP line right at a high-volume node from the volume profile, it offers a prime entry point for trend-following trades.
We teach our members to look for confluence. Think of VWAP as the river's current and the volume profile as the rocks in the river. When the current pushes price action directly into a massive rock, you get a predictable reaction.

If a stock is trending upward and pulls back, we do not just blindly buy the dip. We wait for the price to touch the VWAP precisely where a High Volume Node exists. This dual-layered support significantly increases the probability of a successful bounce, because you're trading at a level where both real-time institutional interest and historical transaction density converge.
How Do You Trade the Volume Profile and VWAP Confluence Setup?
Here's a concrete example of how to execute this strategy. We'll walk through a hypothetical day trade on Ticker XYZ, a large-cap tech stock with high daily liquidity.
-
Identify the Setup
Ticker XYZ opens at $150.00 and pushes aggressively up to $155.00 within the first hour of trading. You notice strong relative volume, but you missed the initial breakout. We prefer to wait for a pullback rather than chasing extended prices.
You apply your indicators and observe the following conditions:
- The daily VWAP is steadily rising and currently sits at $152.50.
- Your session volume profile shows a massive High Volume Node exactly at $152.45.
- The price begins to retrace from $155.00 on lighter volume, drifting back toward the $152.50 level.
This is the exact setup we want. The institutional average price (VWAP) and the area of highest historical transaction activity (volume profile) are perfectly aligned.
-
Execute the Entry
As the price drops to $152.60, you prepare your order. You do not place a market order immediately. Instead, you wait for the price to test the $152.50 zone and show signs of stabilization.
Once you see a 5-minute candle close above $152.50 with a long lower wick, you execute your entry.
Parameter Value Entry Price $152.65 Stop Loss $151.90 (below the volume node and VWAP) Position Size Calculated to risk exactly 1% of total account equity Risk Per Share $0.75 By waiting for the candle close, you confirm that buyers are actually stepping in at the expected support level.
-
Manage the Outcome
Now we manage the trade based on the volume profile structure above us. You look at the chart and see a Low Volume Node (an area with very little trading activity) between $153.00 and $154.50. Price tends to move quickly through low-volume areas because there is little historical resistance to slow it down.
Scenario Price Target Profit/Loss Per Share Best Case $155.00 (retest of day's high) +$2.35 Most Likely $154.00 (partial profits, stop moved to breakeven) +$1.35 Worst Case $151.90 (stop loss triggered) -$0.75 Even in the worst-case scenario, your risk-to-reward ratio on the best case is better than 3:1. That's the kind of asymmetric setup we look for every single day.
Want expert trading insights delivered daily?
Join thousands of traders who rely on Traders Agency for market analysis and trade ideas.
Join Traders AgencyWhat Timeframes Work Best for This Strategy?
The best timeframes for combining volume profile and VWAP depend on your trading style. Day traders typically use 1-minute to 5-minute charts with a daily VWAP and session volume profile. Swing traders prefer 1-hour or daily charts using an anchored VWAP and a multi-session volume profile.
For active day trading, we prefer the 5-minute chart. It filters out the erratic noise of the 1-minute chart while still providing timely entry signals. The standard daily VWAP resets every morning, giving you a fresh look at intraday institutional sentiment.
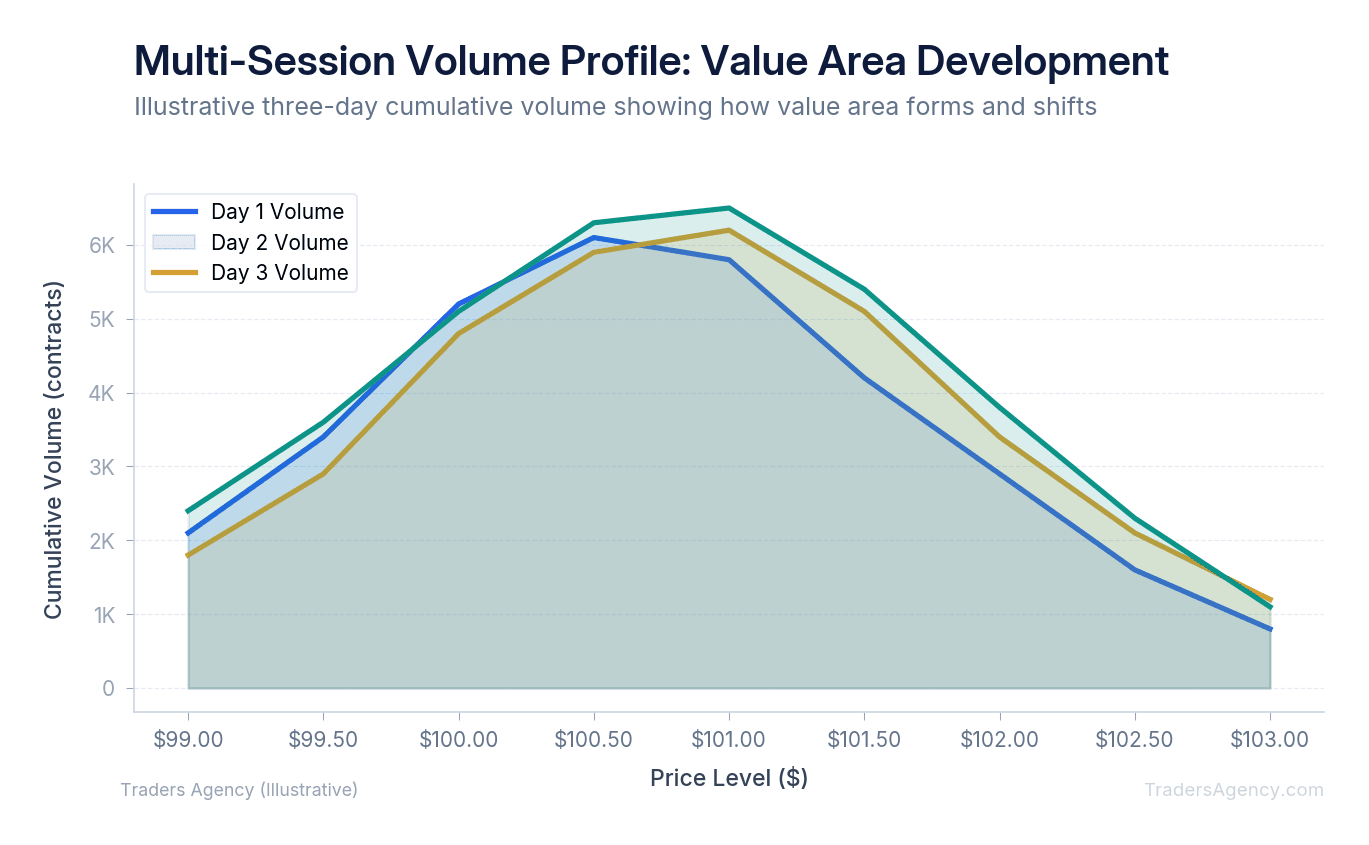
If you're holding positions for several days, a single session's data is not enough. We teach our swing traders to use a Multi-Session Volume Profile covering the last 10 to 20 days. This reveals the broader value area and helps identify major structural support levels that institutions defend over weeks, not just hours.
How Do You Apply Anchored VWAP for Swing Trading?
You apply anchored VWAP for swing trading by attaching the indicator to a significant past event, such as an earnings gap or a major market top. This creates a custom volume-weighted average price line that tracks the exact cost basis of buyers and sellers since that specific event occurred.
Unlike standard VWAP, which resets daily, Anchored VWAP continues indefinitely from your chosen starting point. If a company reports massive earnings and the stock gaps up, we anchor a VWAP to the first candle of that trading day.
Key Concept: Anchored VWAP lets you track the average cost basis of every trader who entered a position after a specific event. Months later, if the stock pulls back to that anchored VWAP line, it frequently acts as major support because those buyers will defend their positions.
When you combine an anchored VWAP with a multi-session volume profile, you can pinpoint long-term swing trade entries with remarkable accuracy. The anchored VWAP tells you where institutional cost basis sits, and the volume profile confirms whether that level has enough historical transaction density to hold.
What Is the Point of Control in Volume Profile Trading?
The Point of Control (POC) in volume profile trading is the specific price level that saw the highest volume of trading activity during a given period. Traders use this level as a magnet for price action, expecting it to act as strong support during uptrends or heavy resistance during downtrends.
The POC is the thickest line on your volume profile histogram. It represents the exact price where buyers and sellers agreed the most on fair value. Because so much volume was transacted there, it naturally becomes a sticky area for price action.
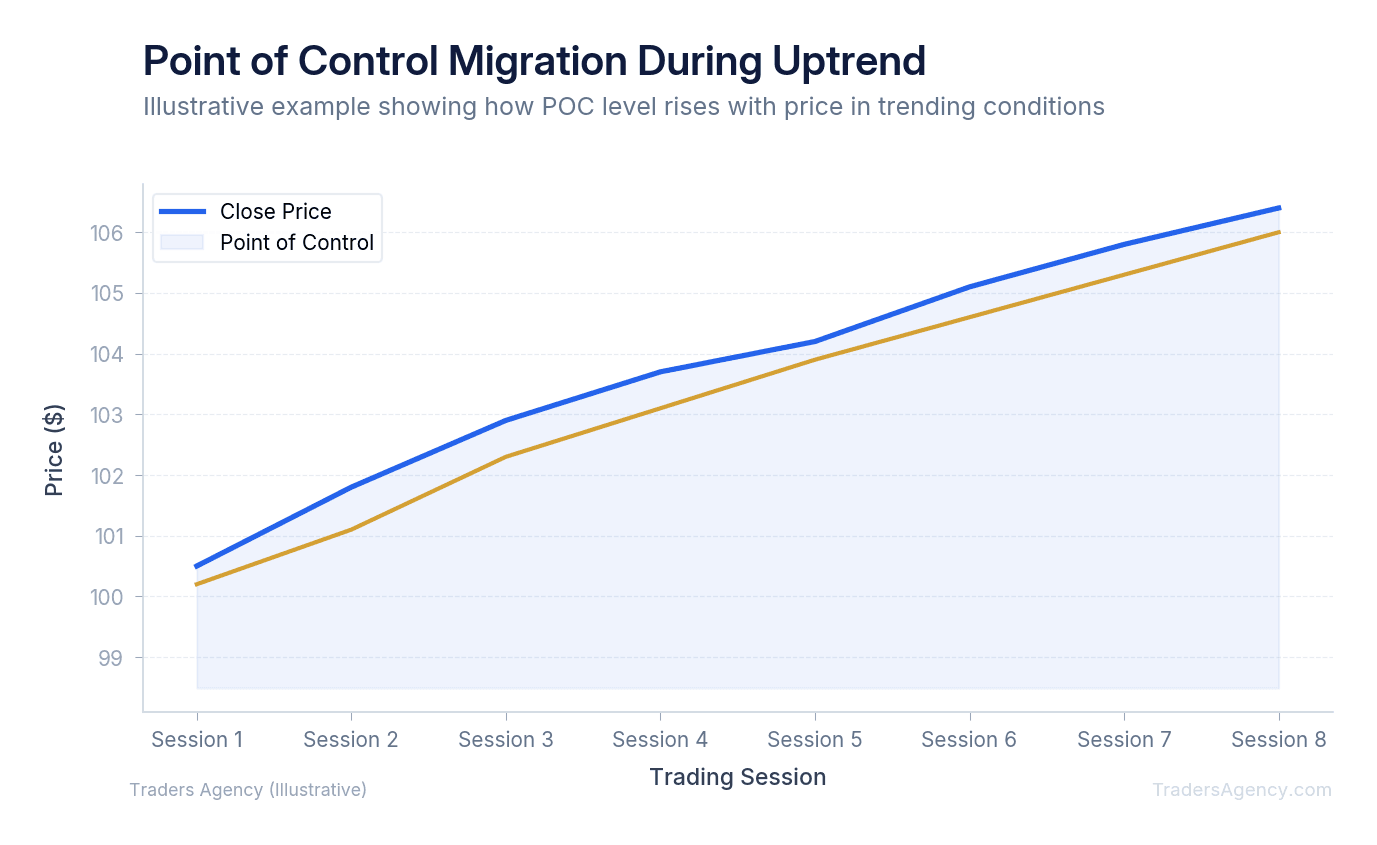
When price breaks away from the POC, it signals a shift in market sentiment. If the price later returns to an old POC, we expect a reaction. Institutions that accumulated shares at that level will often defend it to protect their average cost basis.
When Should You Not Use VWAP in Trading?
You should not use VWAP in trading during highly illiquid market conditions or late in the trading session when the indicator becomes too flat to provide meaningful dynamic support. VWAP also loses its effectiveness in low-volume penny stocks where institutional benchmarks do not drive the primary price action.
VWAP is a volume-based calculation. If a stock trades fewer than 500,000 shares a day, the VWAP line will be erratic and unreliable. We strictly avoid using this strategy on low-float, low-volume assets.
Another common mistake is trying to trade VWAP bounces in the final hour of the trading day. By 3:00 PM Eastern Time, the VWAP has accumulated so much volume data that it barely moves. It becomes a static line rather than a dynamic support level, leading to false signals.
Common Mistakes to Avoid
Our team sees traders make the same errors when combining these tools. Here is what you must avoid:
Watch Out: These three mistakes account for the majority of losses we see from traders using this strategy. Read them carefully before placing your first trade.
- Buying in a Low Volume Node: Never initiate a reversal trade in a low-volume gap. Price moves rapidly through these zones, and your stop loss will get triggered almost instantly.
- Ignoring the Broader Trend: A volume profile support level will not save you if the overall market is in a freefall. Always align your trades with the daily chart's primary trend direction.
- Over-relying on the Value Area: In a strongly trending market, price will break out of the value area and stay out. Do not blindly short a stock just because it left the upper value area boundary.
Risk Management Rules
No indicator combination works 100% of the time. Volume profile and VWAP are tools for finding favorable risk-to-reward setups, not guarantees.
We require our traders to define their risk before ever clicking the buy button. If you enter a trade at VWAP, your stop loss must be placed below the nearest volume profile support node. If that node breaks, the trade thesis is invalid, and you must exit immediately.
Risk Warning: Never risk more than 1% to 2% of your total account on a single setup. By keeping your losses small when the levels fail, you ensure you have enough capital to capitalize when the institutional support holds perfectly.
The Traders Agency education team publishes new strategy guides and market analysis every week. If you found this approach useful, apply it in a paper trading account first. Build confidence with the confluence setup before committing real capital.
Want expert trading insights delivered daily?
Join thousands of traders who rely on Traders Agency for market analysis and trade ideas.
Join Traders AgencyKey Takeaways
- Volume profile shows total volume traded at specific price levels as horizontal zones, while VWAP calculates a dynamic volume-weighted average price that resets each trading day.
- Institutional traders watch VWAP closely, making it a reliable real-time indicator of market sentiment rather than just a lagging average.
- The highest-probability setups occur when a key volume profile level and VWAP converge at the same price, creating a confluence zone with institutional backing on both sides.
- Risk management is built into the strategy: never risk more than 1% to 2% of total account capital on a single setup, so losing trades at failed levels do not wipe out gains from successful ones.
- Paper trading the confluence setup before committing real capital is the recommended path to building the pattern recognition needed to execute it consistently.
DISCLAIMER: Traders Agency does not offer financial advice. The information provided is for educational purposes only and should not be considered financial advice. Traders Agency is not responsible for any financial losses or consequences resulting from the use of the information provided. Trading carries inherent risks and may not be suitable for all individuals. You are advised to conduct your own research and seek personalized advice before making any investment decisions, recognizing the potential risks and rewards involved.
See more from Traders Agency on Google
Make us a preferred source and our market analysis will appear more prominently in your Google Search, Top Stories, and AI results.
Add to Preferred Sources