
You have probably seen this happen before. You find a perfect setup on a 15-minute chart, execute the trade, and immediately watch the stock reverse and stop you out. When you zoom out to the daily chart afterward, you realize you just bought directly into a major resistance level. This single mistake costs traders thousands of dollars every month, and it is entirely preventable.
Multiple timeframe analysis is a technical trading strategy that involves monitoring the same asset across different chart timeframes to determine the primary trend and pinpoint precise entry and exit levels. We are going to walk you through how to use a top-down approach to align your trades with the dominant market trend. By the end of this guide, you will know exactly how to combine daily and intraday charts to improve your trade timing, reduce false signals, and manage your risk effectively.
What Is Multiple Timeframe Analysis and Why Do Traders Use It?
Bottom Line: Multiple timeframe analysis works because it forces you to trade with the trend rather than against it. The core discipline is simple: use the daily chart to establish context and direction, then drop to an intraday chart only to time your entry. Traders who skip the higher timeframe check are not analyzing the market, they are guessing.
Multiple timeframe analysis is the practice of viewing a single security on two or more timeframes to make trading decisions. Traders use this approach because higher timeframes reveal the dominant market trend, while lower timeframes provide low-risk entry points. This alignment significantly increases the probability of a successful trade.
Think of it like a weather forecast. The weekly chart tells you the season, the daily chart tells you today's weather, and the 15-minute chart tells you if it is raining right now. You would not wear a winter coat in July just because of a brief cold breeze. Similarly, you should not short a stock in a massive weekly uptrend just because of a five-minute red candle.
Key Concept: Multiple timeframe analysis means using higher timeframes to identify the dominant trend and lower timeframes to find precise, low-risk entry points. Trading in the direction of the higher timeframe trend is the simplest way to improve your win rate.
When you trade with the larger trend, you have institutional money flowing in your direction. Trend alignment is a fundamental risk management tool that experienced traders rely on daily. Our team recommends looking at the market through multiple lenses before risking capital. A single timeframe only tells a fraction of the story. By combining perspectives, you build a complete picture of where price is likely to go next.
The Top-Down Approach: Weekly, Daily, and Intraday Charts Together
We teach our members to use a top-down approach for market analysis. This means starting with the broadest view of the market and systematically zooming in to find your exact execution point.
The weekly chart provides the big picture. We use this timeframe to identify major support and resistance zones that have formed over months or years. If a stock is approaching a level that has rejected price three times in the past two years, you need to know about it.
The daily chart provides the setup. This is where we look for our specific trading patterns, such as bull flags, moving average crossovers, or breakouts. The daily chart tells us what the stock is trying to do this week.
The intraday chart provides the execution. Once we have a bullish setup on the daily chart, we drop down to a 60-minute or 15-minute chart to find our entry. We look for a short-term pullback to a minor support level so we can enter with a tight stop loss.
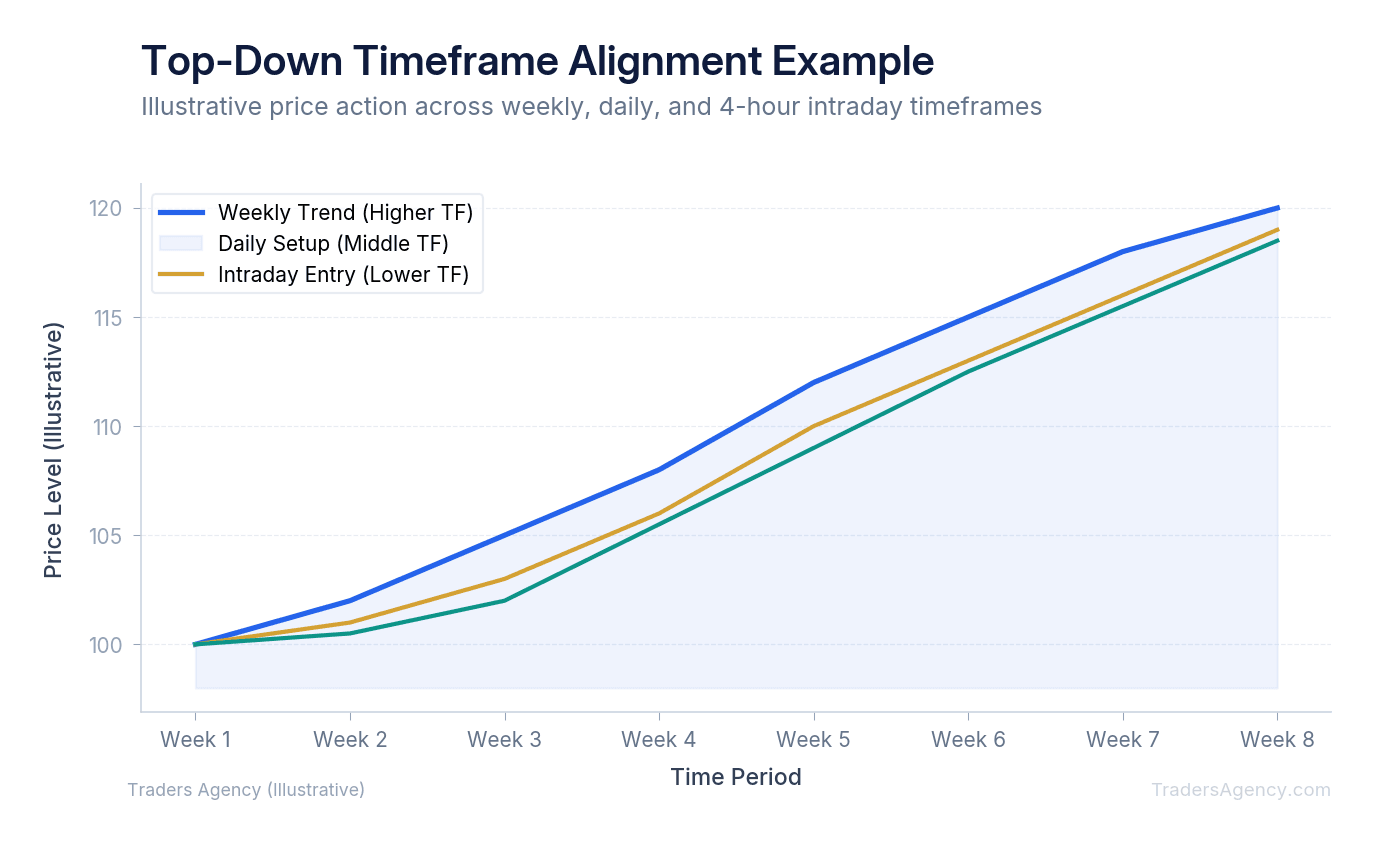
When all three timeframes point in the same direction, you have a high-probability setup. If the weekly is trending up, the daily is breaking out, and the intraday chart is showing strong momentum, the path of least resistance is clearly higher.
What Are the Best Timeframe Combinations for Day Traders vs. Swing Traders?
The best timeframe combinations depend on your trading style, but a common guideline is using a ratio of 1:4 to 1:6 between charts. Day traders typically combine the 60-minute chart for trend direction with the 5-minute chart for entries. Swing traders usually pair the weekly chart with the daily chart.
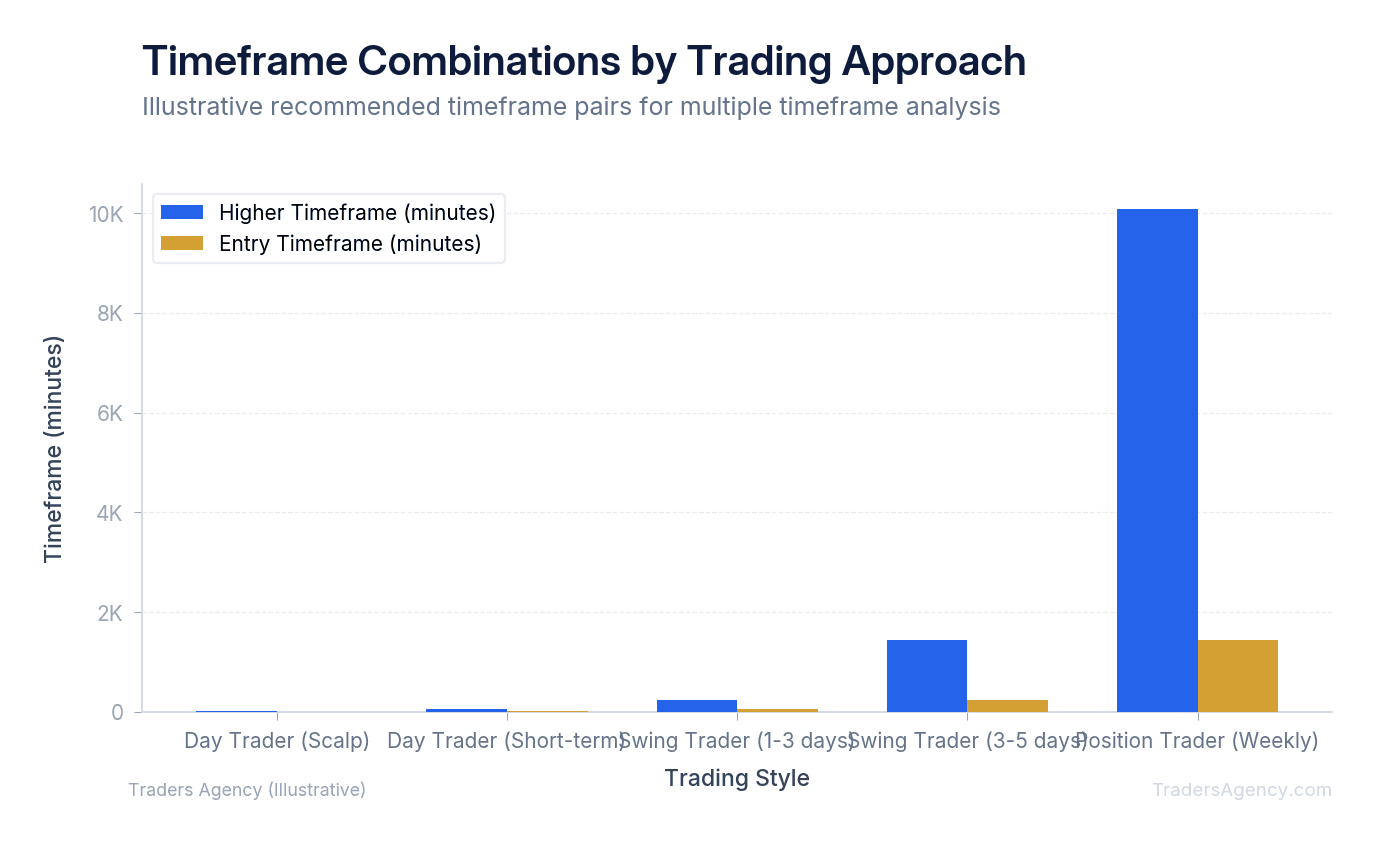
We prefer to use specific pairings based on the intended holding period of the trade. Using timeframes that are too close together will not give you enough contrast. Using timeframes that are too far apart will make the data irrelevant to your specific trade.
Here is what we teach our members regarding timeframe pairings:
| Trading Style | Trend Timeframe | Entry Timeframe |
|---|---|---|
| Scalping | 15-minute chart | 1-minute or 2-minute chart |
| Day Trading | 60-minute chart | 5-minute chart |
| Short-term Swing Trading | Daily chart | 1-hour chart |
| Position Trading | Weekly chart | Daily chart |
Sticking to these ratios ensures you get a clear view of the macro trend while maintaining precision on your micro entries.
Want expert trading insights delivered daily?
Join thousands of traders who rely on Traders Agency for market analysis and trade ideas.
Join Traders AgencyHow Do You Align Daily Trend Direction with Intraday Entry Points?
You align daily trend direction with intraday entry points by first identifying the primary trend on the daily chart using moving averages or price action. Once you confirm an uptrend, you drop down to an intraday chart and wait for a pullback to a support level before buying.
We will walk through a specific example using the SPDR S&P 500 ETF Trust (SPY). Assume you are looking for a swing trade that you plan to hold for three to five days.
- Identify the Daily Trend: Open the daily chart for SPY. The price is currently at $510.00 and trading cleanly above its 50-day Simple Moving Average (SMA). The sequence of highs and lows shows higher highs and higher lows. The daily trend is definitively bullish.
- Locate Daily Support and Resistance: Mark your key levels on that same daily chart. You notice previous resistance turned support at $505.00. You also see the next major resistance level is not until $520.00. This gives you a clear profit target and a logical area to look for buyers to step in.
- Zoom Into the Intraday Chart: Switch to the 15-minute chart. You are not looking to buy blindly just because the daily chart is bullish. You want to wait for SPY to pull back toward that $505.00 level intraday.
- Execute the Entry: On Tuesday morning, SPY dips to $505.50 on the 15-minute chart. It prints a bullish hammer candlestick, showing buyers are defending the level. You enter long at $506.00.
- Set Your Risk Parameters: Because you timed your entry on the intraday chart, you can place a tight stop loss at $504.50, just below the daily support level. Your risk is $1.50 per share. Your target remains the daily resistance at $520.00, offering a potential reward of $14.00 per share.
| Parameter | Value |
|---|---|
| Ticker | SPY |
| Entry Price | $506.00 |
| Stop Loss | $504.50 |
| Risk Per Share | $1.50 |
| Profit Target | $520.00 |
| Reward Per Share | $14.00 |
| Risk-to-Reward Ratio | 1:9.3 |
If you trade options, this is the perfect time to buy a $510 strike call option expiring in two weeks. You might pay a $3.50 premium for this contract. By using the intraday chart for entry, you avoid buying the call option at the top of a daily price spike when premiums are inflated.
What Should You Do When Your Timeframes Send Conflicting Signals?
When your timeframes send conflicting signals, you must defer to the higher timeframe because it carries more institutional weight. If the daily chart shows a strong downtrend but the 15-minute chart shows a bullish breakout, you should treat the intraday move as a temporary rally rather than a true reversal.
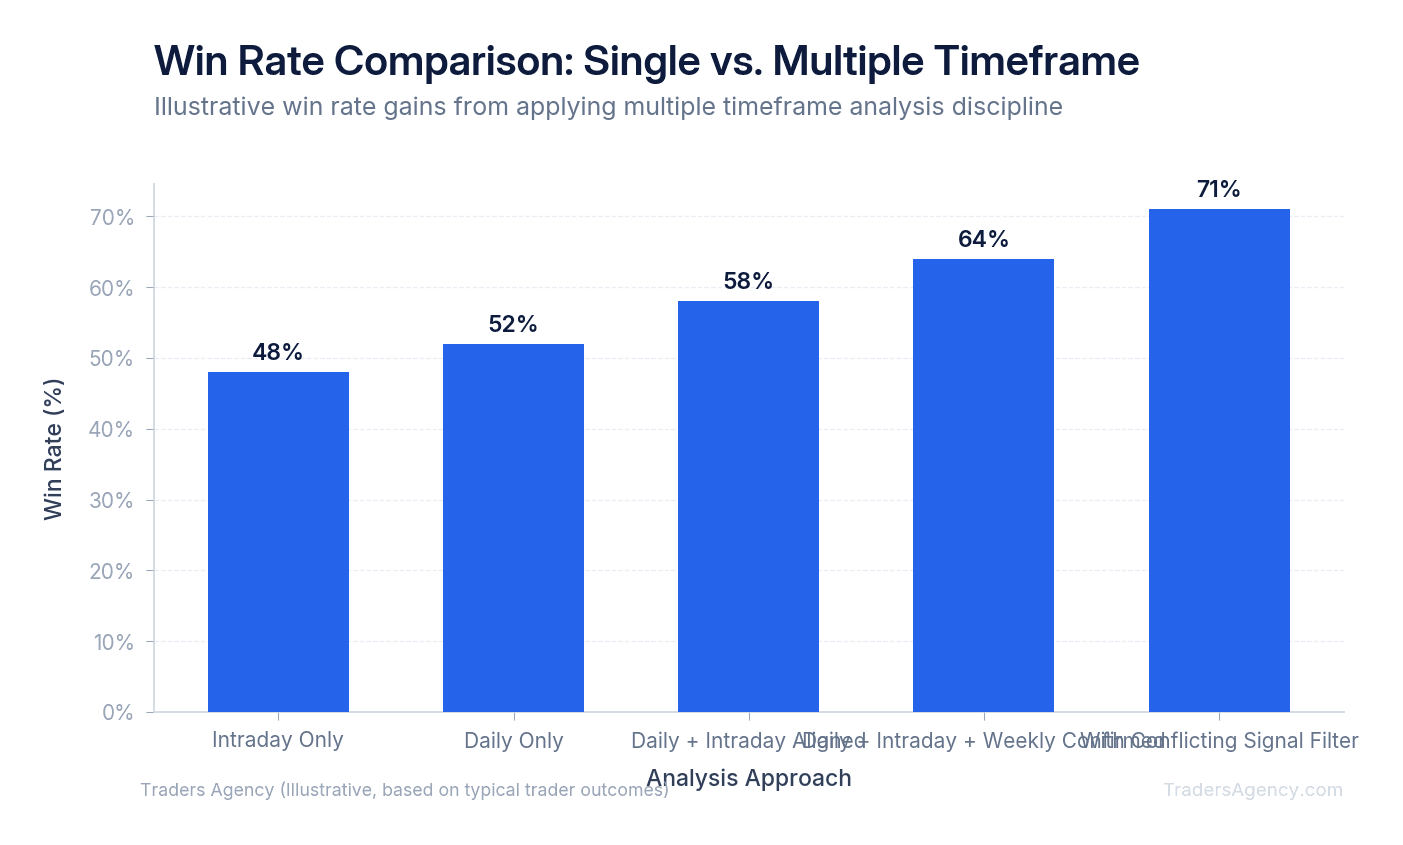
Conflicting signals are the most common source of frustration for intermediate traders. You will frequently see a stock that looks incredibly bullish on a 5-minute chart while looking completely broken on a daily chart.
Watch Out: If the higher timeframe and the lower timeframe disagree, we do not take the trade. We sit on our hands and wait for alignment. Trying to catch the exact bottom of a daily downtrend by trading a 15-minute breakout is a low-probability strategy.
Sometimes, an intraday chart will start a new trend that eventually reverses the daily chart. However, we prefer to wait until the daily chart confirms the reversal before we start looking for intraday long entries.
If you are already in a trade and the lower timeframe starts flashing warning signs, you can use that information to manage your risk. For example, if you are long on a daily setup and the 60-minute chart breaks below a major moving average, you might choose to tighten your stop loss or take partial profits.
How Do You Combine Multiple Timeframe Analysis with RSI and Moving Averages?
You can drastically improve your trade execution by applying technical indicators across different timeframes. The key is looking for alignment between the indicator readings on your macro and micro charts.
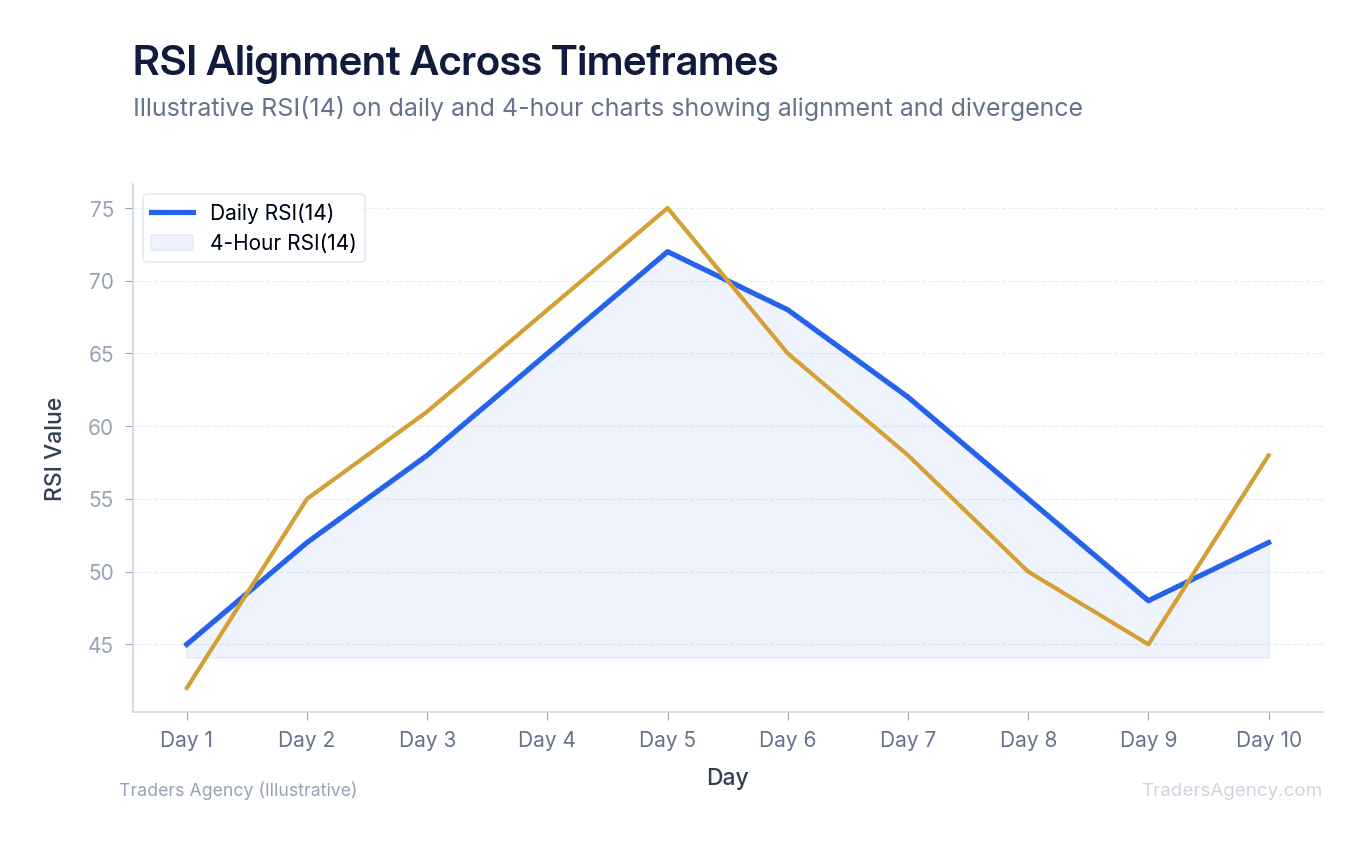
Here is how we use the 14-period Relative Strength Index (RSI) across timeframes:
- Check the daily RSI: Ensure the RSI is in a bullish zone, perhaps around 55. This tells you momentum is positive but not overextended.
- Drop to the 15-minute chart: Wait for the intraday RSI to drop below 30 into oversold territory.
- Enter the trade: Buying an intraday oversold dip while the daily trend is strong is one of the most reliable setups we teach.
You can apply the same logic to moving averages. We like to see a stock trading above its 20-day EMA on the daily chart. Once that condition is met, we switch to the 5-minute chart and look to buy pullbacks that bounce off the intraday 50-period SMA.
Key Concept: By requiring both timeframes to meet specific indicator criteria, you filter out dozens of low-quality trades every week. The daily chart confirms the trend. The intraday chart confirms the timing.
Common Multi-Timeframe Analysis Mistakes and How to Avoid Them
Even experienced traders make mistakes when trying to implement multiple timeframe analysis. The process requires discipline and patience. Here are the most common errors we see and how you can avoid them.
Analysis Paralysis
Looking at too many timeframes will freeze your decision-making process. If you check the weekly, daily, 4-hour, 1-hour, 15-minute, 5-minute, and 1-minute charts, you will always find a reason not to trade. Stick to two or three timeframes maximum.
Starting from the Bottom Up
Many traders find a setup on a 5-minute chart and then check the daily chart hoping to find confirmation. This is backward. You will naturally suffer from confirmation bias and ignore daily resistance levels just to justify your intraday idea. Always start with the higher timeframe first.
Mismanaging Stop Losses
When you enter a trade based on an intraday chart, your stop loss should be placed at a technically meaningful level. A common mistake is entering on a 15-minute pullback but placing a stop loss based on the weekly chart. This creates a massive risk profile that will destroy your risk-to-reward ratio. Place your stop just beyond the nearest relevant support or resistance level, whether that comes from the entry timeframe or the daily chart.
Ignoring Market Context
A perfect multi-timeframe setup on an individual stock can still fail if the broader market is tanking. Always check the daily chart of the S&P 500 or the Nasdaq 100 before executing your stock-specific trades.
Risk Warning: We recommend risking no more than 1% to 2% of your total account equity on any single multi-timeframe setup. No matter how perfectly the daily and intraday charts align, the market can always act irrationally. Proper position sizing ensures you stay in the game long enough for the probabilities to work in your favor.
Want expert trading insights delivered daily?
Join thousands of traders who rely on Traders Agency for market analysis and trade ideas.
Join Traders AgencyKey Takeaways
- Higher timeframes reveal the dominant trend while lower timeframes like the 15-minute chart identify precise, low-risk entry points. Using both together prevents buying directly into major resistance levels.
- The top-down approach works in three layers: the weekly chart shows the broader trend direction, the daily chart confirms today's conditions, and the intraday chart times the actual entry.
- When timeframes send conflicting signals, the higher timeframe always takes priority. A bullish 15-minute setup means nothing if the daily chart shows a downtrend.
- Always check the daily chart of the S&P 500 or Nasdaq 100 before executing individual stock trades. A perfect multi-timeframe setup on a single stock can still fail if the broader market is selling off.
- Risk no more than 1% to 2% of total account equity on any single multi-timeframe setup, regardless of how well the daily and intraday charts align.
DISCLAIMER: Traders Agency does not offer financial advice. The information provided is for educational purposes only and should not be considered financial advice. Traders Agency is not responsible for any financial losses or consequences resulting from the use of the information provided. Trading carries inherent risks and may not be suitable for all individuals. You are advised to conduct your own research and seek personalized advice before making any investment decisions, recognizing the potential risks and rewards involved.
See more from Traders Agency on Google
Make us a preferred source and our market analysis will appear more prominently in your Google Search, Top Stories, and AI results.
Add to Preferred Sources