
You have probably seen this frustrating scenario play out before. You buy a stock, set a tight stop loss to protect your capital, and watch the price dip just enough to trigger your exit. Then the stock immediately reverses and runs higher without you. You were right about the direction, but your stop was too tight. This happens because many traders guess where to place their stops using random dollar amounts or arbitrary percentages. In this guide, our team will show you exactly how to stop guessing and start sizing your positions based on real market data using the Average True Range (ATR) indicator.
Key Concept: ATR position sizing is a mathematical risk management method that uses the Average True Range indicator to determine exactly how many shares to buy based on a stock's current daily volatility. By factoring in normal price swings, this approach helps you set logical stop losses and calculate precise share quantities to keep account risk strictly controlled.
We will walk you through the math, the indicator settings, and the exact steps to protect your capital. By the end of this tutorial, you will know how to calculate your trade size based on actual market behavior, not guesswork.
What Is Average True Range (ATR) and How Is It Calculated?
Bottom Line: ATR position sizing gives traders a repeatable, data-driven framework for setting stops and calculating share size based on how much a stock actually moves, not how much a trader hopes it will move. The core discipline is keeping dollar risk per trade constant regardless of a stock's price or volatility. The ATR does not predict direction, but it removes guesswork from the two decisions that determine whether a trader survives long enough to be right.
The Average True Range (ATR) is a technical indicator that measures market volatility by calculating the average price movement of an asset over a specific period. It tells you exactly how much a stock typically moves in a single day, expressed as a simple dollar amount.
We teach our members to think of ATR like a car's suspension system. If you are driving on a smooth, paved highway, you do not need much suspension travel. If you are driving on a rocky dirt road, you need a lot of room for the tires to bounce.
Stocks work the exact same way. A slow-moving utility stock might only move $0.50 a day. A high-growth technology stock might swing $5.00 a day. The ATR indicator automatically calculates this daily "bounce" for you.
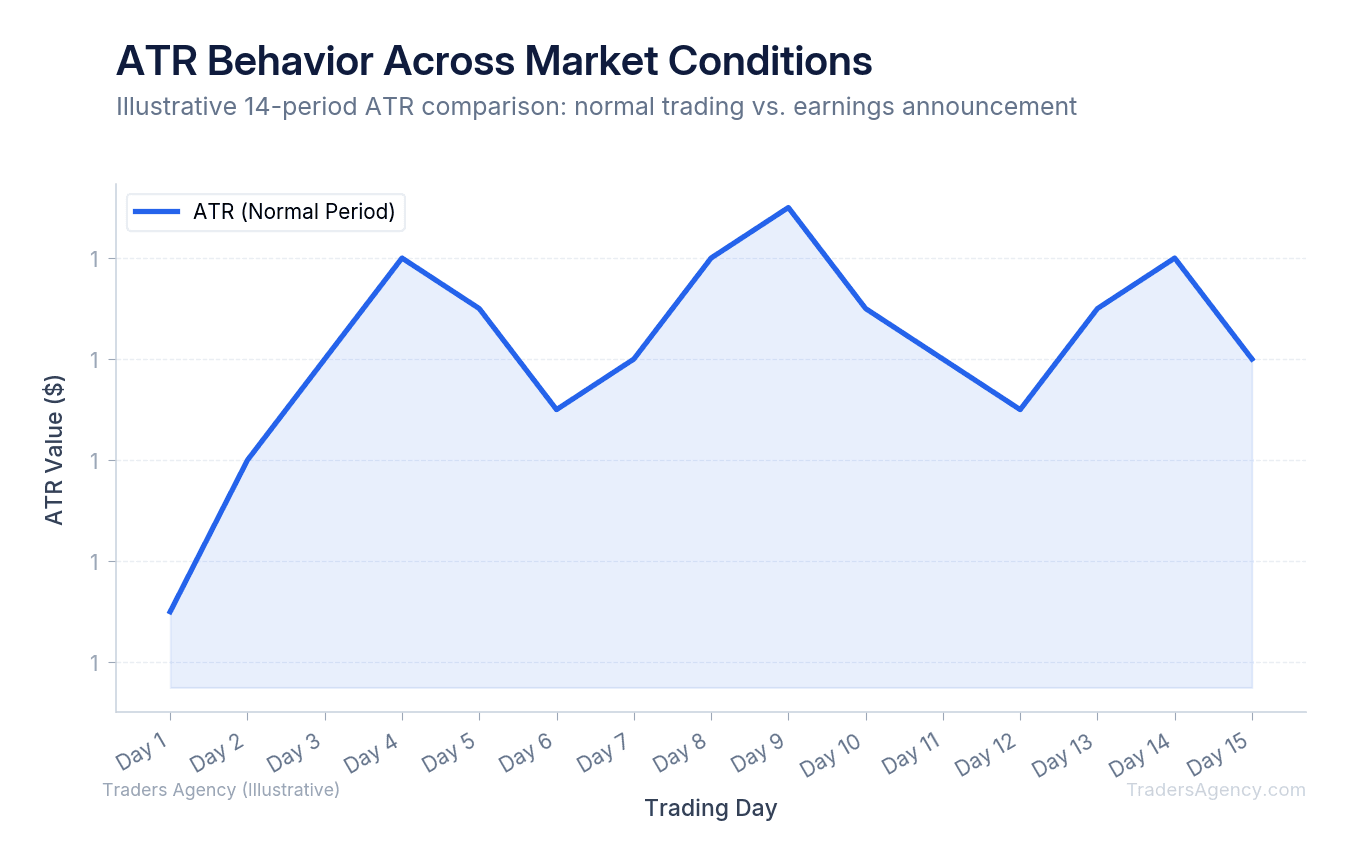
By default, most charting platforms use a 14-period ATR. On a daily chart, this means the indicator looks at the last 14 trading days to find the average daily range.
To find the True Range for a single day, the indicator evaluates three measurements:
- The current high minus the current low
- The absolute value of the current high minus the previous closing price
- The absolute value of the current low minus the previous closing price
The highest of these three numbers is the True Range for that day. The indicator then averages these values over the last 14 days to produce the ATR reading. Understanding historical volatility is a fundamental component of managing investment risk, and the ATR gives you a clean, objective way to measure it. You can learn more about volatility and risk fundamentals through the SEC's investor education resources.
When a stock reports earnings or releases major news, you will see the ATR value spike. This tells you the stock is experiencing wider price swings and requires more breathing room for your stops.
How Do You Use ATR for Stop Loss Placement?
You use ATR for stop loss placement by subtracting a multiple of the current ATR value from your entry price. This places your exit point outside the stock's normal daily price noise, preventing premature exits while still capping your maximum potential loss.
Many beginners make the mistake of using a fixed-dollar stop loss. They might decide they will risk exactly $2.00 on every single trade. This approach completely ignores the stock's unique personality. A $2.00 stop on a volatile stock that normally moves $5.00 a day guarantees you will get stopped out by normal market noise.
Instead, our team prefers an ATR-based stop loss. If a stock has an ATR of $1.50, we know it normally wiggles by that much every single day. To survive that normal wiggle, we place our stop loss further away.
A common standard is the 1.5x ATR multiplier. Here is how it works:
| Parameter | Value |
|---|---|
| Entry Price | $50.00 |
| 14-Day ATR | $1.50 |
| ATR Multiplier | 1.5x |
| Stop Loss Distance | $2.25 ($1.50 x 1.5) |
| Stop Loss Price | $47.75 ($50.00 - $2.25) |
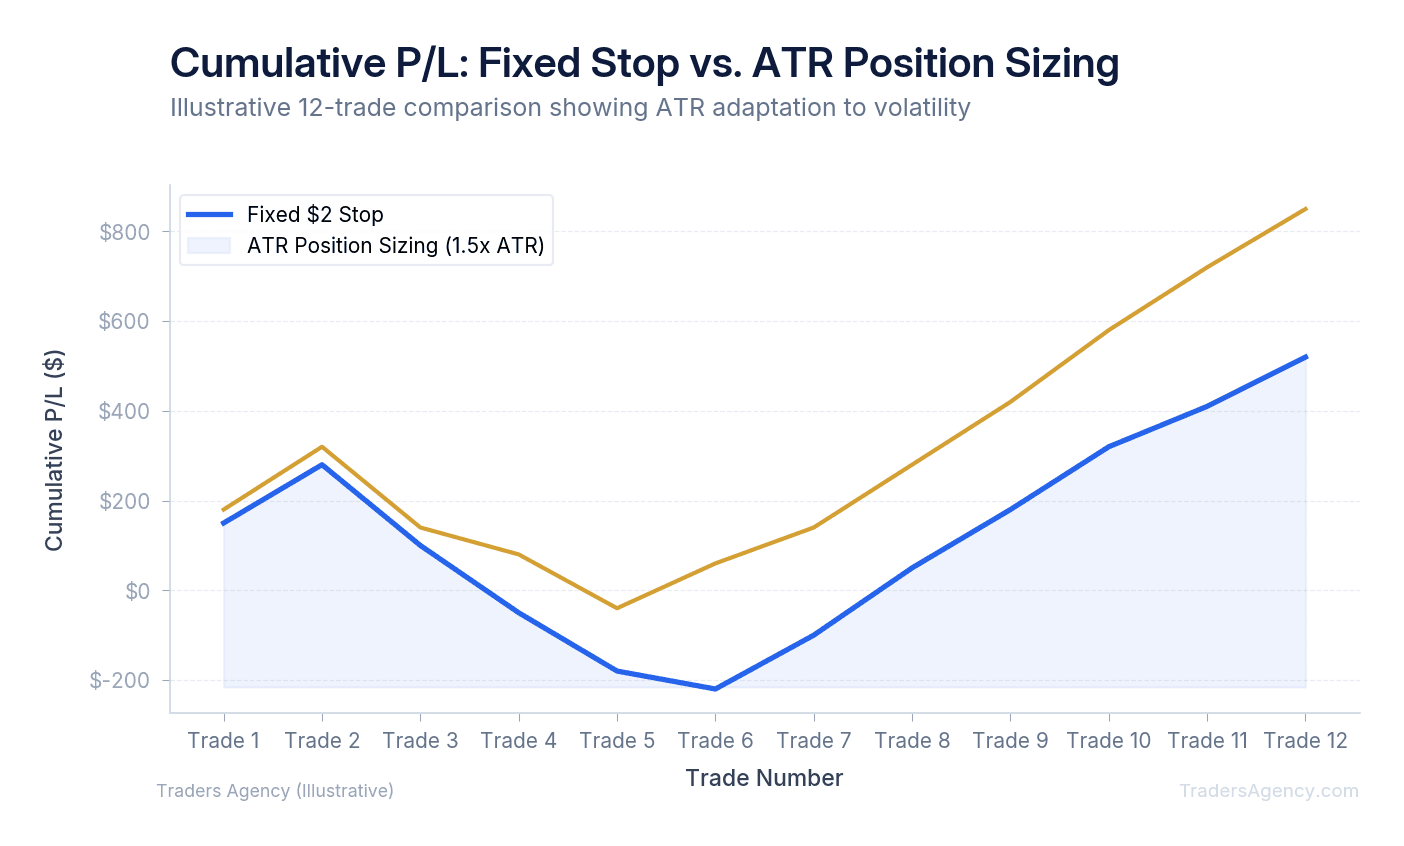
This method naturally adapts to the market environment. If overall market volatility drops, your calculated stop tightens. If volatility expands, your stop widens to give the trade the exact room it needs to breathe.
How Does the ATR Position Sizing Formula Work?
This is where the math truly protects your account. We use volatility-based position sizing to ensure every trade carries the exact same financial risk, regardless of the stock's price or how wild it moves.
Key Concept: The core formula is simple: Position Size = Account Risk ÷ Stop Loss Distance. This tells you exactly how many shares to buy so that if your stop loss triggers, you only lose your predetermined risk amount.
Here is the exact step-by-step process we teach our members. We will walk through a complete example with real numbers so you can apply this to your own account today.
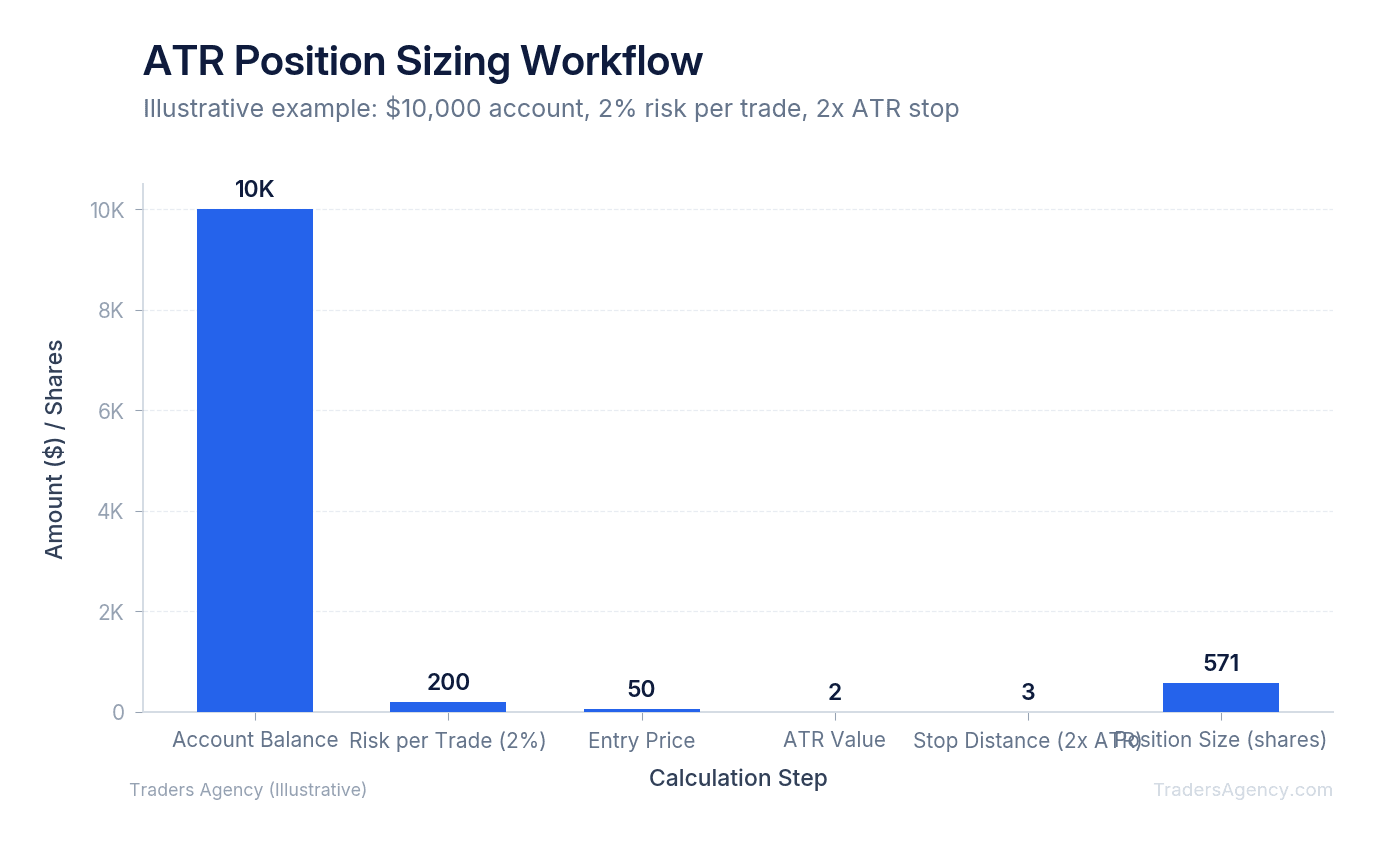
- Determine Your Account Risk. Decide how much money you are willing to lose on a single trade. We strongly recommend risking no more than 1% to 2% of your total account balance per trade. If you have a $10,000 trading account and decide to risk 2%, your maximum dollar risk per trade is exactly $200.
- Find the Stop Loss Distance. Look at your daily chart and find the current ATR value. Say you want to buy XYZ stock at $50.00. The 14-day ATR reading is $1.50. You decide to use a 1.5x ATR multiplier. Multiply $1.50 x 1.5 to get a total stop loss distance of $2.25.
- Calculate the Share Count. Divide your $200 account risk by the $2.25 stop loss distance. $200 ÷ $2.25 = 88.88 shares. We always round down to the nearest whole share to stay safe. You will buy exactly 88 shares of XYZ stock.
| Step | Calculation | Result |
|---|---|---|
| Account Balance | Starting capital | $10,000 |
| Risk Percentage | 2% of $10,000 | $200 |
| Entry Price | XYZ current price | $50.00 |
| ATR (14-day) | Current reading | $1.50 |
| Stop Distance | $1.50 x 1.5 | $2.25 |
| Stop Loss Price | $50.00 - $2.25 | $47.75 |
| Position Size | $200 ÷ $2.25 (rounded down) | 88 shares |
| Actual Risk | 88 x $2.25 | $198 |
If the trade goes against you and hits your stop loss at $47.75, you will lose exactly $198 (88 shares multiplied by the $2.25 loss per share). You have perfectly contained your risk using ATR position sizing.
Want expert trading insights delivered daily?
Join thousands of traders who rely on Traders Agency for market analysis and trade ideas.
Join Traders AgencyWhat ATR Multiplier Should You Use?
A good ATR multiplier for stop losses typically ranges between 1.5x and 3.0x the current ATR value. Choosing the right multiplier depends entirely on your trading timeframe and personal goals. There is no single perfect number, but there are clear guidelines based on how markets behave.
If you set your multiplier too low (like 1.0x ATR), you will experience a high number of false exits. The stock will hit your stop loss and then bounce right back in your desired direction. If you set your multiplier too high (like 4.0x ATR), you give the trade too much room and suffer larger drawdowns before the system finally cuts your loss.
Here is how our team categorizes multiplier selection for different trading styles:
| ATR Multiplier | Best For | Typical Holding Period |
|---|---|---|
| 1.5x ATR | Short-term swing trades | A few days |
| 2.0x ATR | Standard swing trading (our baseline) | One to several weeks |
| 3.0x ATR | Long-term trend following | Multiple weeks to months |
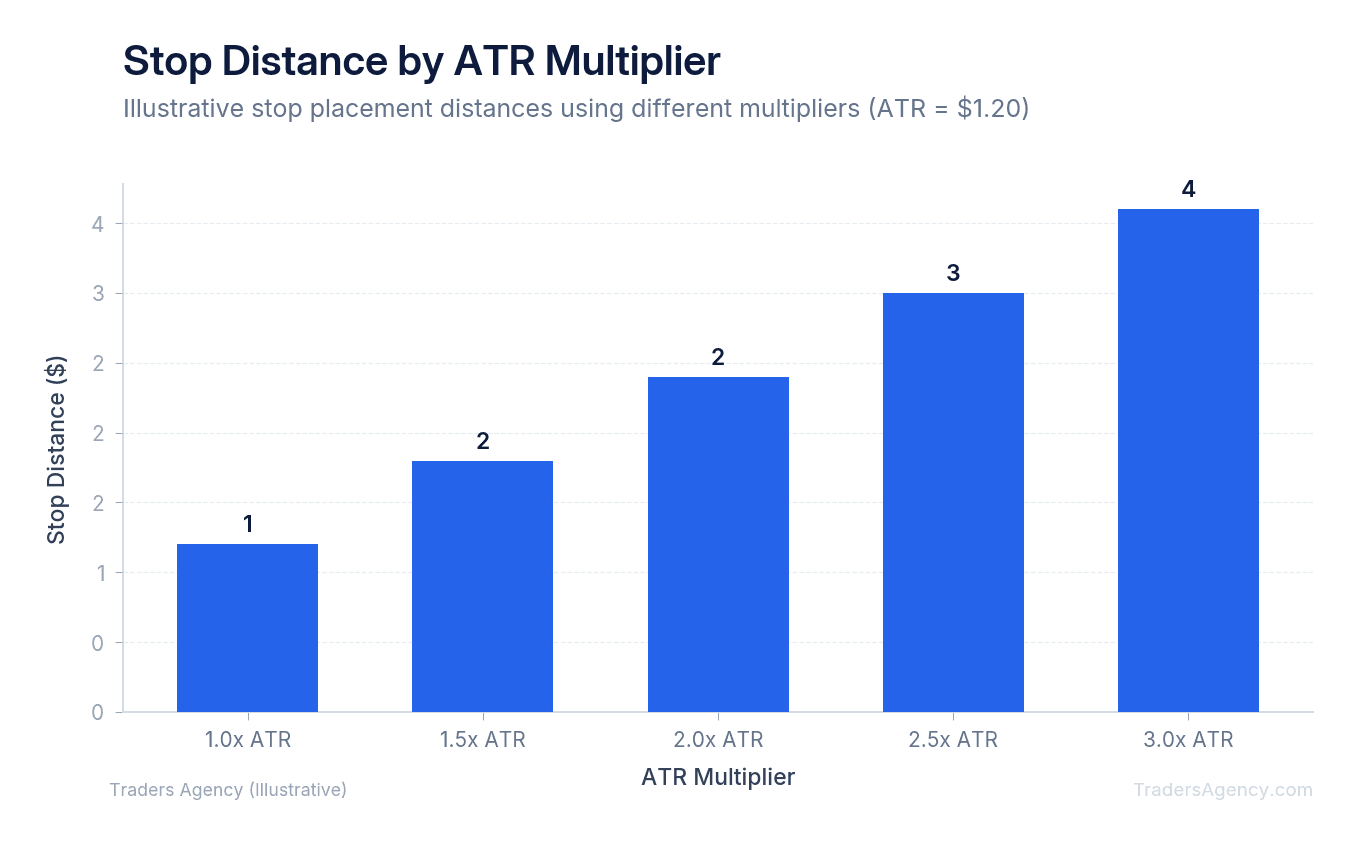
Remember that as you increase your multiplier, your stop loss distance increases. Because of the ATR position sizing formula, a wider stop loss means you must buy fewer shares to keep your total dollar risk constant. The math always balances itself out.
What Are Chandelier Exits and How Do They Use ATR?
Setting your initial stop loss is only half the battle. You also need a mathematical plan to protect your profits as the stock climbs higher. The Chandelier Exit strategy is an excellent tool for this. Instead of leaving your stop loss at the original entry level, you trail it upward based on current volatility.
The concept is straightforward: the trailing stop "hangs" a specific ATR multiple below the highest high reached since you entered the trade. Here is a quick example:
- Enter the trade. You buy a stock at $50.00.
- Stock rallies to a new high. The price reaches $60.00 and the current ATR reading is $2.00.
- Calculate the trailing stop. Using a 2x ATR multiplier, multiply $2.00 x 2 = $4.00. Subtract that from the new high: $60.00 - $4.00 = $56.00. Your stop is now locked in at $56.00.
- Repeat as the stock climbs. If the stock rises to $65.00, recalculate the ATR and move your stop up again. If the stock drops, your stop stays firmly in place.
This approach lets you ride strong trends while systematically locking in profits along the way. You can learn more about trailing stop mechanics and position management through the educational resources at the CBOE.
Which Timeframes Work Best for ATR?
The daily timeframe works best for ATR because it captures full regular trading sessions and overnight gaps. While you can apply the indicator to weekly or intraday charts, the daily 14-period setting provides the most reliable data for swing traders looking to manage risk effectively.
When you use ATR on an intraday chart, like a 5-minute or 15-minute timeframe, the data can become distorted. The opening hour of the stock market is highly volatile, while the midday session is usually very slow. This causes the intraday ATR value to fluctuate wildly depending on the time of day. A stop loss calculated at 10:00 AM might be far too wide for a trade taken at 1:00 PM.
For this reason, our team prefers to stick to the daily chart. The daily ATR gives you a smoothed, accurate picture of the stock's true daily capability. Even if you are entering a trade based on a 1-hour chart, we recommend checking the daily ATR to calculate your final position size.
How to Combine ATR with Other Indicators
ATR only measures volatility. It does not tell you which direction the stock is going. A high ATR simply means the stock is moving fast, but it could be crashing downward or rocketing upward. You must combine it with directional trend indicators to find your actual entry signals.
Our team likes to use moving averages or support levels for entries, then apply ATR for the risk management layer. A standard setup might look like this:
- Wait for a directional signal. The stock price crosses above the 50-day moving average.
- Confirm momentum. Check the Relative Strength Index (RSI) to confirm upward momentum.
- Measure volatility. Once the buy signal triggers, look at the 14-period ATR on the daily chart.
- Size the position. Calculate your stop loss distance using your chosen ATR multiplier, then divide your account risk by that distance to get your exact share count.
You should use volatility-based position sizing in almost all directional trading strategies. It is especially effective during market transitions and when trading highly volatile growth stocks where fixed-dollar stops frequently fail.
Watch Out: Be careful during major news events. If a company is reporting earnings tomorrow, the historical ATR from the last 14 days will not accurately predict tomorrow's potential gap. During these extreme events, price can gap completely over your stop loss. An ATR stop is a standard market order once triggered, and a stock gapping down overnight might fill your order far below your calculated exit price. Always check the earnings calendar before applying ATR-based risk management to a new swing trade.
By respecting the math and avoiding major news gaps, you can build a highly consistent approach to managing your trading capital. The ATR does not predict the future, but it gives you an honest, data-driven framework for controlling what you can control: your risk on every single trade.
Want expert trading insights delivered daily?
Join thousands of traders who rely on Traders Agency for market analysis and trade ideas.
Join Traders AgencyKey Takeaways
- ATR position sizing uses a stock's actual daily volatility to calculate exactly how many shares to buy, replacing arbitrary dollar amounts or percentage-based stops with math rooted in real market behavior.
- A stop placed too close to the entry price ignores normal daily price swings, which is why technically correct trades get stopped out before the move develops.
- The ATR formula ties share quantity directly to account risk: if a stock has a wide ATR, you buy fewer shares to keep your dollar risk per trade constant.
- Chandelier exits trail your stop as a multiple of ATR below the highest high since entry, locking in gains while giving the trade room to breathe during normal pullbacks.
- ATR-based stops do not protect against overnight gaps, so checking the earnings calendar before entering a swing trade is a required step, not an optional one.
DISCLAIMER: Traders Agency does not offer financial advice. The information provided is for educational purposes only and should not be considered financial advice. Traders Agency is not responsible for any financial losses or consequences resulting from the use of the information provided. Trading carries inherent risks and may not be suitable for all individuals. You are advised to conduct your own research and seek personalized advice before making any investment decisions, recognizing the potential risks and rewards involved.
See more from Traders Agency on Google
Make us a preferred source and our market analysis will appear more prominently in your Google Search, Top Stories, and AI results.
Add to Preferred Sources