
You've probably experienced this firsthand. You watch a stock climb steadily for weeks, finally decide to buy in, and that's the exact moment it reverses and drops. It's frustrating, but it's also preventable. Reversal candlestick patterns are visual price formations on a chart that signal a potential change in market direction, and learning to read them is one of the most practical skills you can develop as a trader. In this guide, our team will walk you through the top 15 reversal and continuation signals so you can time entries and exits with precision, confirm setups with volume, and trade with strict risk management.
What Are Candlestick Reversal Patterns and Why Do They Matter?
Bottom Line: Reversal candlestick patterns give traders an early visual edge, but reading the pattern is only half the work. Combining pattern recognition with volume confirmation and strict risk management is what separates traders who use these tools profitably from those who get burned by false signals. The core lesson here is that no pattern is a guarantee, and position sizing discipline matters as much as the setup itself.
Candlestick reversal patterns are specific price formations that indicate an ongoing trend is about to change direction. They matter because they provide early visual cues of shifting buyer and seller momentum. Traders use these patterns to exit current positions or enter new trades before the broader market reacts.
These visual cues date back centuries to Japanese rice merchants, and they remain a foundational tool in modern technical analysis. The SEC provides general investor education resources that emphasize understanding market dynamics before committing capital, a principle that applies directly to pattern-based trading.
A single candlestick tells us the open, high, low, and close for a specific timeframe. When we group these candles together, they reveal the psychological state of the market. A long green body shows buyers are in complete control. A long upper wick shows buyers tried to push the price higher but were aggressively rejected by sellers.
Key Concept: Think of a market trend like a speeding car. Before it can reverse direction, it must first slow down and stop. Reversal candlestick patterns represent that exact moment of deceleration. They show us where the dominant market participants are losing their grip.
What Is the Difference Between Reversal and Continuation Candlestick Patterns?
The main difference is straightforward: reversal patterns signal a trend is ending and changing direction, while continuation patterns indicate the current trend will resume after a brief pause. Reversals suggest a shift in market control. Continuations represent a temporary consolidation before further movement.
Context is everything in technical analysis. A pattern that looks like a reversal in a choppy, sideways market might actually be a continuation pattern in a strong trend. We teach our members to always identify the dominant trend first.
If you're looking at a daily chart of Microsoft (MSFT) in a clear, multi-month uptrend, you want to look for bullish continuation patterns. If that same stock hits a major historical resistance level, you switch your focus to bearish reversal patterns. Trading is about applying the right tool in the right environment.
What Are the Top Reversal Candlestick Patterns for Spotting Bottoms and Tops?
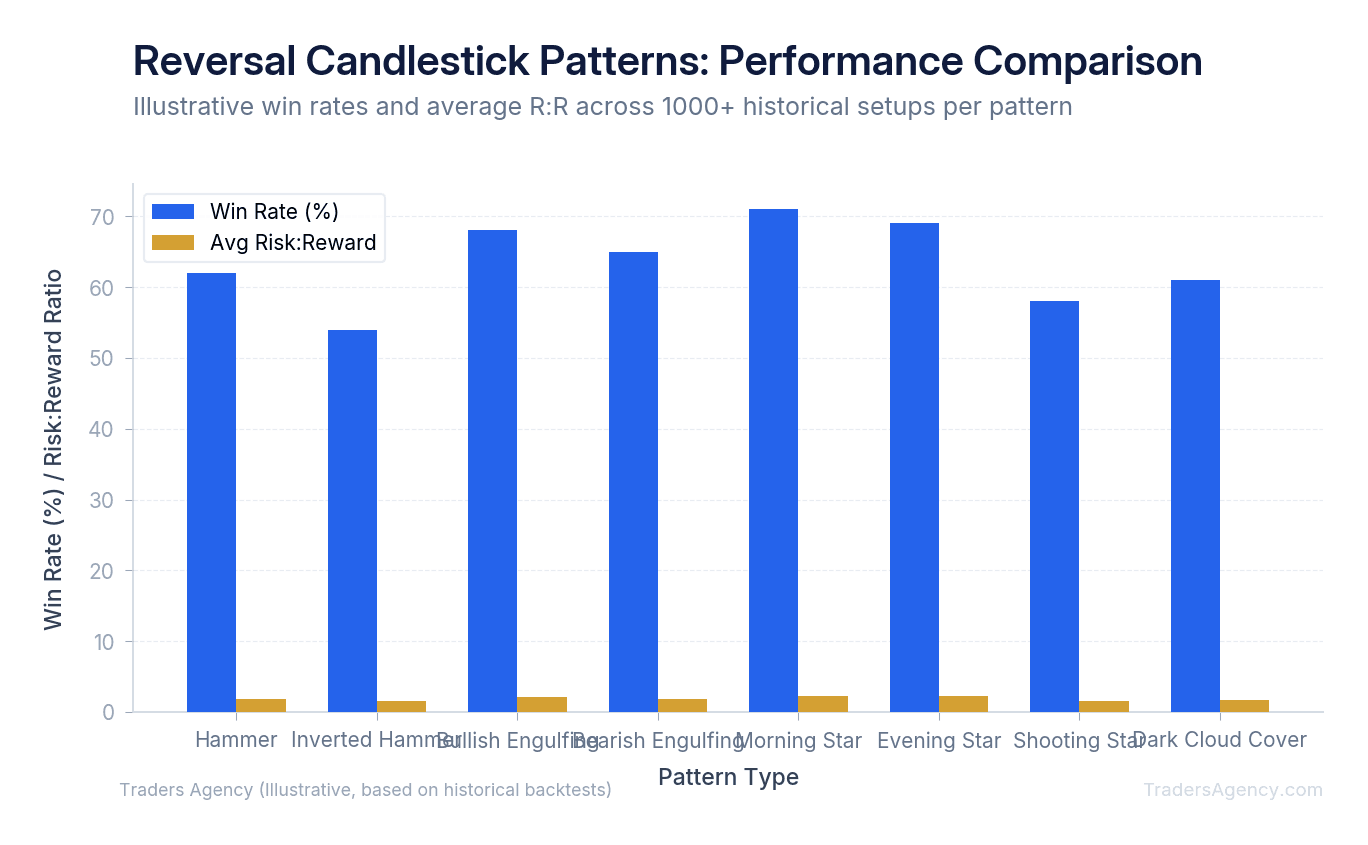
To trade effectively, you need to recognize the most reliable formations instantly. Here are the primary reversal patterns we look for when analyzing a chart.
Bullish Reversals (Spotting Bottoms)
These patterns form at the end of a downtrend. They indicate that sellers are exhausted and buyers are stepping in to push prices higher.
- Hammer: A single candle with a small body and a long lower wick. It shows sellers pushed the price down intraday, but buyers overwhelmed them by the close.
- Inverted Hammer: Similar to the hammer but with a long upper wick. It signals buyers are starting to test higher prices at the bottom of a downtrend.
- Bullish Engulfing: A two-candle pattern where a large green candle completely covers the previous small red candle. This shows a total shift in momentum.
- Morning Star: A three-candle pattern featuring a large red candle, a small-bodied middle candle, and a large green candle. This is one of the most reliable bottoming signals.
- Piercing Line: A two-candle setup where a green candle closes more than halfway up the body of the preceding red candle.
- Bullish Harami: A small green candle contained entirely within the body of the previous large red candle. It shows downward momentum has completely stalled.
- Tweezer Bottoms: Two consecutive candles with matching lows. This formation shows strong institutional support at a specific price level.
Bearish Reversals (Spotting Tops)
These patterns form at the peak of an uptrend. They warn traders that buying pressure is fading and a sell-off is imminent.
- Shooting Star: A single candle with a small body near the low and a long upper wick at the top of an uptrend. It is the exact opposite of a hammer.
- Bearish Engulfing: A large red candle completely swallowing the previous small green candle. This indicates sellers have violently taken control.
- Evening Star: The bearish counterpart to the morning star. It features a large green candle, a small middle candle, and a large red candle.
- Dark Cloud Cover: A green candle followed by a red candle that closes below the midpoint of the green body.
- Hanging Man: Looks exactly like a hammer but appears at the top of an uptrend. It warns that buyers are struggling to maintain higher prices.
- Bearish Harami: A small red candle inside a large green candle. It is an early warning sign that upward momentum is dying.
Which Candlestick Patterns Work Best After a Strong Downtrend?
The morning star and bullish engulfing patterns work best after a strong downtrend. These formations require significant buying pressure to materialize, making them highly reliable indicators of a trend change. The hammer is also highly effective when it forms at major technical support levels following extended selling.
When a stock like Tesla (TSLA) drops for six consecutive weeks, you need strong evidence before trying to catch the bottom. We prefer three-candle patterns like the morning star because they offer built-in confirmation. The first candle shows the panic, the second shows the indecision, and the third shows the new institutional buying.
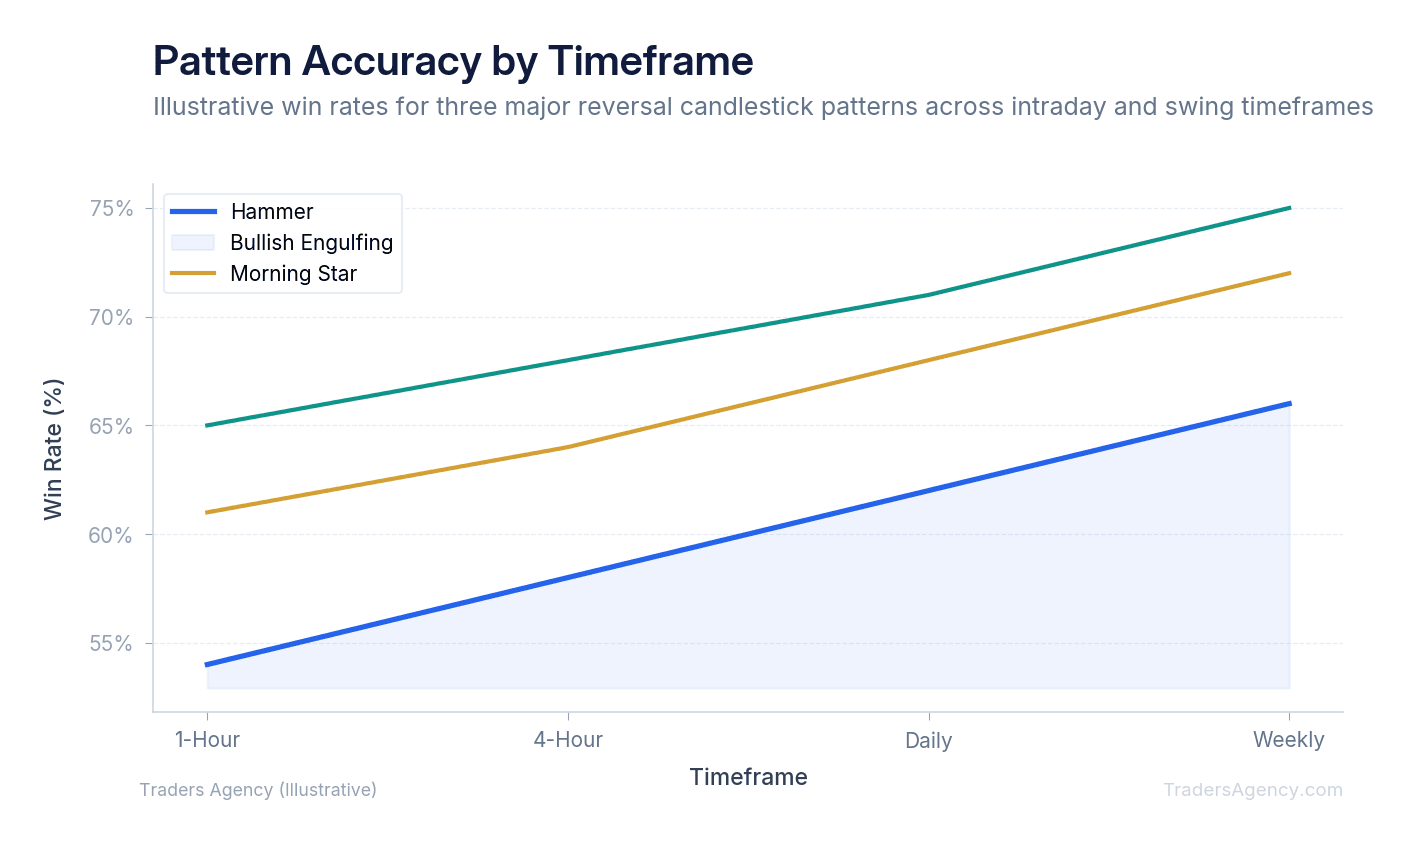
Key Concept: Timeframes matter immensely when evaluating these patterns. A bullish engulfing pattern on a 5-minute chart is mostly intraday noise. That same pattern on a daily or weekly chart carries significant weight and can dictate the trend for the next several months.
Want expert trading insights delivered daily?
Join thousands of traders who rely on Traders Agency for market analysis and trade ideas.
Join Traders AgencyHow Do You Confirm a Candlestick Reversal Signal?
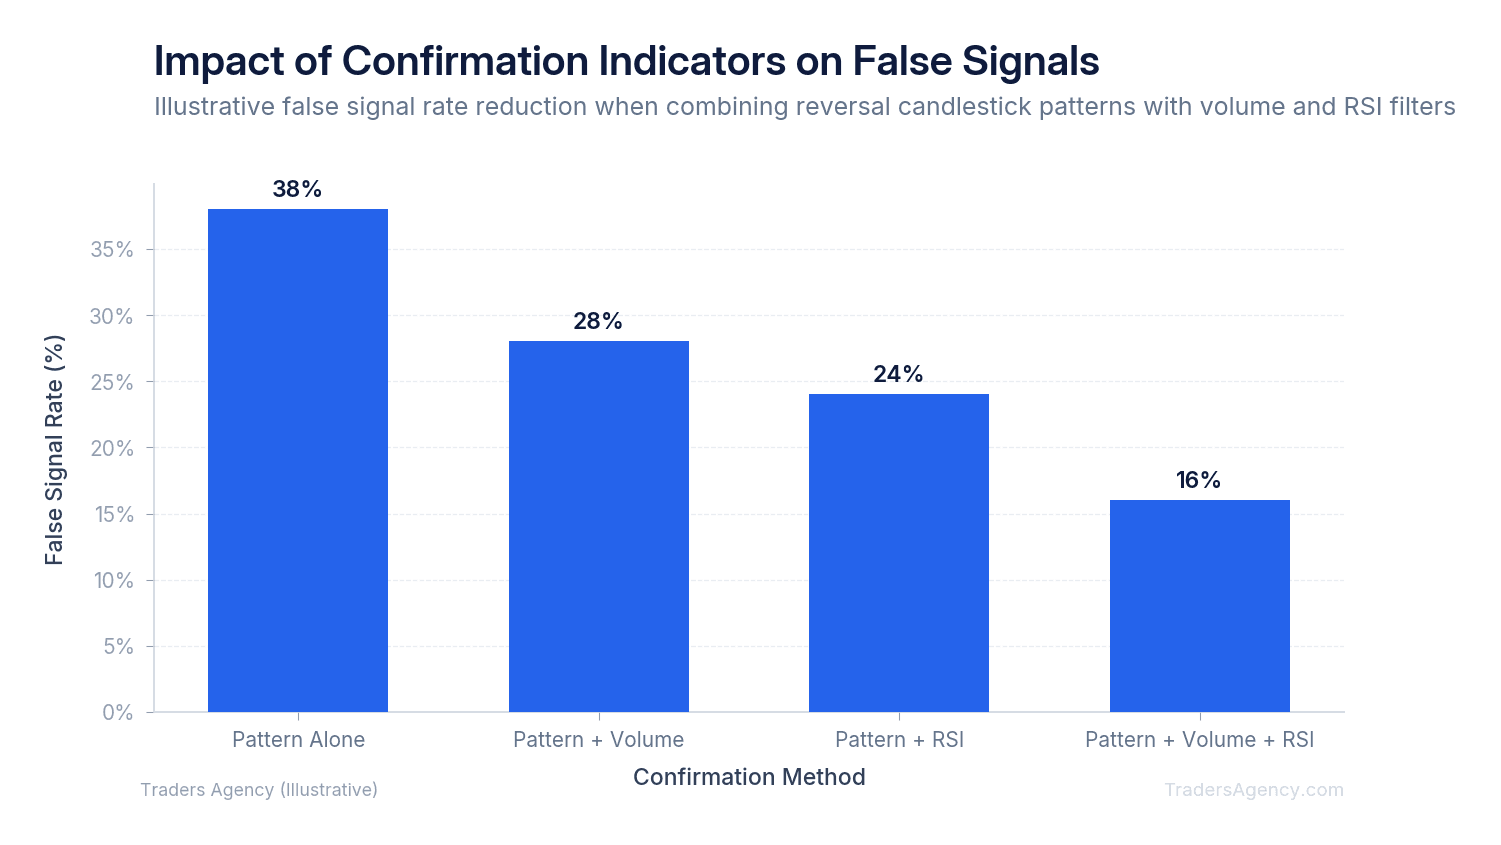
You confirm a candlestick reversal signal by waiting for the next candle to close in the new trend's direction and checking trading volume. A valid reversal should always occur on higher-than-average volume. We also use momentum oscillators like the Relative Strength Index (RSI) to verify overbought or oversold conditions.
Never trade a pattern in isolation. This is one of the most common mistakes we see intermediate traders make. A hammer pattern on low volume is often a trap set by larger market participants.
Watch Out: A single candlestick pattern without confirmation is just a shape on a chart. Always wait for at least one of the three confirmation signals below before committing capital.
1. Volume Confirmation
Volume is the fuel of the market. If a bullish engulfing pattern forms, we want to see the volume on the green candle exceed the 20-day average. High volume proves that institutional money is backing the reversal. Low volume means the move is likely retail-driven and prone to failure.
2. Secondary Indicators
We always pair reversal candlestick patterns with the Relative Strength Index (RSI). If you spot a morning star pattern, check if the RSI is crossing back above the 30 level. If you see a shooting star, verify that the RSI is dropping from above the 70 level.
3. Support and Resistance
Patterns are only valid at key structural levels. A shooting star in the middle of a random trading range means nothing. A shooting star at a 52-week high is a major warning sign that resistance is holding.
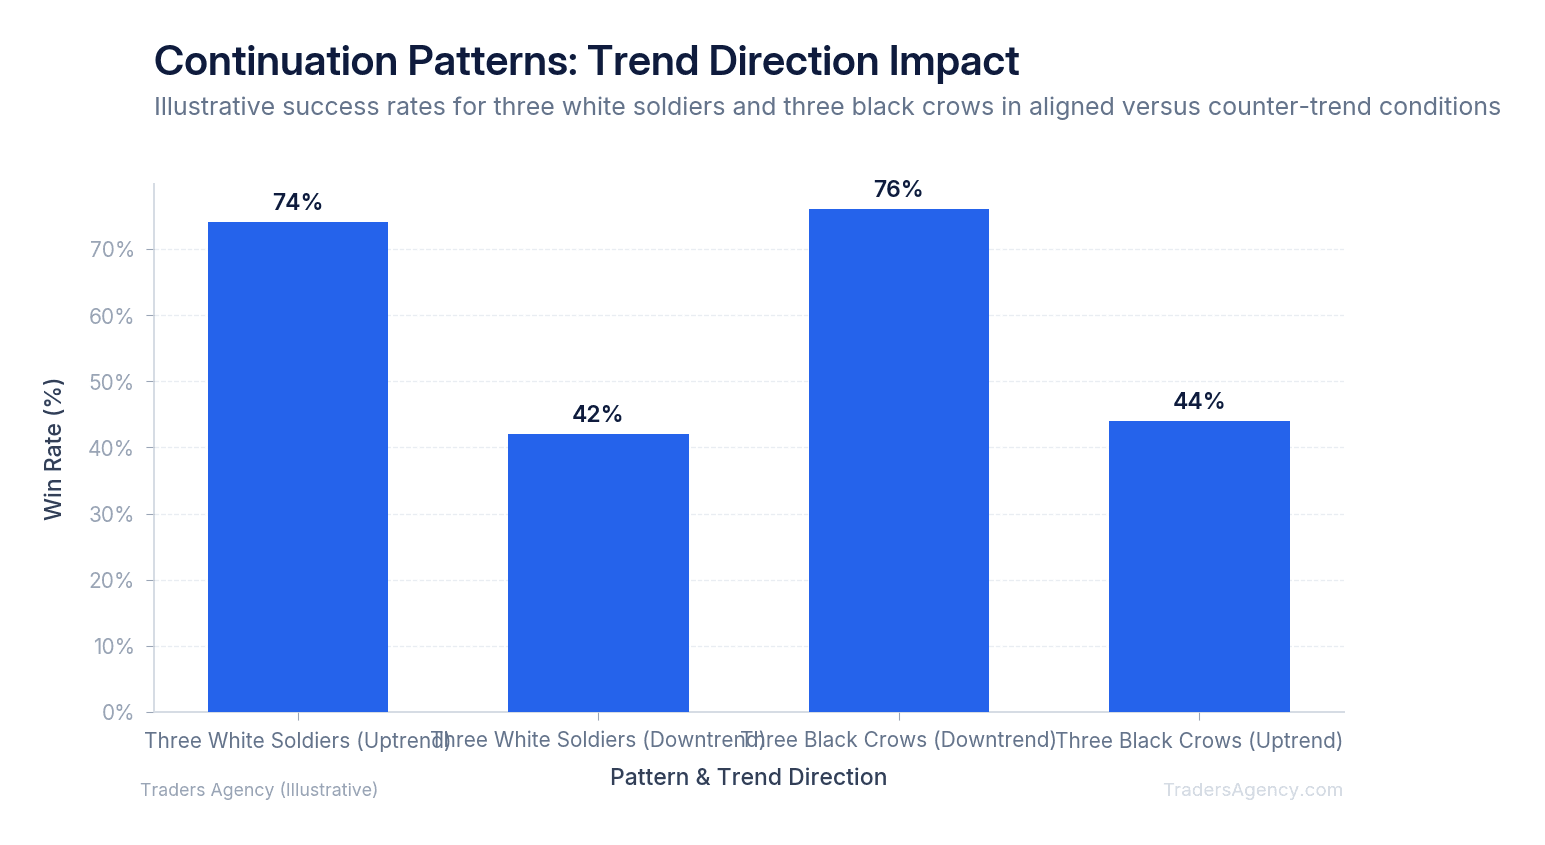
Continuation Patterns: Three White Soldiers and Three Black Crows
While reversals get all the attention, continuation patterns are where trend traders make their money. Here are the final two patterns to complete our top 15 list. These formations tell you when it's safe to add to a winning position.
14. Three White Soldiers: This pattern consists of three consecutive large green candles. Each candle opens within the previous body and closes near its high. It shows relentless buying pressure. Traditionally classified as a bullish reversal pattern when it appears after a downtrend, it also serves as a strong continuation signal when it forms during an established uptrend.
15. Three Black Crows: The bearish equivalent features three consecutive large red candles stepping downward. Each candle closes near its low, indicating that sellers are aggressively hitting the bid. Like Three White Soldiers, this pattern is classically a bearish reversal signal but can confirm continuation in an existing downtrend.
These patterns show sustained momentum. When you see three white soldiers breaking out of a consolidation zone, the trend is highly likely to continue. We teach our members to use these patterns as signals to trail their stop losses higher and lock in profits.
Step-by-Step Trade Example: Trading the Bearish Engulfing Pattern
Here's a concrete example using the bearish engulfing pattern on a daily chart. We'll walk through the exact setup, execution, and outcome parameters.
- Step 1: Identify the Setup. Assume Apple (AAPL) has been in a strong uptrend for two months. The stock hits a major resistance level at $195.00. The RSI is reading 78, indicating heavily overbought conditions. The trend is stretched and vulnerable to a pullback.
- Step 2: Spot the Pattern. On Tuesday, AAPL prints a small green candle. On Wednesday, the stock opens slightly higher but immediately faces heavy selling. It closes at $190.00, forming a massive red candle that completely engulfs Tuesday's green body. Volume on Wednesday is 40% higher than the 20-day average.
- Step 3: Execute the Trade. We do not short the stock on Wednesday. We wait for Thursday's open to confirm the downward momentum. Thursday opens at $189.50. We enter a short position or buy put options. If trading options, we might buy the $190 strike put expiring in 30 days at a premium of $3.50 per contract. Total cost: $350 per contract (each contract represents 100 shares).
- Step 4: Manage the Risk. Our stop loss goes just above the high of the bearish engulfing candle at $196.00. For the options trade, our maximum loss is capped at the $350 premium paid. Our breakeven price on the option is $186.50 (the $190 strike minus the $3.50 premium). If the stock drops to our target of $180.00, the put option increases in value significantly. If the pattern fails and the stock breaks above $196.00, we exit immediately to protect capital.
| Parameter | Value |
|---|---|
| Stock | AAPL at $189.50 (entry) |
| Pattern | Bearish Engulfing at $195 resistance |
| Option | $190 put, 30 DTE, $3.50 premium |
| Max Risk | $350 per contract |
| Breakeven | $186.50 |
| Profit Target | $180.00 |
| Stop Loss Trigger | Stock closes above $196.00 |
What Are the Most Common Mistakes Traders Make with Reversal Candlestick Patterns?
Even with a perfect setup, traders often sabotage their own success. Our team sees the same errors repeated constantly. Here's what you need to avoid.
- Anticipating the close. A candle is not a pattern until the timeframe officially closes. A beautiful hammer on a daily chart at 1:00 PM can turn into a terrible bearish engulfing candle by 4:00 PM. Never enter a trade based on an unfinished candle.
- Ignoring the broader market. If you spot a bullish reversal on a specific stock but the S&P 500 is crashing, your pattern will likely fail. Individual stocks rarely survive a broader market flush.
- Trading in the middle of a range. Reversal patterns only carry weight at the extremes of a chart. If a stock is chopping sideways between $50 and $60, a morning star at $55 is meaningless.
Practical Application and Risk Management
Knowing the patterns is only half the battle. You must know when to apply them and how to protect your account when they fail. No pattern works 100% of the time.
When to Use These Patterns
Use reversal candlestick patterns when the market is at extremes. Look for extended trends that are showing clear signs of exhaustion. We like to watch for price to stretch far away from the 50-day moving average before looking for a reversal back to the mean.
When to Avoid These Patterns
Avoid trading patterns right before major news events like earnings reports or Federal Reserve announcements. Macroeconomic data will destroy a technical setup instantly. If a company reports terrible earnings, a bullish engulfing pattern will not save the stock from dropping.
Position Sizing and Capital Preservation
Our team recommends risking no more than 1% to 2% of your total account equity on any single trade. If you have a $10,000 account, your maximum risk per trade should be $100 to $200.
Always calculate your position size based on the distance between your entry price and your stop loss. If your stop loss is wide, you must trade fewer shares or smaller options contracts. Candlestick patterns give you the entry signal, but strict risk management is what keeps you in the game long enough to become profitable.
Risk Warning: No candlestick pattern guarantees a profitable outcome. Patterns fail regularly, especially during high-volatility events and earnings season. Always define your maximum loss before entering any trade, and never risk more than you can afford to lose.
Our education team publishes new strategy guides and market analysis every week. If you found this guide helpful, consider joining our community for live training and real-time trade ideas.
Want expert trading insights delivered daily?
Join thousands of traders who rely on Traders Agency for market analysis and trade ideas.
Join Traders AgencyKey Takeaways
- Reversal candlestick patterns date back to Japanese rice merchants and remain a core tool in modern technical analysis, meaning they have centuries of real-world validation behind them.
- A single candlestick encodes four data points (open, high, low, close), and grouping candles together reveals the psychological tug-of-war between buyers and sellers at key price levels.
- Volume confirmation is a critical filter: a reversal pattern with above-average volume carries significantly more weight than the same pattern on thin volume.
- Patterns fail regularly, especially during earnings season and high-volatility events, which is why defining your maximum loss before entry is non-negotiable, not optional.
- The bearish engulfing pattern is used as a concrete step-by-step trade example in this guide, giving traders a repeatable framework they can apply to other reversal setups.
DISCLAIMER: Traders Agency does not offer financial advice. The information provided is for educational purposes only and should not be considered financial advice. Traders Agency is not responsible for any financial losses or consequences resulting from the use of the information provided. Trading carries inherent risks and may not be suitable for all individuals. You are advised to conduct your own research and seek personalized advice before making any investment decisions, recognizing the potential risks and rewards involved.
See more from Traders Agency on Google
Make us a preferred source and our market analysis will appear more prominently in your Google Search, Top Stories, and AI results.
Add to Preferred Sources