
You have probably seen a company report record profits, only to watch its stock price plummet the next day. This happens because Wall Street professionals look past the headline earnings to find the actual money moving through the business. Free cash flow is a financial metric that measures the real cash a company produces after accounting for every dollar spent to support operations and maintain capital assets. We will show you exactly how to calculate this metric, where to find the data, and how we apply it to real trading decisions. Our team relies on this specific number because it strips away accounting illusions. By the end of this guide, you will understand how to evaluate a company's true financial health using the exact formulas, sector benchmarks, and step-by-step examples you need to implement this strategy in your own portfolio.
What Is Free Cash Flow and Why Does It Matter?
Bottom Line: Free cash flow is the number that separates accounting appearances from financial reality, and knowing how to calculate it, benchmark it by sector, and apply it to actual trade decisions gives you a meaningful edge over investors who stop at net income. The key lesson is that strong fundamentals never eliminate risk: position sizing and stop losses remain essential even when the cash flow picture looks clean.
Free cash flow (FCF) is a financial metric that measures the actual cash a company produces after accounting for cash outflows to support operations and maintain capital assets. It matters because it reveals true profitability, unlike net income, which relies on complex accounting rules and non-cash adjustments.
Net income is an accounting creation. Companies can legally adjust depreciation schedules or recognize revenue early to make their earnings look better on paper. Cash in the bank, however, does not lie.
Think of a rental property business. Your net income might look artificially low after you deduct property depreciation for tax purposes. The actual cash sitting in your bank account after collecting rent and fixing the roof is your true free cash flow. This is the money you can actually spend, distribute to partners, or use to buy another property.
Key Concept: Free cash flow represents the real money a business generates after paying for operations and maintaining its assets. Unlike net income, it cannot be easily manipulated through accounting adjustments.
How Do You Calculate the Free Cash Flow Formula?
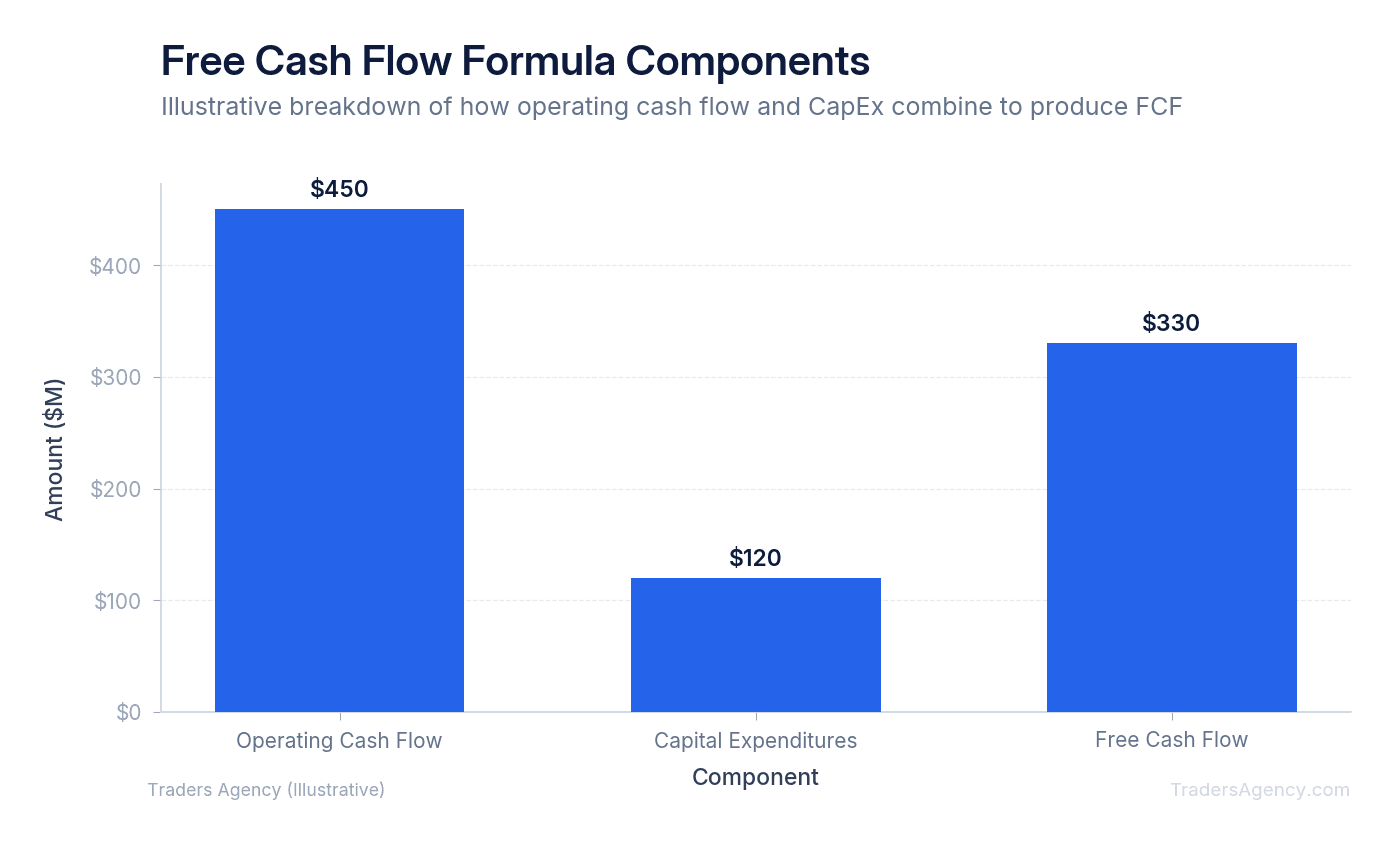
You calculate free cash flow by taking the operating cash flow and subtracting capital expenditures. Operating cash flow shows the money generated from core business activities. Capital expenditures represent the money spent on buying, maintaining, or upgrading physical assets like buildings and equipment.
The standard equation is straightforward:
Operating Cash Flow - Capital Expenditures = Free Cash Flow
We teach our members to pull these exact numbers directly from a company's Statement of Cash Flows. You can find this document in the quarterly 10-Q or annual 10-K filings available on the SEC's EDGAR database.
You will find operating cash flow at the bottom of the first section of the statement. Capital expenditures usually appear as the first line item in the "Cash Flows from Investing Activities" section. While many financial screeners calculate this for you, doing the math yourself helps you spot sudden spikes in equipment costs or delayed customer payments.
What Is a Good Free Cash Flow?
A good free cash flow depends entirely on the company's industry, growth stage, and historical averages. Generally, a good free cash flow is positive, growing consistently year over year, and generates a free cash flow yield higher than the current risk-free interest rate or industry average.
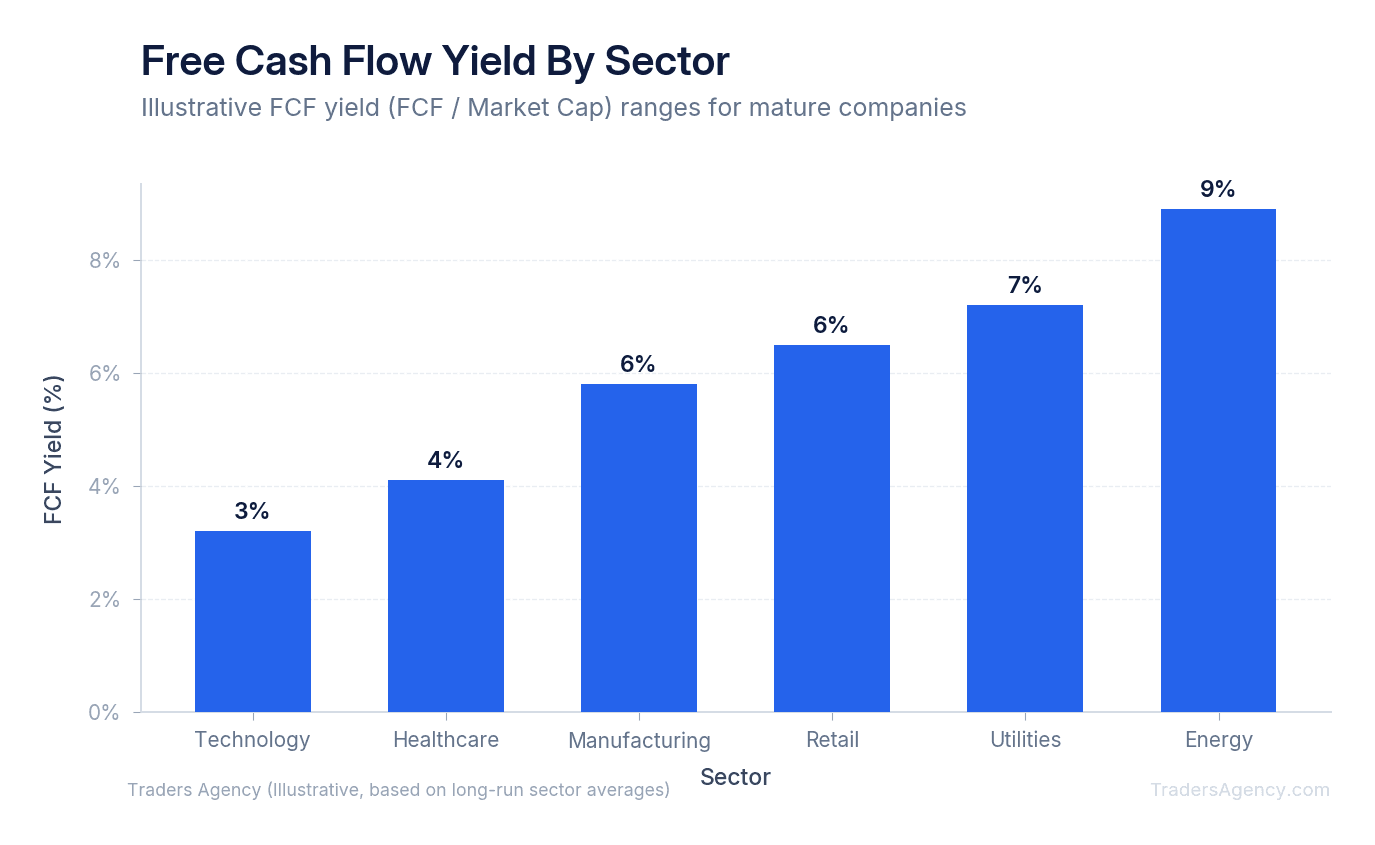
To make fair comparisons, we look at the free cash flow yield. You calculate this by dividing the total free cash flow by the company's market capitalization. A raw cash flow number of $1 billion means nothing until you compare it to the price tag of the entire business.
Different sectors have completely different baselines. Software companies often have high yields because they do not need to build expensive factories. Manufacturing and telecommunications companies typically show lower yields because they constantly spend money on heavy equipment and infrastructure.
How Does Free Cash Flow Reveal Earnings Manipulation?
Free cash flow reveals earnings manipulation by exposing the difference between reported accounting profits and actual cash generation. If a company reports soaring net income but negative free cash flow, it indicates they are not collecting cash from their sales or are overspending on capital assets to maintain operations.
We use this metric as an early warning system. When net income trends up while cash flow trends down, a major correction usually follows. This divergence happens when companies extend overly generous credit terms to customers just to book the sale before the quarter ends.
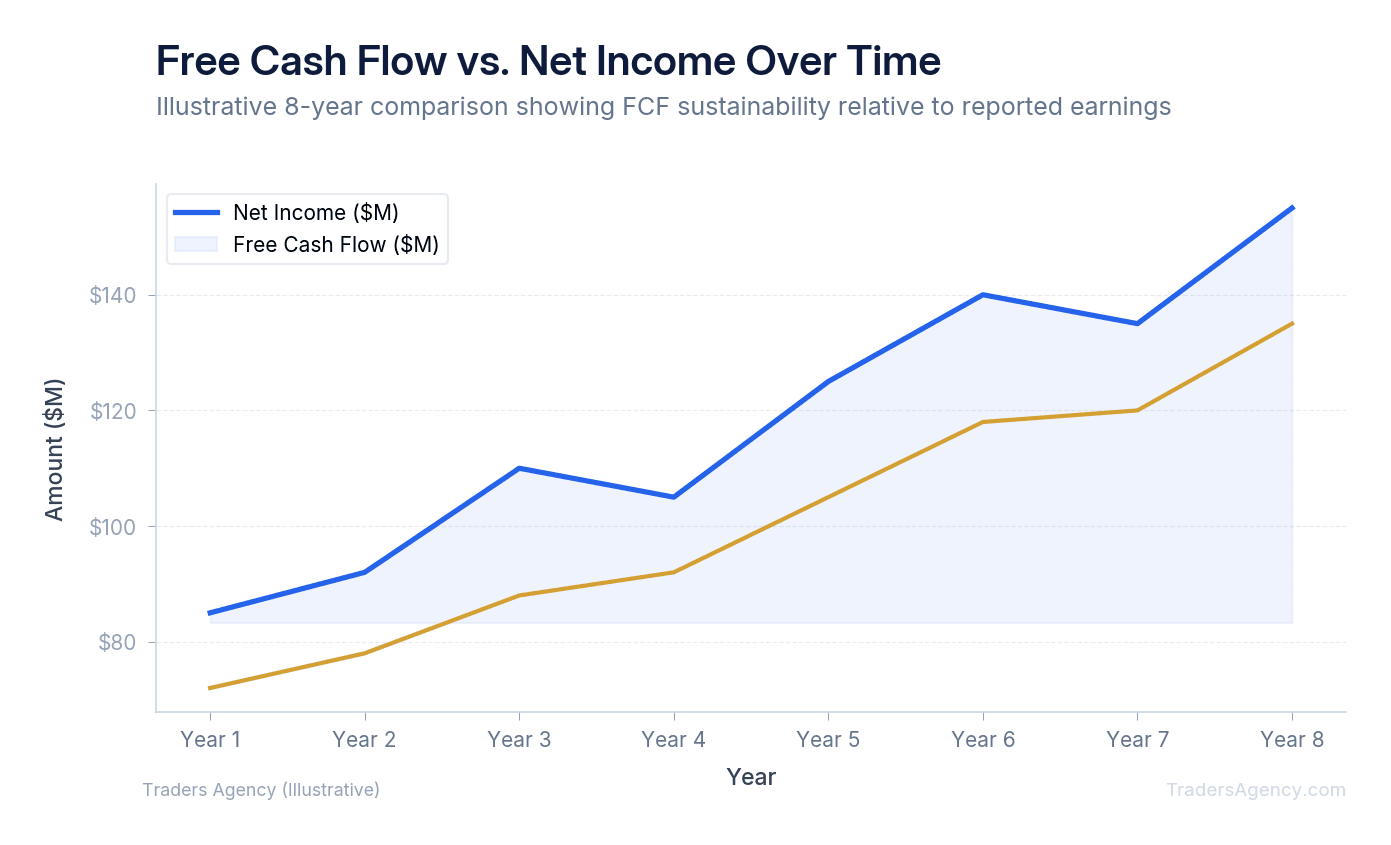
Quality cash flow is sustainable and repeatable. We want to see businesses that generate cash from selling their actual products, not from selling off their real estate or taking on new debt.
Watch Out: A company showing rising net income alongside declining free cash flow is a major red flag. This divergence often signals aggressive accounting practices, and a stock price correction frequently follows.
Want expert trading insights delivered daily?
Join thousands of traders who rely on Traders Agency for market analysis and trade ideas.
Join Traders AgencyHow Do You Analyze Free Cash Flow in a Real-World Example?
Here is a concrete example showing exactly how we evaluate a potential trade. We will compare two hypothetical companies in the same sector to see which one deserves our capital.
- Step 1: Identify the Setup. We are looking at Ticker: XYZ, a manufacturing company with a market capitalization of $10 billion. XYZ just reported a massive net income of $500 million for the year. Many amateur investors stop their research right here and buy the stock based on the strong headline earnings. Next, we look at their competitor, Ticker: ABC. ABC also has a market capitalization of $10 billion, but they only reported a net income of $300 million. On paper, XYZ looks like the clear winner.
- Step 2: Calculate Free Cash Flow. We ignore the net income and open the Statement of Cash Flows for both companies. For XYZ, we see an operating cash flow of $600 million. However, their capital expenditures for replacing old factory equipment total $550 million. That gives us: $600M - $550M = $50 million in free cash flow. For ABC, we see an operating cash flow of $400 million. Their factories are highly efficient, so their capital expenditures are only $100 million. That gives us: $400M - $100M = $300 million in free cash flow.
- Step 3: Compare Yields and Make the Decision. Now we calculate the free cash flow yield for both stocks by dividing the cash flow by the $10 billion market cap. XYZ comes in at a 0.5% yield. ABC comes in at a 3.0% yield. Despite reporting lower overall profits, ABC generates six times more actual cash than XYZ. XYZ is spending almost everything it makes just to keep the lights on. We would buy ABC and completely avoid XYZ.
| Metric | Ticker: XYZ | Ticker: ABC |
|---|---|---|
| Market Cap | $10 billion | $10 billion |
| Net Income | $500 million | $300 million |
| Operating Cash Flow | $600 million | $400 million |
| Capital Expenditures | $550 million | $100 million |
| Free Cash Flow | $50 million | $300 million |
| FCF Yield | 0.5% | 3.0% |
| Our Decision | Avoid | Buy |
How Do You Use Free Cash Flow in an Investment Decision?
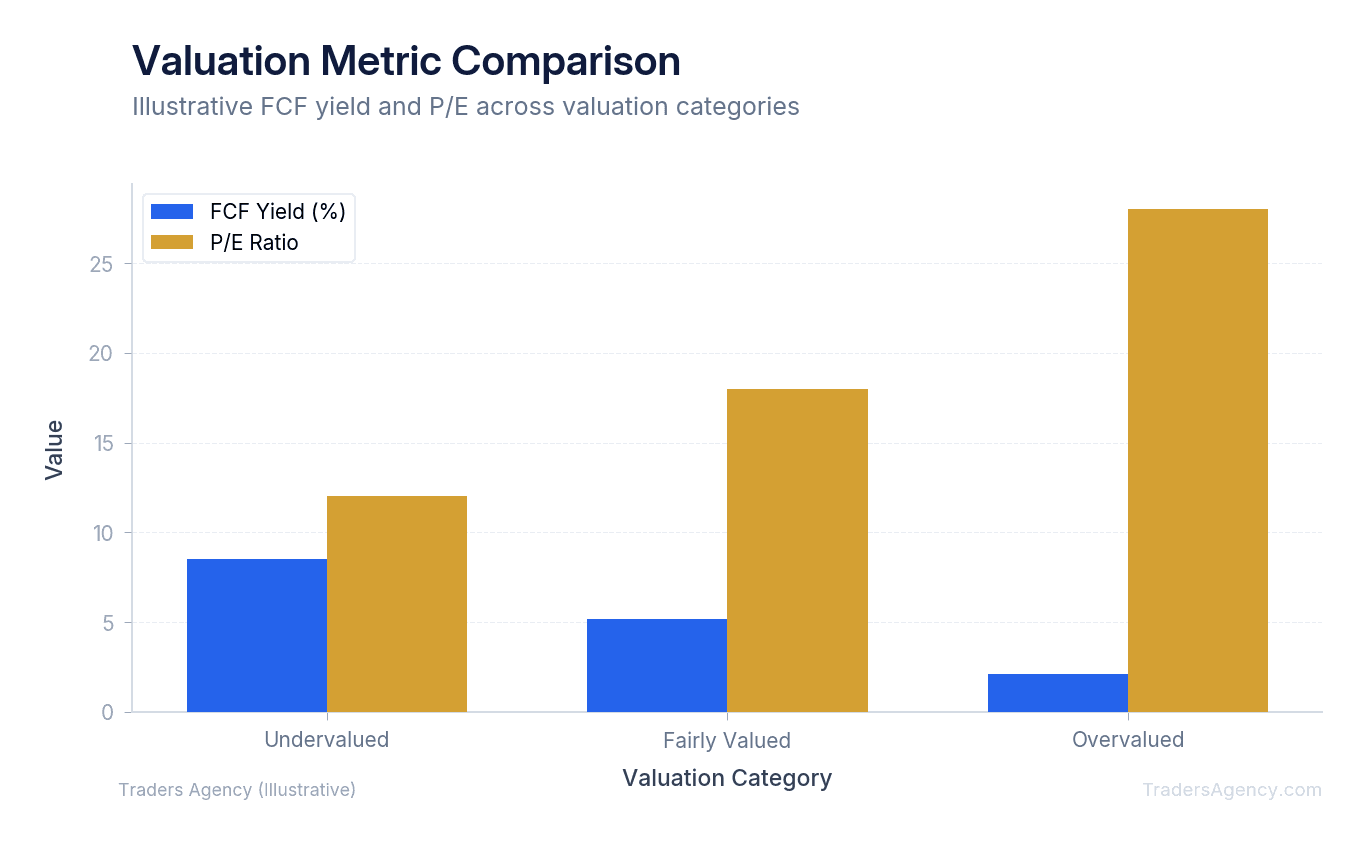
You use free cash flow in an investment decision by comparing a company's free cash flow yield to its competitors and historical averages. We buy companies generating high cash flow relative to their valuation and avoid businesses burning through cash despite reporting positive accounting earnings.
Many traders rely exclusively on the Price-to-Earnings (P/E) ratio. We prefer to pair the P/E ratio with cash flow metrics to get a complete picture. A stock with a low P/E ratio might look cheap, but if its cash flow yield is near zero, it is likely a value trap.
Here is the exact process our team uses to filter stocks:
- Screen for High Yields. We run a stock screener looking for companies with a free cash flow yield above 5%. This gives us a baseline list of businesses that are generating excess cash relative to their stock price.
- Verify Cash Flow Sustainability. We review the past five years of financial statements. We want to see cash flow growing steadily. If the yield is only high because the stock price recently crashed, we discard the ticker.
- Check Capital Allocation. We look at what management is doing with the excess cash. The best companies use it to pay consistent dividends, execute share buybacks, or pay down expensive debt. If management is hoarding cash or making terrible acquisitions, we stay away.
Key Concept: A high free cash flow yield alone is not enough. Always verify that the yield is driven by strong, repeatable cash generation and not simply a collapsing stock price. Pair FCF yield with the P/E ratio for a complete valuation picture.
When Should You Avoid Using This Strategy?
You should avoid using free cash flow analysis when evaluating early-stage growth companies, startups, or financial institutions. High-growth tech companies intentionally burn cash to capture market share, making their free cash flow negative by design. For banks, cash is inventory, so standard cash flow metrics do not apply accurately.
If you apply strict cash flow rules to biotechnology startups, you will miss every single major winner in the sector. These companies spend billions on research and development for years before seeing a single dollar of revenue. You must evaluate them based on their clinical trials and total addressable market, not their current cash generation.
Another common mistake is ignoring the debt load. A company might show a massive 10% free cash flow yield, but if they have $20 billion in high-interest debt coming due next year, that cash will disappear instantly. Always check the balance sheet alongside the cash flow statement.
Risk Warning: We enforce strict risk management rules regardless of how good the fundamental metrics look. We recommend risking no more than 1% to 2% of your total account equity on any single stock position. Even a company with perfect cash flow can suffer from sudden macroeconomic shocks or unexpected regulatory changes. Always use a stop loss to protect your capital if the market turns against your thesis.
Want expert trading insights delivered daily?
Join thousands of traders who rely on Traders Agency for market analysis and trade ideas.
Join Traders AgencyKey Takeaways
- Free cash flow strips away non-cash accounting adjustments like depreciation schedules and early revenue recognition that can make net income look better than the underlying business actually performs.
- Cash on the balance sheet can be misleading on its own: always check it alongside the cash flow statement to catch obligations like debt coming due that will drain liquidity quickly.
- Wall Street professionals prioritize free cash flow over headline earnings, which is why a company can report record profits and still see its stock price fall the next day.
- Risk management applies even when free cash flow metrics look strong: limit single stock exposure to 1% to 2% of total account equity and always use a stop loss.
- Sector benchmarks matter when evaluating free cash flow because what counts as healthy varies by industry, making cross-sector comparisons unreliable without that context.
DISCLAIMER: Traders Agency does not offer financial advice. The information provided is for educational purposes only and should not be considered financial advice. Traders Agency is not responsible for any financial losses or consequences resulting from the use of the information provided. Trading carries inherent risks and may not be suitable for all individuals. You are advised to conduct your own research and seek personalized advice before making any investment decisions, recognizing the potential risks and rewards involved.
See more from Traders Agency on Google
Make us a preferred source and our market analysis will appear more prominently in your Google Search, Top Stories, and AI results.
Add to Preferred Sources