
You've probably seen this happen before. A trader discovers a new indicator combination, tests it on a few recent charts, and assumes it will print money. They fund their account, take the live trades, and immediately blow through their capital. We see this cycle repeat constantly. The missing step? Properly backtesting trading strategies before going live. In this guide, we'll walk you through how to set up a professional backtest, avoid the traps that create fake results, and validate your system before risking a single dollar of real capital.
What Is Backtesting and Why Does It Matter?
Bottom Line: A backtest is only as reliable as the process behind it. Traders who account for realistic costs, guard against overfitting, and validate on unseen data are the ones who avoid funding a strategy that only worked on paper. The goal is not a perfect backtest equity curve but a system you can trust when live markets behave nothing like the past.
Backtesting is the process of applying a specific set of trading rules to historical market data to evaluate how that strategy would have performed in the past. It helps traders identify profitable setups, manage risk expectations, and build confidence before executing trades with real money.
Think of it like a flight simulator for pilots. You want to make your mistakes and crash in the simulator, not in a real airplane. When you test a strategy, you're looking for statistical evidence that your trading edge actually exists. Our team relies on hard data rather than gut feelings or assumptions.
Key Concept: Historical performance does not guarantee future results. However, testing historical data is the only objective way to measure the mathematical expectancy of your trading rules. A system with a negative historical expectancy will almost certainly fail in live markets.
What Are the Biases That Destroy Backtesting Results?
The most common backtesting mistakes include ignoring trading costs like slippage and commissions, optimizing parameters until the strategy only works on past data, and suffering from look-ahead bias. These errors create an illusion of profitability that vanishes the moment the strategy goes live.
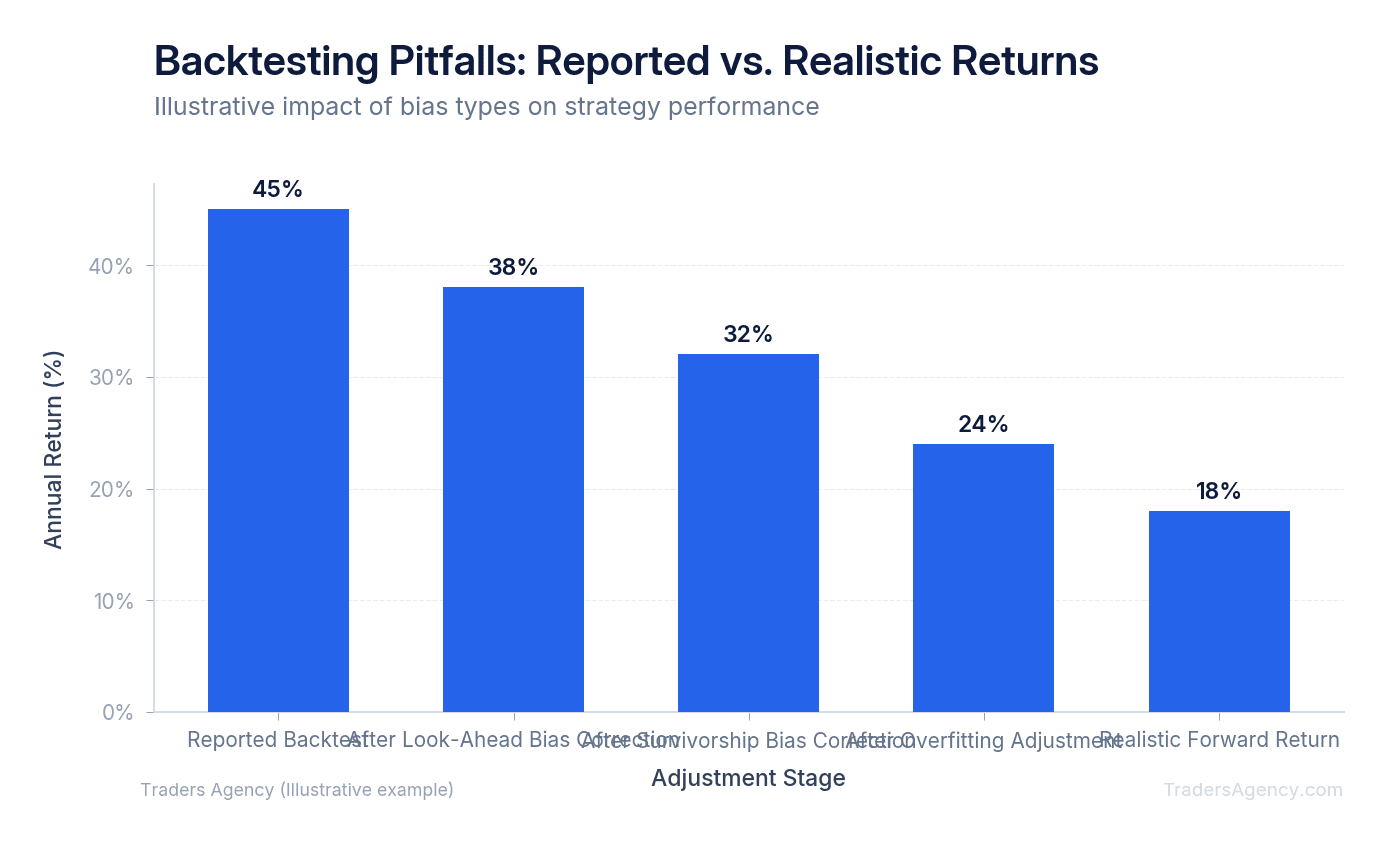
We constantly see traders bring us systems showing a 200% annual return, but the reality is much different. Those inflated numbers are usually the result of specific cognitive and systemic biases. Here are the three primary offenders:
- Look-Ahead Bias: This occurs when your test uses information that wasn't actually available at the time of the trade. For example, programming a system to buy at the daily open based on the daily closing price of that exact same day. The data "leaks" from the future into your decision.
- Survivorship Bias: This happens when you test a strategy on a current list of companies, like the modern S&P 500, while ignoring companies that went bankrupt or were delisted in the past. Your data only includes the "survivors," which artificially inflates your win rate.
- Data Snooping: This is the act of testing hundreds of different ideas on the same dataset until you find one that works purely by random chance. The more combinations you try, the more likely you are to stumble onto a false positive.
How Do You Account for Realistic Trading Costs in a Backtest?
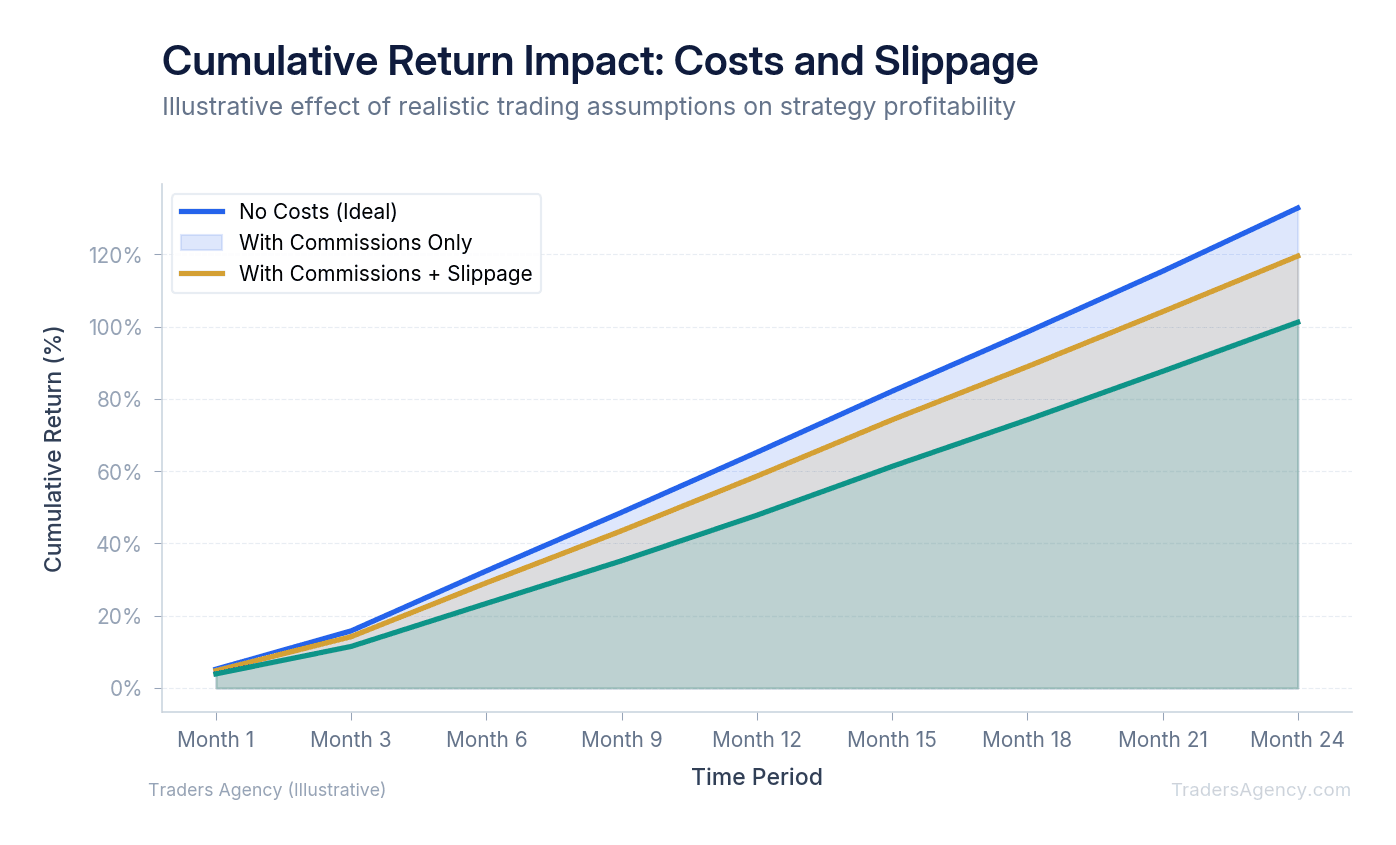
You account for realistic trading costs by manually deducting estimated slippage, exchange fees, and broker commissions from your gross backtest profits. A system that generates frequent small wins will often turn into a losing strategy once you subtract these unavoidable expenses from every executed trade.
Here's a quick example. Say you trade the SPY ETF 50 times a day for a $0.02 profit per share. Your gross profit looks fantastic on paper. But if your broker charges commissions and you lose $0.01 to slippage on both the entry and the exit, your net profit drops to zero.
| Cost Component | Per-Share Impact | Effect on 50 Daily Trades |
|---|---|---|
| Gross Profit | +$0.02 | +$1.00 per share traded |
| Entry Slippage | -$0.01 | -$0.50 per share traded |
| Exit Slippage | -$0.01 | -$0.50 per share traded |
| Net Profit | $0.00 | $0.00 |
Slippage is the difference between the expected price of a trade and the price at which the trade is actually executed. In fast-moving markets or low-liquidity stocks, slippage can be severe. Our team recommends programming a minimum of $0.01 to $0.05 of slippage per share into every simulation to ensure your strategy can survive real-world friction.
Watch Out: High-frequency strategies with small per-trade profits are the most vulnerable to cost erosion. If your average winning trade is under $0.05 per share, even minor slippage adjustments can flip your system from profitable to unprofitable. Always stress-test with higher-than-expected costs.
Top Backtesting Tools for Intermediate Traders
Choosing the right platform is essential for accurate testing. We teach our members to use tools that match their technical abilities and trading style. Here are three platforms we recommend.
1. TradingView Pine Script
TradingView is highly popular for visual traders. Their proprietary coding language, Pine Script, allows you to write custom rules and instantly see the trades plotted on your charts. It's excellent for testing technical indicator combinations on assets like AAPL or TSLA. The platform provides a built-in strategy tester that displays your net profit, total closed trades, and maximum drawdown.
2. Thinkorswim thinkOnDemand
If you trade options, Thinkorswim offers a feature called thinkOnDemand. This tool acts as a market replay function. You can pick a specific historical date, load up the options chain as it looked on that exact day, and paper trade the historical data in real time. This is highly effective for testing complex options strategies like iron condors or covered calls where historical pricing is difficult to model.
3. QuantConnect
For traders with programming experience, QuantConnect offers an institutional-grade environment. You can write algorithms in Python or C# and test them across equities, forex, and crypto. This platform automatically accounts for corporate actions like stock splits and dividends, which prevents major errors in your historical data.
| Platform | Best For | Coding Required | Asset Coverage |
|---|---|---|---|
| TradingView | Visual chart-based testing | Pine Script (beginner-friendly) | Stocks, Forex, Crypto |
| Thinkorswim | Options replay testing | None (manual replay) | Stocks, Options |
| QuantConnect | Algorithmic strategy development | Python or C# | Stocks, Forex, Crypto, Futures |
Want expert trading insights delivered daily?
Join thousands of traders who rely on Traders Agency for market analysis and trade ideas.
Join Traders AgencyHow to Run a Backtest Step by Step
You run a backtest by defining strict entry and exit rules, selecting a specific timeframe and asset, and coding these parameters into a testing platform. Once the simulation finishes, you analyze the resulting equity curve, maximum drawdown, and win rate to determine viability.
Here's exactly how we teach our members to set up a test using a platform like TradingView.
- Define the Setup and Conditions: You need a highly specific rule set. Vague rules cannot be coded. For this example, we'll test a moving average crossover on the QQQ ETF using a 15-minute chart. The entry rule is to buy exactly when the 9-period EMA crosses above the 21-period EMA.
- Establish Risk Management Parameters: Tell the system how much capital to risk. We'll allocate $10,000 per trade. We also need an exit plan: a strict 1.5% stop loss to protect capital and a 3.0% profit target to lock in gains.
- Select the Testing Window: We prefer to test across different market environments. Set the date range from January 1, 2020 to December 31, 2023. This specific window includes a major market crash, a massive bull run, and a choppy sideways market.
- Analyze the Outcome: Once the simulation runs, review the metrics carefully. The table below shows what a best-case and worst-case result might look like for this setup.
| Metric | Best-Case Scenario | Worst-Case Scenario |
|---|---|---|
| Win Rate | 60% | 38% |
| Profit Factor | 2.0 ($2 gained per $1 lost) | 0.8 (net loser) |
| Maximum Drawdown | 12% | 35% |
| Verdict | Viable for further testing | Too volatile, needs adjustment |
How Does Overfitting Ruin a Backtested Strategy?
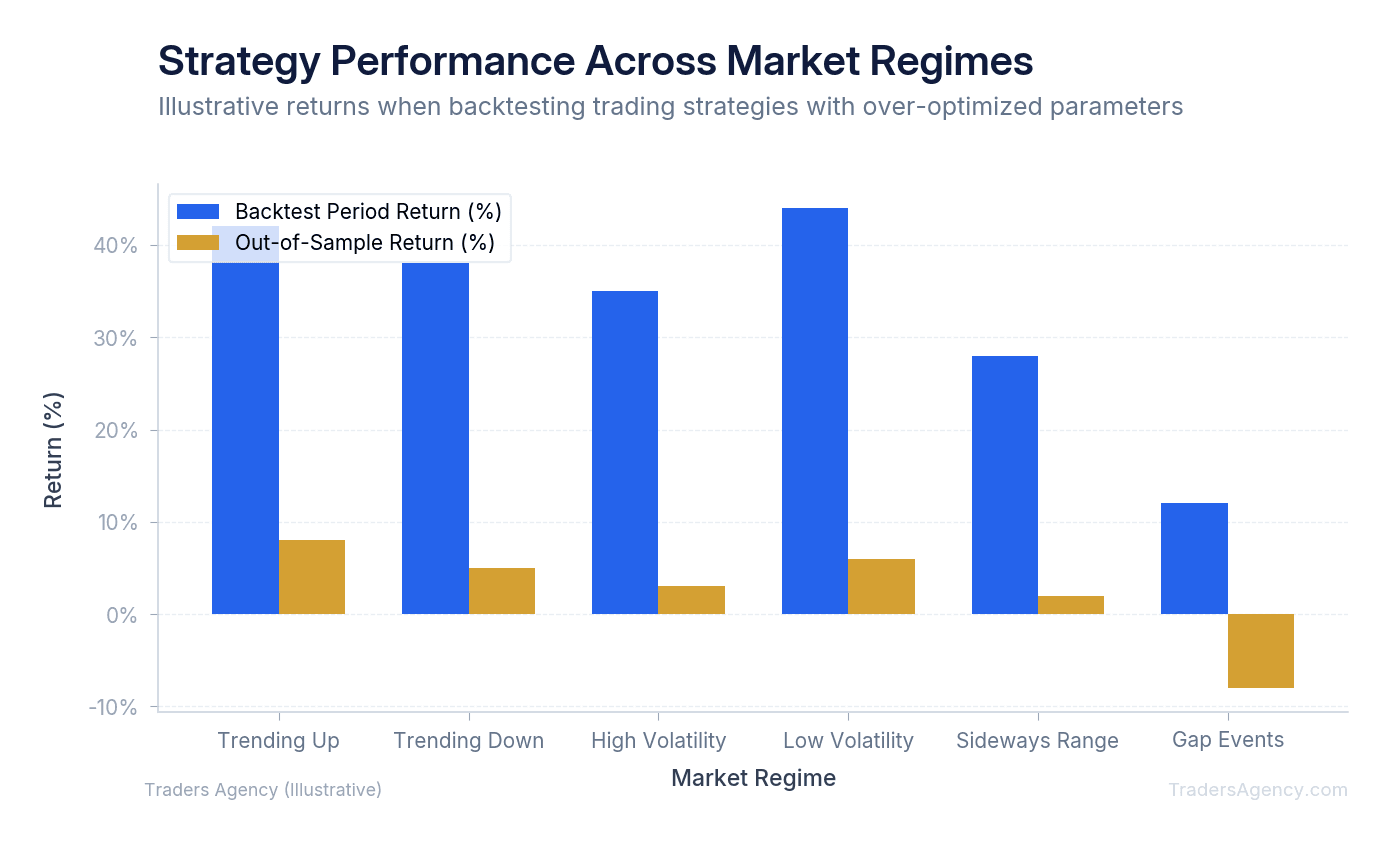
Overfitting destroys trading systems by tweaking indicator settings so perfectly to past data that the strategy loses all predictive value for the future. An overfitted model captures random market noise instead of a genuine edge, leading to catastrophic drawdowns when applied to live conditions.
Optimization is a standard part of system development, but curve-fitting is extremely dangerous. If you test a moving average crossover and instruct the computer to check every single combination from 1 to 200, it will eventually find a pair that looks perfect. That "perfect" setting only worked for that specific historical window. When market conditions change even slightly, the overfitted system will fail completely.
We prefer strategies with broad, stable parameters rather than highly specific, optimized numbers. Here's our rule of thumb: if a strategy works with a 14-period RSI, it should also work reasonably well with a 12-period or 16-period RSI. If performance collapses when you nudge a single parameter by two points, you're looking at an overfitted system.
Using Walk-Forward Analysis for Strategy Validation
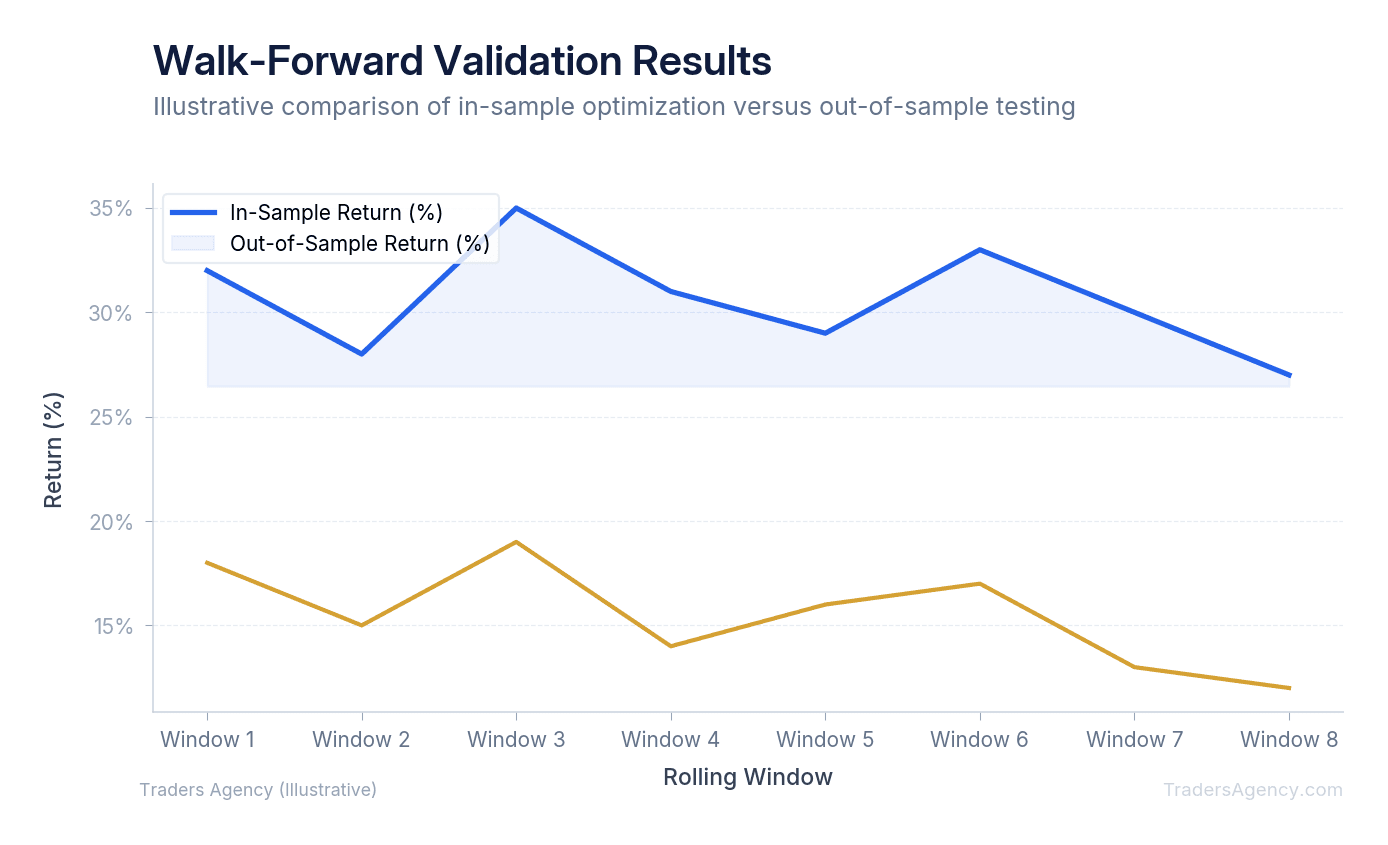
Walk-forward analysis validates a strategy by optimizing parameters on a specific historical window, then testing those exact settings on a subsequent, unseen block of data. This process repeats in rolling segments to prove the system can adapt and remain profitable in future, out-of-sample market environments.
This is how professional quantitative traders verify their ideas. Instead of testing the entire dataset at once, you break the data into chunks.
- Perform In-Sample Optimization: Test your strategy on data from 2018 to 2019 to find the best settings.
- Run the Out-of-Sample Test: Lock those settings in and apply them to data from 2020. This data was completely unseen during optimization.
- Evaluate the Results: If the strategy falls apart in 2020, you know your initial settings were overfitted. If it remains profitable, proceed to the next step.
- Roll the Window Forward: Optimize on 2019 to 2020 and test on 2021. Continue this rolling process across multiple windows to confirm your strategy can survive changing market regimes.
Key Concept: Walk-forward analysis is the gold standard for strategy validation. If your system performs well across multiple out-of-sample windows, you have much stronger evidence of a genuine edge than a single backtest can provide.
When Should You Avoid Trusting Backtested Results?
Even a well-constructed backtest has limits. Here are three situations where you should treat your historical results with extra skepticism.
- Fundamental regime changes: A strategy that worked perfectly during a zero-interest-rate environment will likely struggle when interest rates rise to 5%. The Federal Reserve's monetary policy shifts can invalidate years of historical patterns overnight.
- Low-liquidity assets: Avoid trusting tests on penny stocks or thinly traded options contracts. The historical data might show you could have bought at a specific price, but in reality, there were no actual buyers or sellers available at that level. Your simulated order would never have filled.
- Human psychology is absent: A computer has no problem executing a trade after four consecutive losses. A human trader will experience fear, hesitation, and stress. No backtest accounts for the emotional weight of watching your account draw down in real time.
Risk Warning: Regardless of how impressive your historical data looks, our team recommends risking no more than 1% to 2% of your total account equity on any single setup. Position sizing keeps you in the game when your system inevitably encounters a string of losses. Protect your capital first, always.
By understanding these tools and pitfalls, you can approach the markets with realistic expectations. Test your ideas strictly, account for your trading costs, validate your systems with unseen data, and always protect your capital first. Our team publishes new strategy guides and market analysis every week to help you stay sharp.
Want expert trading insights delivered daily?
Join thousands of traders who rely on Traders Agency for market analysis and trade ideas.
Join Traders AgencyKey Takeaways
- A system with a negative historical expectancy will almost certainly fail in live markets, making backtesting the only objective way to measure whether your trading edge actually exists.
- Three core biases consistently destroy backtest results: look-ahead bias, survivorship bias, and overfitting to historical noise rather than genuine market patterns.
- Trading costs must be factored into every backtest. Slippage, commissions, and spreads can turn a theoretically profitable system into a losing one in live conditions.
- Out-of-sample validation is essential: test your strategy on data it has never seen before publishing results, or your performance figures are statistically meaningless.
- Position sizing on any single setup should be limited to a fixed percentage of total account equity to survive inevitable losing streaks without blowing up your capital.
DISCLAIMER: Traders Agency does not offer financial advice. The information provided is for educational purposes only and should not be considered financial advice. Traders Agency is not responsible for any financial losses or consequences resulting from the use of the information provided. Trading carries inherent risks and may not be suitable for all individuals. You are advised to conduct your own research and seek personalized advice before making any investment decisions, recognizing the potential risks and rewards involved.
See more from Traders Agency on Google
Make us a preferred source and our market analysis will appear more prominently in your Google Search, Top Stories, and AI results.
Add to Preferred Sources