
A moving average crossover strategy is a technical analysis method where a trader buys or sells an asset when a short-term moving average crosses above or below a long-term moving average. You've probably seen this happen on a stock chart when two colored lines intersect right before a massive price breakout. We're going to walk you through exactly how to spot these intersections and trade them effectively.
Our team recommends this approach for beginners because it provides clear, visual signals that remove emotion from your trading decisions. New traders often struggle with knowing exactly when to enter a trade. This system gives you a definitive, mathematical trigger.
By the end of this guide, you'll know how to identify bullish and bearish crossovers, select the right timeframes, and protect yourself from false signals. We'll show you exactly what we teach our members about reading these charts.
What Is a Moving Average Crossover Strategy?
Bottom Line: Moving average crossover strategies work best as a structured entry and exit framework, not a standalone crystal ball. The Golden Cross and Death Cross give traders clear, visual signals, but their reliability depends heavily on market conditions, confirmation from other indicators, and disciplined position sizing. Master those three elements together, and crossovers become a genuinely useful tool rather than a source of costly false signals.
A moving average crossover strategy is an objective trading system that generates buy or sell signals when two different moving average lines intersect on a price chart. Traders typically use a faster, short-term average paired with a slower, long-term average to identify shifts in market momentum.
To understand this concept, you first need to know what a moving average is. A moving average (MA) simply calculates the average price of a stock over a specific number of days. For example, a 50-day moving average adds up the closing prices of the last 50 days and divides that total by 50. This creates a single point on the chart. As each new day closes, the oldest day drops off, and the line "moves" forward.
When we put two of these lines on a chart, they move at different speeds. The shorter average reacts quickly to recent price changes. The longer average moves slowly, reflecting the broader historical trend.
Key Concept: When the fast moving average crosses the slow moving average, it tells us that short-term momentum is changing direction. This is one of the most popular ways to identify new trends because it provides a systematic framework for trend identification.
What Is the Difference Between a Golden Cross and a Death Cross?
The two most famous signals in technical analysis rely on the 50-day Simple Moving Average (SMA) and the 200-day Simple Moving Average (SMA). We teach our members to watch these specific lines because major institutions monitor them closely.
A golden cross occurs when the 50-day SMA crosses above the 200-day SMA. This is a bullish signal indicating that short-term momentum is accelerating upward. When you see a golden cross, it suggests a long-term uptrend may be beginning. Buyers are stepping in aggressively enough to pull the short-term average above the yearly baseline.
A death cross happens when the 50-day SMA crosses below the 200-day SMA. This is a bearish signal warning that short-term prices are falling faster than the historical average. A death cross can precede a prolonged downtrend or bear market. It shows that sellers have taken control of the asset.
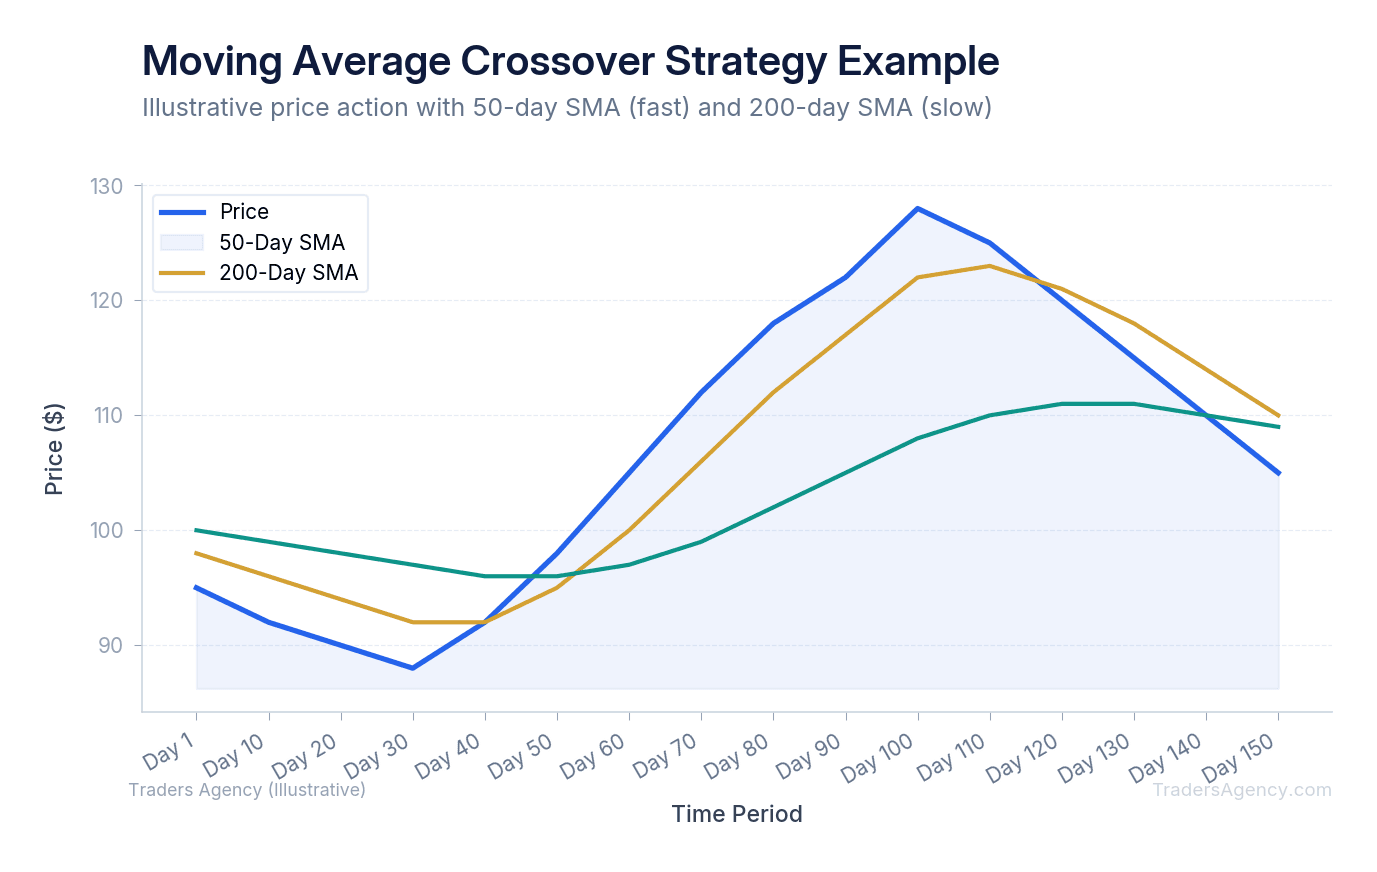
These signals work because they require sustained price movement to trigger. The 200-day moving average takes roughly 10 months of trading days to form. When the 50-day average crosses it, the market has already demonstrated significant, sustained strength or weakness. You're not guessing at a bottom. You're waiting for a mathematical signal that the trend may have changed.
| Signal | What Happens | Meaning |
|---|---|---|
| Golden Cross | 50-day SMA crosses above 200-day SMA | Bullish: uptrend likely beginning |
| Death Cross | 50-day SMA crosses below 200-day SMA | Bearish: downtrend likely beginning |
What Is the 9 and 21 EMA Crossover Strategy?
The 9 and 21 EMA crossover strategy is a short-term trading system that uses the 9-period Exponential Moving Average and the 21-period Exponential Moving Average. Traders buy when the 9 EMA crosses above the 21 EMA and sell when it crosses below, capturing rapid momentum shifts.
While the standard SMA treats every day equally, an Exponential Moving Average (EMA) gives more weight to recent prices. This makes the EMA react much faster to sudden market movements. A large price spike today will pull an EMA up much faster than it would pull up an SMA.
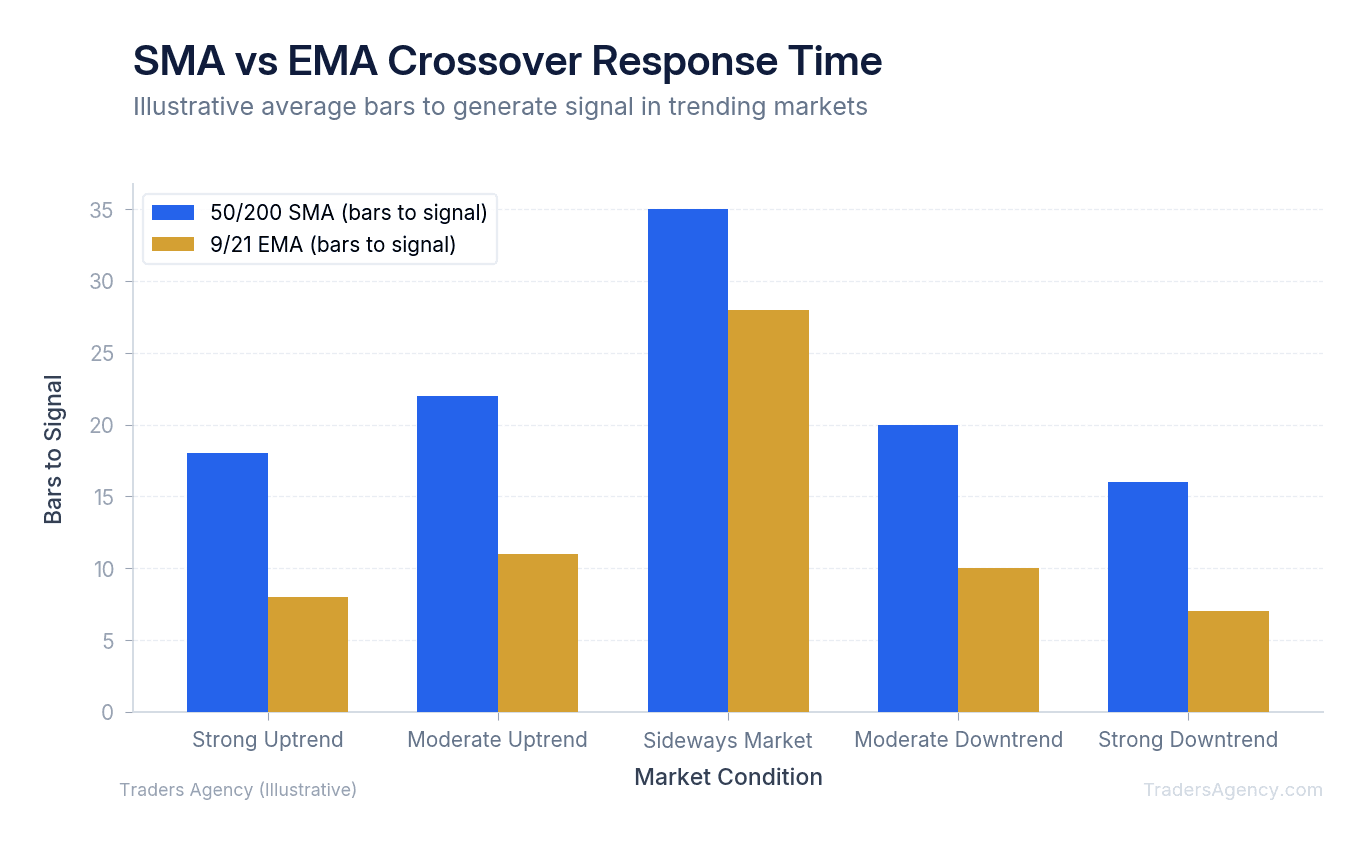
We prefer to use the 9 EMA and 21 EMA for swing trading over a few days or weeks. Because these averages track just 9 and 21 periods, they generate signals days or even weeks before a 50/200 SMA crossover would occur.
This speed allows traders to enter positions closer to the actual bottom of a pullback. However, this speed comes with a tradeoff. Because the lines react so quickly, they are more prone to generating false signals during choppy markets.
Watch Out: Faster EMA crossovers like the 9/21 setup will whipsaw more frequently in range-bound markets. Always confirm the broader trend before trusting a short-term EMA signal.
How to Use a Moving Average Crossover Strategy: Step-by-Step
To use a moving average crossover strategy, you need to apply a fast and slow moving average to your chart, wait for the fast line to cross the slow line, confirm the signal with trading volume, and enter your position with a strict stop loss.
Here is exactly how we teach our members to execute a standard crossover trade using specific numbers. We'll look at a hypothetical setup on Apple (AAPL).
- Identify the Setup Conditions: Set your chart to a daily timeframe. Apply the 50-day SMA and the 200-day SMA to your screen. You want to see the stock price trading near the moving averages, not extended far above or below them. For this example, AAPL is trading at $150, and the 50-day SMA is curling upward toward the 200-day SMA. The gap between the two lines is shrinking daily.
- Wait for the Signal Execution: Do not anticipate the cross. You must wait for the daily candle to close with the 50-day SMA mathematically above the 200-day SMA. If the 50-day SMA hits $148.50 and the 200-day SMA is at $148.20, the golden cross is officially confirmed. You buy 100 shares of AAPL at the market open the next day at $151. We prefer using limit orders to ensure we don't overpay if the stock gaps up at the open.
- Manage the Outcome and Risk: Every trade needs a worst-case scenario plan before you click buy. We place a stop loss just below the recent swing low, typically around $142.
| Scenario | Description | Result |
|---|---|---|
| Best Case | AAPL trends higher for months. You ride the trend, moving your stop loss up as the price rises, until a death cross eventually occurs. | Significant upside |
| Worst Case | The stock reverses immediately, hitting your stop loss at $142. | -$900 loss |
| Most Likely | The stock chops around the $151 entry price for a few days before picking a definitive direction. | Small gain or small loss |
Want expert trading insights delivered daily?
Join thousands of traders who rely on Traders Agency for market analysis and trade ideas.
Join Traders AgencyWhich Timeframes Work Best for Crossover Strategies?
The best timeframes for crossover strategies are the daily and weekly charts because they filter out intraday market noise. While you can use moving averages on 5-minute or 1-hour charts, shorter timeframes produce significantly more false signals that can quickly drain a trading account.
Long-term trends are generally more reliable than short-term fluctuations. The SEC's investor education resources consistently emphasize the importance of understanding time horizons when making investment decisions. This principle applies heavily to moving averages. The longer the timeframe, the more significant the crossover signal becomes. A weekly golden cross carries much more weight than a 15-minute golden cross.
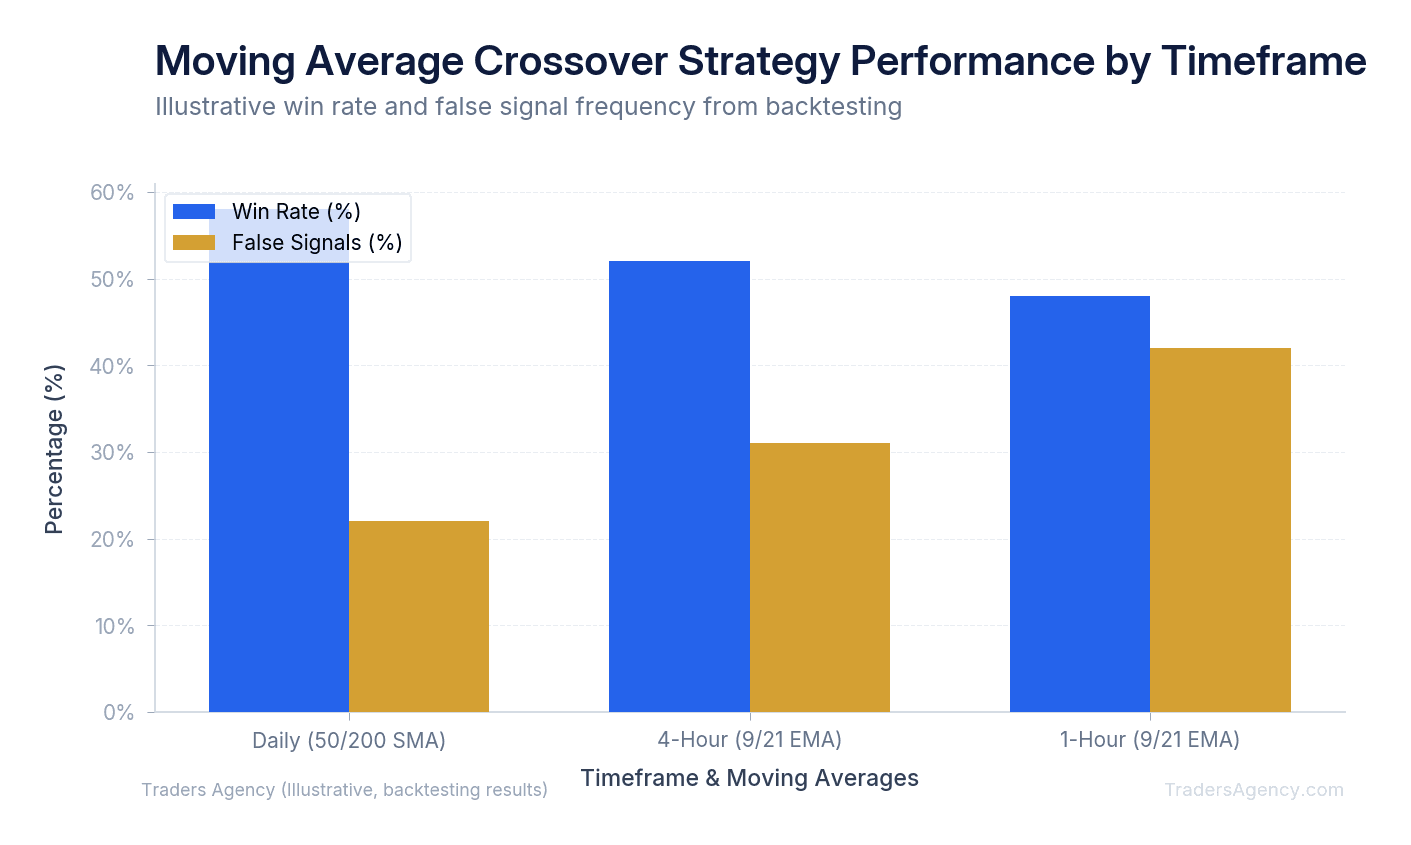
When you trade on a 5-minute chart, a single large order from an institution can cause a moving average crossover. This leads to whipsawing, where the lines cross back and forth repeatedly in a single afternoon. You end up buying high, selling low, and losing money to trading fees.
Our team recommends beginners stick to the daily chart using the 50 and 200 SMA. If you want more action, you can drop to a 4-hour chart using the 9 and 21 EMA. We strongly advise against using crossover strategies on anything less than a 1-hour chart until you've mastered risk management.
Combining Crossovers with Other Indicators for Higher Conviction
A moving average crossover strategy should rarely be used in isolation. Moving averages are lagging indicators, meaning they only tell you what has already happened. To increase your win rate, you need confirmation from other tools. We teach our traders to look for alignment across multiple indicators.
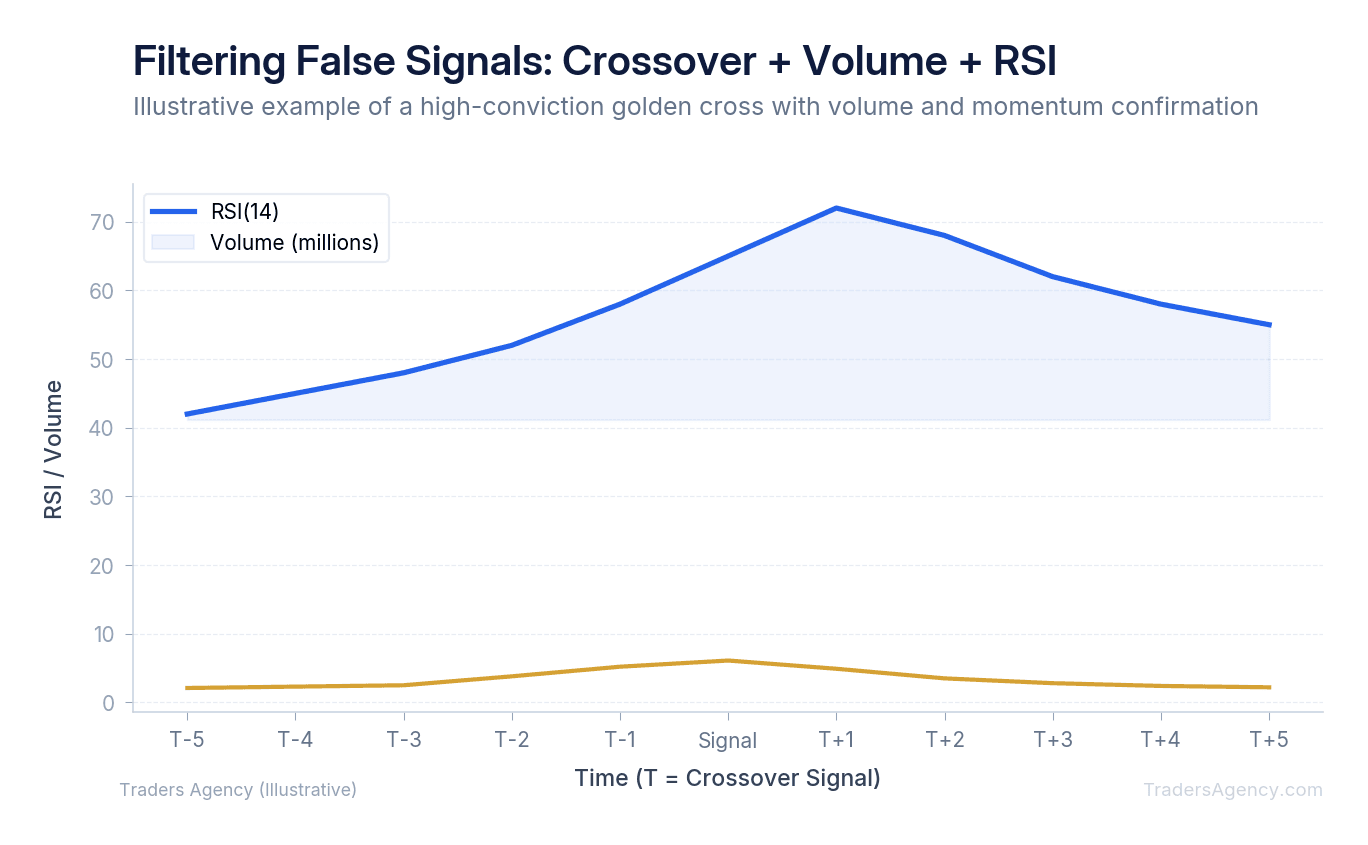
Volume Confirmation
Volume is your best friend when trading crossovers. When a golden cross happens, we want to see trading volume that is at least 20% higher than the average daily volume. High volume proves that large institutions are actually buying the stock. This gives the new trend the fuel it needs to continue. If a crossover happens on very low volume, we usually skip the trade.
RSI Confirmation
We also pair crossovers with the Relative Strength Index (RSI). The RSI measures the speed of price movements on a scale from 0 to 100.
- Look for an RSI reading between 50 and 70 during a bullish crossover. This shows healthy upward momentum.
- Avoid buying if the RSI is already above 80, as the stock may be overbought and could pull back.
- For a bearish death cross, look for an RSI dropping below 50 to confirm the downward pressure.
By waiting for volume and RSI to agree with your moving averages, you filter out the majority of false signals.
When Does a Moving Average Crossover Strategy Stop Working?
No trading system is perfect. The biggest weakness of any moving average crossover strategy is how it performs during a sideways market. When a stock is stuck in a trading range, moving averages flatten out and tangle together.
If you try to trade crossovers during a choppy market, you'll experience constant false signals. You'll buy just as the stock hits resistance and sell just as it hits support. This is why we teach our members to identify the broader market context first. Look at the chart from a distance. If the price is bouncing between two horizontal levels, do not use a crossover strategy.
You should only use crossover strategies when the market shows a clear tendency to trend. If the S&P 500 (SPY) has been trading between $500 and $510 for three months without breaking out, keep your crossover strategies on the sidelines. Wait for a clear breakout before trusting the moving averages again.
Risk Warning: Always manage your position sizing. We never risk more than 1% to 2% of our total account equity on a single crossover trade. If you have a $10,000 account, your maximum risk per trade should be strictly capped at $100 to $200. Moving averages will occasionally fail, and strict position sizing ensures those failures don't end your trading career.
Want expert trading insights delivered daily?
Join thousands of traders who rely on Traders Agency for market analysis and trade ideas.
Join Traders AgencyKey Takeaways
- A Golden Cross occurs when a short-term moving average (typically the 50-day) crosses above a long-term moving average (typically the 200-day), signaling a potential bullish trend shift.
- A Death Cross is the opposite: the short-term moving average crosses below the long-term moving average, signaling potential bearish momentum and a possible sell trigger.
- Moving average crossovers produce the most reliable signals in trending markets. In sideways or range-bound conditions, such as a stock stuck between $500 and $510 for months, crossovers generate frequent false signals and should be sidelined.
- Combining crossover signals with volume confirmation and additional indicators like RSI or MACD increases conviction and reduces the risk of acting on a false breakout.
- Risk management is non-negotiable: cap each crossover trade at 1% to 2% of total account equity. On a $10,000 account, that means a strict maximum risk of $100 to $200 per trade.
DISCLAIMER: Traders Agency does not offer financial advice. The information provided is for educational purposes only and should not be considered financial advice. Traders Agency is not responsible for any financial losses or consequences resulting from the use of the information provided. Trading carries inherent risks and may not be suitable for all individuals. You are advised to conduct your own research and seek personalized advice before making any investment decisions, recognizing the potential risks and rewards involved.
See more from Traders Agency on Google
Make us a preferred source and our market analysis will appear more prominently in your Google Search, Top Stories, and AI results.
Add to Preferred Sources