
You watch a stock bounce between two invisible lines on your screen. The price swings get smaller and smaller over time. Suddenly, the stock explodes higher or lower, leaving you wondering how you could have predicted the move. We're going to teach you exactly how to spot these formations before the big move happens. Our team relies on these specific technical setups to find high-probability trades. By the time you finish reading, you'll know how to identify triangles, wedges, and flags, calculate exact price targets, and protect your capital when a trade goes wrong.
What Are Triangle Chart Patterns and Why Do They Form?
Bottom Line: Triangle, wedge, and flag patterns work because they reveal the moment when market pressure tips decisively in one direction. Traders who combine these setups with measured move targets, defined risk levels, and confirming indicators like moving averages give themselves a repeatable, high-probability framework rather than guessing at breakouts after they happen.
Triangle chart patterns form when buyers and sellers reach a temporary equilibrium, causing a stock's price range to compress over time. This tightening action builds up market energy. When the price finally breaks out of the pattern, it typically triggers a sharp, directional move.
Think of this market mechanic like a coiled spring. As the price gets squeezed into a tighter space, pressure builds up behind the scenes. Traders are placing buy orders and sell orders closer and closer together. Eventually, one side exhausts its capital. When that happens, the winning side takes control, and the stock rapidly reprices.
Key Concept: The longer a stock consolidates within a triangle, the more explosive the eventual breakout tends to be. Consolidation patterns are primary indicators of impending market volatility, and we use them because they provide clear visual boundaries for our trades.
What Is the Difference Between Ascending, Descending, and Symmetrical Triangles?
We categorize triangles into three specific types. Each pattern tells a different story about buyer and seller behavior. You need to know exactly which one you're looking at to predict the likely breakout direction.
1. The Ascending Triangle
The ascending triangle is a bullish continuation pattern. Buyers are aggressive, but sellers are defending a specific, flat price level. You'll see a horizontal upper resistance line and a rising lower support line.
Imagine Apple (AAPL) keeps hitting $150 and pulling back. But each pullback is shallower than the last. The stock drops to $140, then rallies. It drops to $145, then rallies. It drops to $148, then rallies. Buyers are stepping in earlier every single time. Eventually, the sellers at $150 run out of shares, and the stock breaks out to the upside.
2. The Descending Triangle
This is the bearish opposite of the ascending triangle. Sellers are aggressive, pushing the price down into a flat, horizontal support level. The upper resistance line slopes downward.
For example, a stock repeatedly bounces off $50. However, the relief rallies keep getting weaker. The stock peaks at $55, then $52, then $51. The sellers are accepting lower and lower prices to exit their positions. Once the buyers at $50 are depleted, the support level breaks, and the stock drops sharply.
3. The Symmetrical Triangle
In a symmetrical triangle, both buyers and sellers are equally matched. You'll see a series of lower highs and higher lows. This creates two converging trendlines that look like a symmetrical funnel.
Because neither side has a clear advantage, a symmetrical triangle can break out in either direction. We wait patiently for the price to breach one of the trendlines before taking a position. Predicting the direction early is a common mistake that costs beginners money.
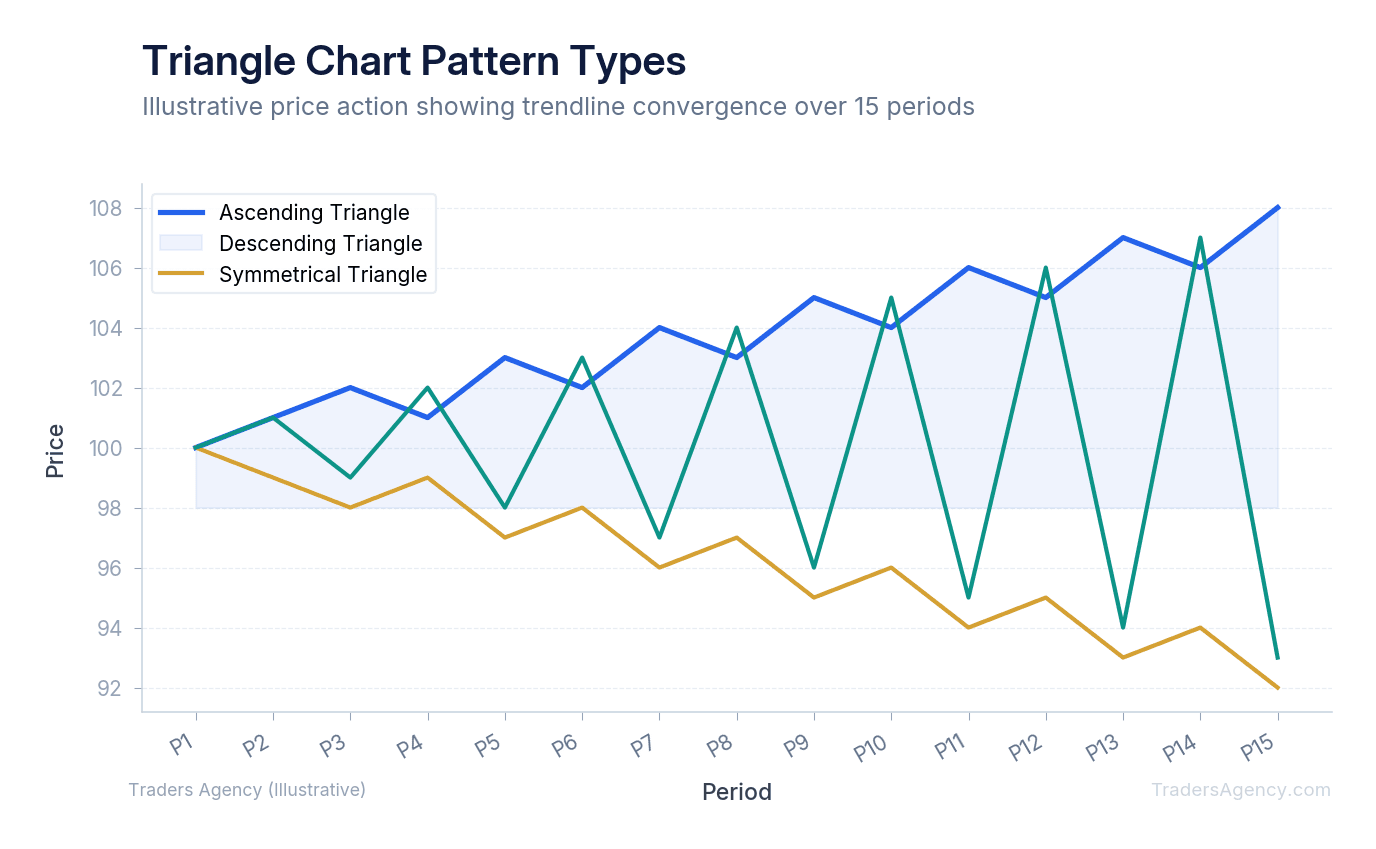
| Triangle Type | Upper Trendline | Lower Trendline | Typical Breakout Direction |
|---|---|---|---|
| Ascending | Flat (horizontal resistance) | Rising (higher lows) | Bullish (upward) |
| Descending | Falling (lower highs) | Flat (horizontal support) | Bearish (downward) |
| Symmetrical | Falling (lower highs) | Rising (higher lows) | Either direction |
How Do Wedge Patterns Signal Reversals vs. Continuations?
Wedge patterns signal reversals or continuations depending on their slope and the preceding trend. A rising wedge points upward and typically signals a bearish reversal. A falling wedge points downward and usually indicates a bullish reversal or continuation of an upward trend.
Wedges look very similar to triangles. The defining difference is that both trendlines in a wedge slope in the exact same direction. They still converge, but they tilt together either up or down.
A rising wedge occurs when a stock makes higher highs and higher lows, but the rallies are getting smaller. If a stock runs from $100 to $150 and forms a rising wedge, buyers are losing momentum. The support line is rising faster than the resistance line. This indicates exhaustion, and we expect the price to break downward.
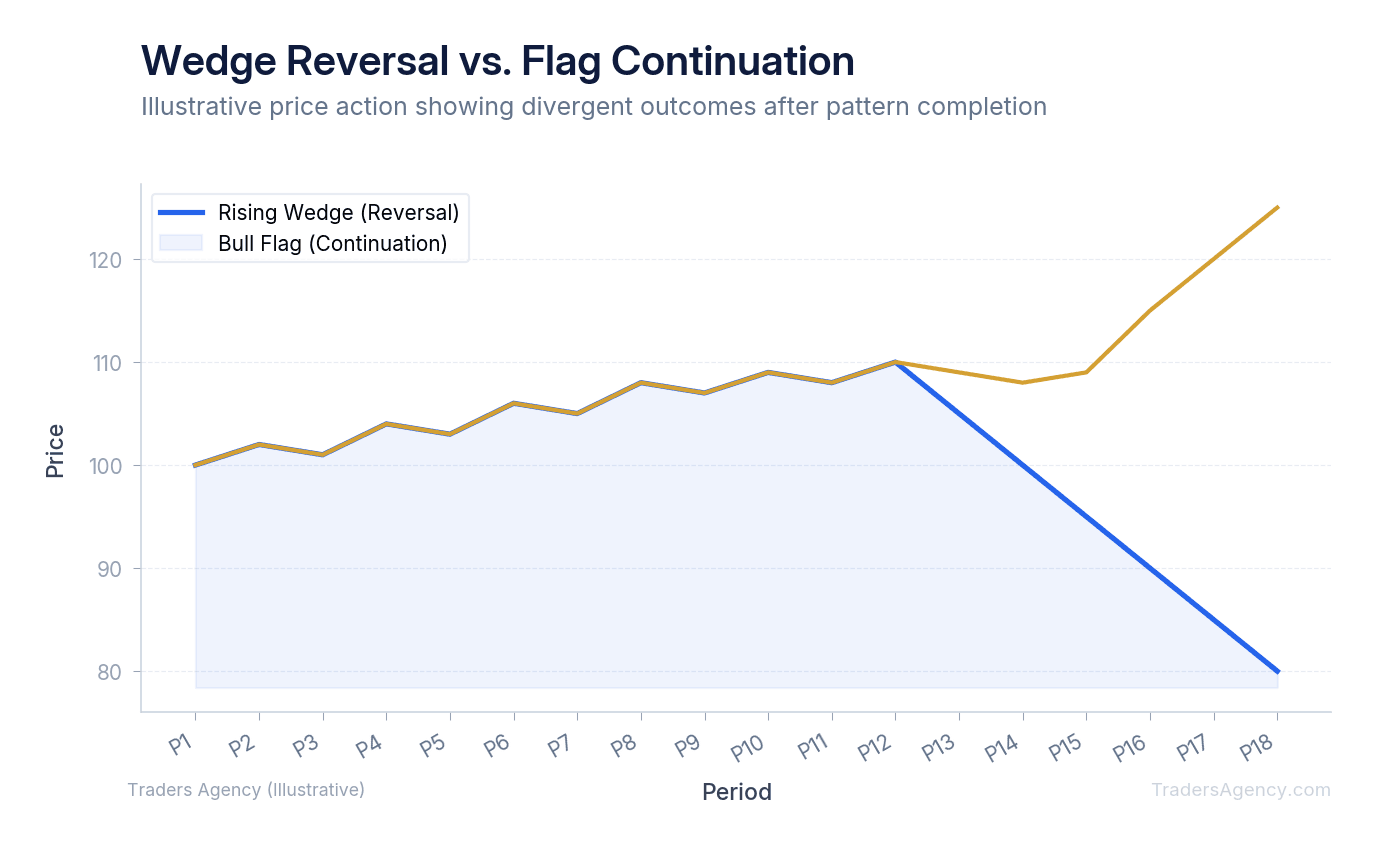
A falling wedge is the exact opposite. The stock makes lower highs and lower lows, but the downward pushes are losing strength. Our team actively looks for falling wedges during strong market uptrends. When a healthy stock pulls back in a falling wedge, it often breaks out higher to resume its primary upward trend.
Key Concept: The easiest way to tell a wedge from a triangle: in a wedge, both trendlines slope the same direction (both up or both down). In a triangle, the trendlines slope toward each other from opposite directions or one stays flat.
Bull Flags and Bear Flags: How to Spot Them on a Chart
Flags are short-term continuation patterns. They represent a brief pause or profit-taking period after a massive, rapid price move. Unlike triangles and wedges, the trendlines in a flag are parallel.
A bull flag starts with a near-vertical price spike. We call this initial spike the flagpole. The flagpole is followed by a tight, downward-sloping rectangular channel.
Here's a concrete example. Tesla (TSLA) jumps from $200 to $220 in just two days on heavy volume. That's the flagpole. Then, the stock slowly drifts down to $214 over the next four days inside a parallel channel. That drift is the flag. Once the price breaks above the upper line of the flag, the original uptrend resumes.
A bear flag works the same way in reverse. A stock drops vertically from $80 to $60. Then, it slowly bounces up to $65 in a tight, upward-sloping parallel channel. When the stock breaks below the lower line of the flag, the aggressive selling resumes. We use bear flags to find low-risk entry points for short selling.
| Parameter | Bull Flag (TSLA Example) | Bear Flag Example |
|---|---|---|
| Flagpole Move | $200 → $220 (+$20) | $80 → $60 (-$20) |
| Flag Channel | Drifts down to $214 | Drifts up to $65 |
| Channel Slope | Slightly downward | Slightly upward |
| Breakout Direction | Upward (above flag) | Downward (below flag) |
| Measured Target | $234 ($214 + $20) | $45 ($65 - $20) |
Want expert trading insights delivered daily?
Join thousands of traders who rely on Traders Agency for market analysis and trade ideas.
Join Traders AgencyHow Do You Calculate a Price Target After a Triangle Breakout?
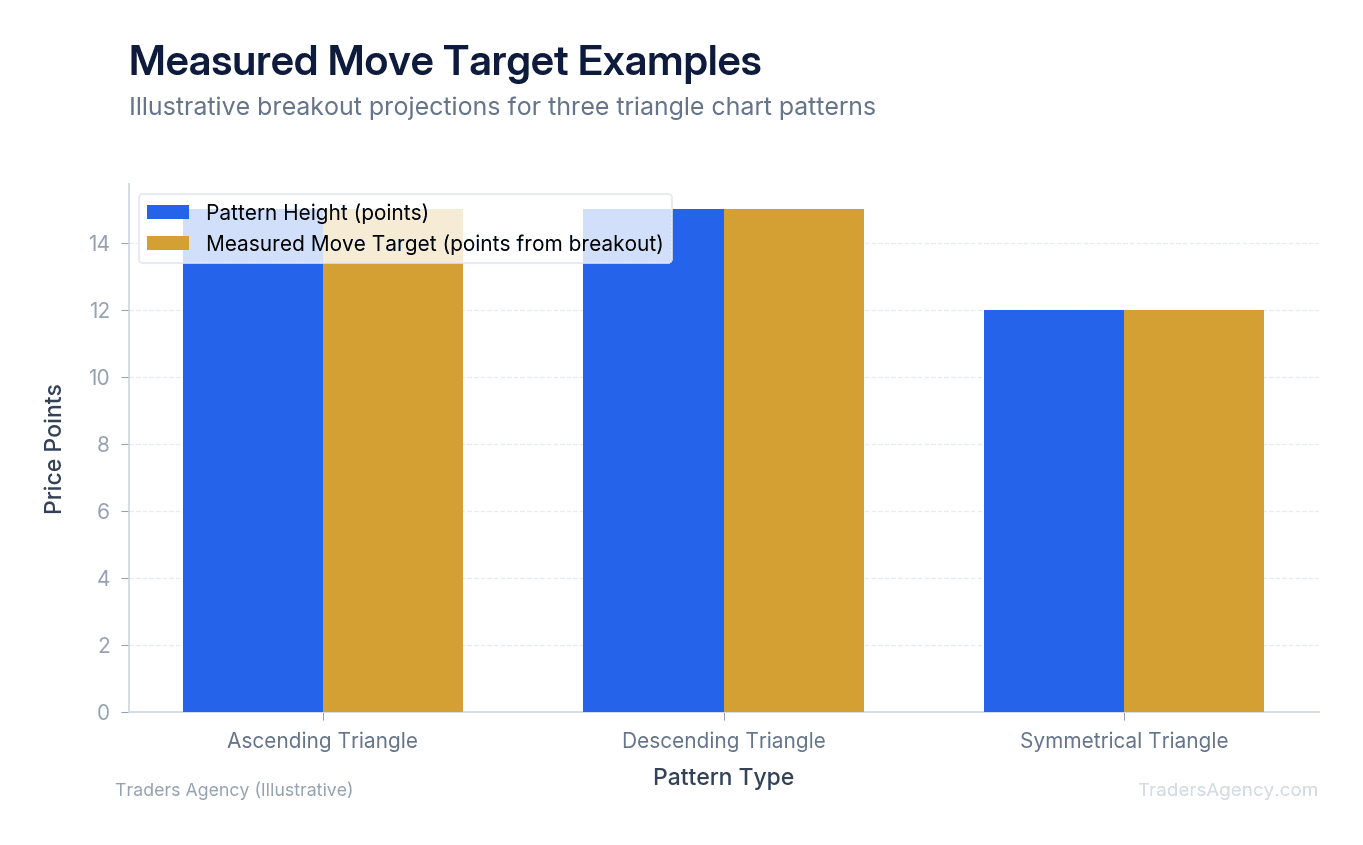
To calculate a measured move target after a breakout, measure the maximum height of the pattern at its widest point. Then, add that exact dollar amount to the breakout price for a bullish target, or subtract it for a bearish target.
We teach our members to use objective math to set their profit targets. This mechanical approach removes emotion from the trade. You never have to guess when to sell if you trust the measured move calculation.
- Step 1: Measure the Pattern Height. Find the widest part of the formation. Let's say you spot an ascending triangle on Microsoft (MSFT). The flat resistance line sits exactly at $300. The lowest point of the triangle started way back at $280. The total height of the pattern is $20.
- Step 2: Identify the Breakout Price. Wait for the stock to breach the boundary. In our example, the stock pushes past the resistance line and breaks out at exactly $300.
- Step 3: Set Your Target. Apply your measurement. Add the $20 pattern height to the $300 breakout price. Your measured move profit target is $320. If you were trading a descending triangle that broke downward at $300, you would subtract the $20 height to get a target of $280.
What Confirms a Valid Breakout From Any of These Patterns?
A valid breakout is confirmed by a significant increase in trading volume as the price crosses the pattern's boundary. High volume proves that institutional money is participating in the move. Breakouts on low volume are highly prone to failing and reversing.
Volume is the lie detector of the stock market. We never trust a quiet breakout. You can have the most perfect triangle chart pattern in the world, but without volume, the trade is a coin flip.
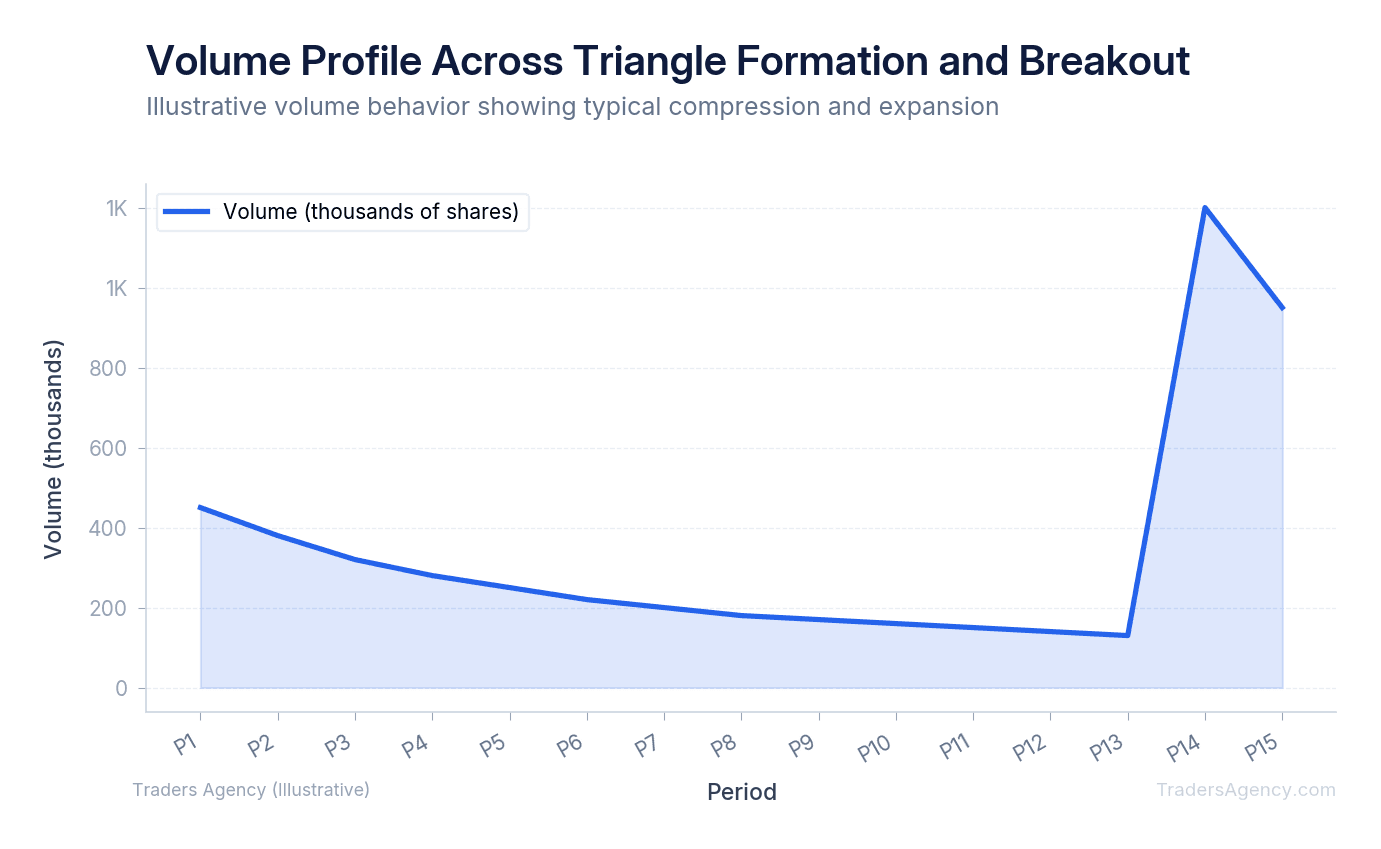
During the formation of a triangle, wedge, or flag, you should see trading volume steadily decline. The market is losing interest as the price range tightens. This drying up of volume is exactly what you want to see.
When the price finally breaches the trendline, volume should immediately spike. We look for volume to reach at least 150% of its average daily level. If a stock normally trades 1 million shares a day, we want to see a pace that will hit 1.5 million shares on the breakout day. This surge in participation tells us the new trend is real.
Watch Out: A breakout on low volume is one of the most common traps in technical trading. If you don't see that volume spike, stay on the sidelines. Many beginners get burned chasing quiet breakouts that immediately reverse.
Which Timeframes Work Best for Triangle, Wedge, and Flag Patterns?
Triangle, wedge, and flag patterns work best on daily and weekly charts for swing traders, as these timeframes filter out market noise. For intraday traders, the 5-minute and 15-minute charts provide the most reliable pattern formations with clear entry and exit signals.
The longer a pattern takes to form, the more significant the resulting move will be. A symmetrical triangle that builds over six months on a weekly chart carries much more weight than one forming over two hours. Major institutional players operate on higher timeframes.
We prefer to use a top-down approach. First, we check the daily chart to identify the primary trend and locate large patterns. Then, we drop down to a 60-minute chart or a 15-minute chart to find the exact entry point. This keeps us aligned with the big money while giving us a precise, low-risk entry.
Practical Application and Risk Management Rules
You must protect your capital when trading these setups. False breakouts happen frequently in the stock market. A false breakout occurs when the price crosses the trendline, triggers your buy order, and immediately reverses back into the pattern.
Here is exactly how we manage risk when trading a standard $10,000 account:
- Wait for the close: Do not buy the exact moment a stock crosses a trendline. Wait for the candlestick to close outside the pattern to confirm the breakout. An intraday spike that pulls back leaves a long wick and traps eager buyers.
- Set a hard stop loss: Place your stop loss just inside the pattern boundary. If you buy an ascending triangle breakout at $50, and the upper resistance line is at $49.50, place your stop loss at $48.90. If the price falls back below resistance, the pattern is broken.
- Control position size: Never risk more than 1% to 2% of your total account equity on a single pattern trade. If your stop loss is hit on a $10,000 account, you should only lose $100 to $200.
- Check the calendar: Avoid trading these patterns immediately before major earnings announcements or Federal Reserve meetings. Unpredictable news events can destroy a perfect technical setup in seconds.
Risk Warning: No chart pattern works 100% of the time. False breakouts are a normal part of trading. Always define your maximum loss before entering any trade, and never risk money you cannot afford to lose.
We also recommend combining these chart patterns with other technical tools. A bull flag breakout is much more reliable if it happens while the stock is bouncing off a 50-day moving average. By stacking the odds in your favor, you protect your downside while maximizing your profit potential.
Want expert trading insights delivered daily?
Join thousands of traders who rely on Traders Agency for market analysis and trade ideas.
Join Traders AgencyKey Takeaways
- The longer a stock consolidates within a triangle pattern, the more explosive the eventual breakout tends to be, making patience a core part of the strategy.
- Triangle patterns form because buyers and sellers compress price into a tighter range until one side runs out of capital, triggering a sharp directional move.
- A measured move target gives traders a specific price objective after a breakout, calculated by projecting the height of the pattern from the breakout point.
- Bull flag breakouts become significantly more reliable when they coincide with a bounce off a key moving average like the 50-day, stacking multiple technical confirmations.
- False breakouts are a normal and expected part of trading these patterns. Defining your maximum loss before entering any trade is non-negotiable.
DISCLAIMER: Traders Agency does not offer financial advice. The information provided is for educational purposes only and should not be considered financial advice. Traders Agency is not responsible for any financial losses or consequences resulting from the use of the information provided. Trading carries inherent risks and may not be suitable for all individuals. You are advised to conduct your own research and seek personalized advice before making any investment decisions, recognizing the potential risks and rewards involved.
See more from Traders Agency on Google
Make us a preferred source and our market analysis will appear more prominently in your Google Search, Top Stories, and AI results.
Add to Preferred Sources