
You have probably seen this happen in your own trading account. You buy a stock because the price action looks incredibly strong, but the moment you enter the trade, the stock reverses and drops. You wonder why your timing was so far off. The answer often comes down to market momentum and overextended price action, and knowing how to use RSI (the Relative Strength Index) is one of the best ways to spot these moments before they cost you money.
RSI is a momentum indicator that measures the speed and magnitude of recent price changes to evaluate whether a stock is overvalued or undervalued at any given moment. Understanding this tool can help you avoid buying at the top or selling at the bottom of a move.
Learning exactly how to use RSI is an essential skill for technical analysis. Our team teaches this concept early on because it provides immediate visual feedback about market conditions. By the end of this guide, you will know how to read the indicator, spot hidden reversal signals, and apply a specific strategy to your own trading.
What Is the RSI Indicator and How Does It Work?
Bottom Line: RSI is most valuable not as a buy or sell trigger on its own, but as a momentum filter that tells you whether price action is overextended relative to recent history. The real edge comes from reading it in context: trend direction, market conditions, and confirmation from other indicators. Master that context and RSI becomes a tool for avoiding bad entries, not just spotting them after the fact.
The RSI indicator is a technical analysis tool that oscillates on a scale from 0 to 100. It calculates the ratio of average price gains to average price losses over a specific timeframe, usually 14 periods, to show the current momentum of an asset.
When a stock closes higher than its previous close, the indicator registers a gain. When it closes lower than its previous close, it registers a loss. The formula averages these gains and losses over your chosen timeframe to create a single line that moves up and down on your chart. You will find this indicator featured prominently in the charting software of every major brokerage platform because of its reliability and ease of use.
We prefer to think of RSI as a speedometer for a stock. If the price is rising very quickly with few down days, the speedometer climbs toward 100. If the price is falling rapidly with few up days, the speedometer drops toward zero.
The indicator sits in a separate panel below your main price chart. It features a centerline at 50, which acts as a basic trend filter. When the line stays above 50, buyers generally have control. When it stays below 50, sellers are dominating the action.
Key Concept: RSI measures momentum on a scale of 0 to 100. The centerline at 50 separates bullish territory (above) from bearish territory (below). The standard calculation uses 14 periods of price data.
What Do RSI Overbought and Oversold Levels Actually Mean?
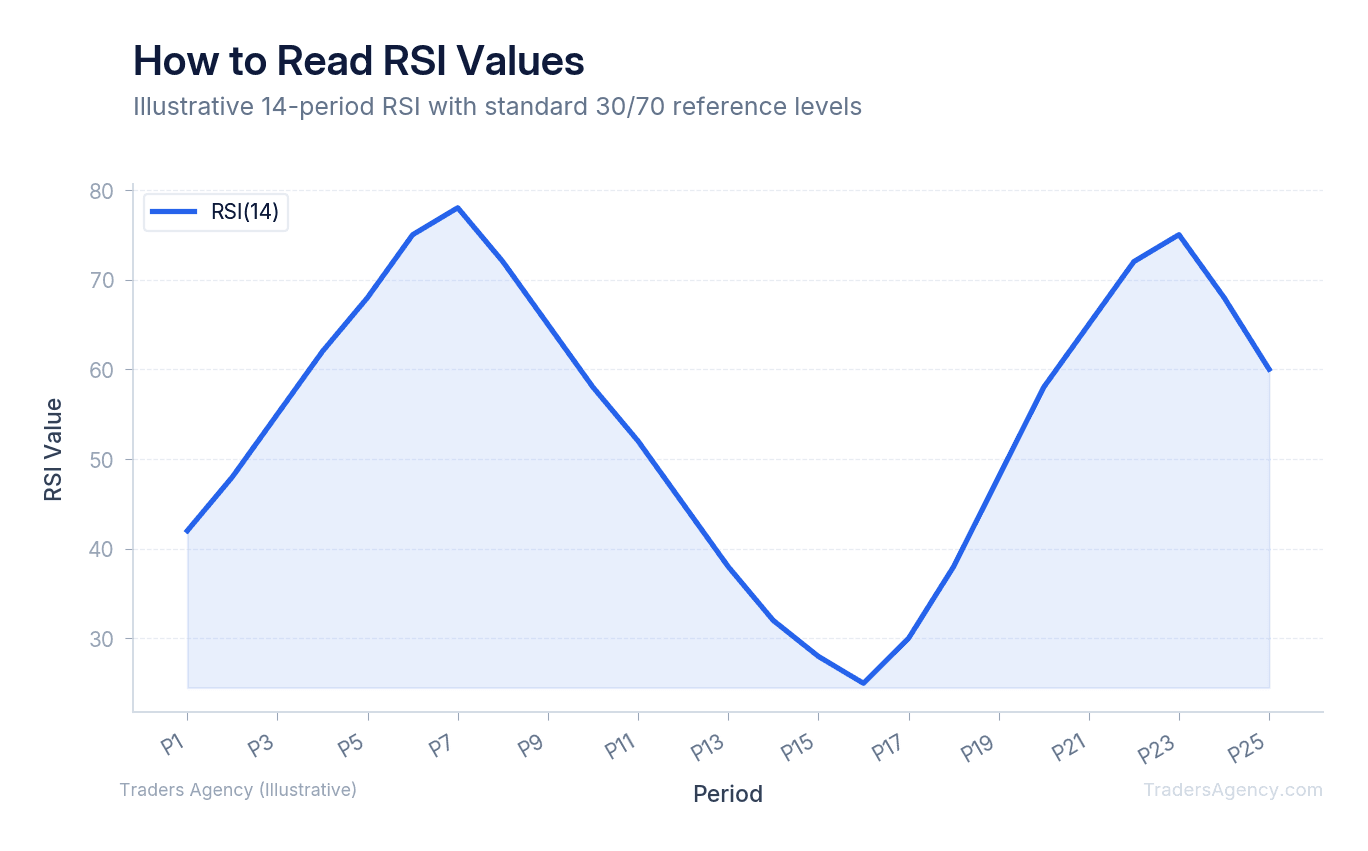
An RSI value above 70 indicates a stock is overbought, meaning it may be overvalued and due for a pullback. An RSI value below 30 indicates a stock is oversold, suggesting it may be undervalued and ready for a bounce.
These two zones are the most common signals traders look for when learning how to use RSI. You can think of these extreme levels like a stretched rubber band. The further you stretch the rubber band in one direction, the more tension builds up. Eventually, that tension forces a snap back in the opposite direction.
If Stock XYZ climbs steadily for eight days in a row, the RSI might reach a reading of 78. This tells us the buying momentum is stretched. It does not mean the stock will crash immediately, but it warns us that the risk of a sudden drop is elevated. Buying a stock with a reading of 78 is generally a poor risk-to-reward decision.
Conversely, if Stock ABC drops for several days and hits a reading of 25, the selling pressure is exhausted. The stock is heavily oversold. Value buyers and short-sellers looking to take profits will often step in at these levels, creating a price bounce.
What Does RSI Divergence Mean for Price Direction?
RSI divergence occurs when the price of a stock moves in the opposite direction of the RSI indicator. This signals that the current price trend is losing momentum and a reversal may happen soon.
Divergence is one of the most powerful concepts we teach our members. It acts as an early warning system before the actual price trend changes. There are two main types of divergence you need to know.
Bullish divergence happens during a downtrend. The stock price falls to a lower low, but the indicator forms a higher low. This means the price is still dropping, but the selling pressure is actually weakening.
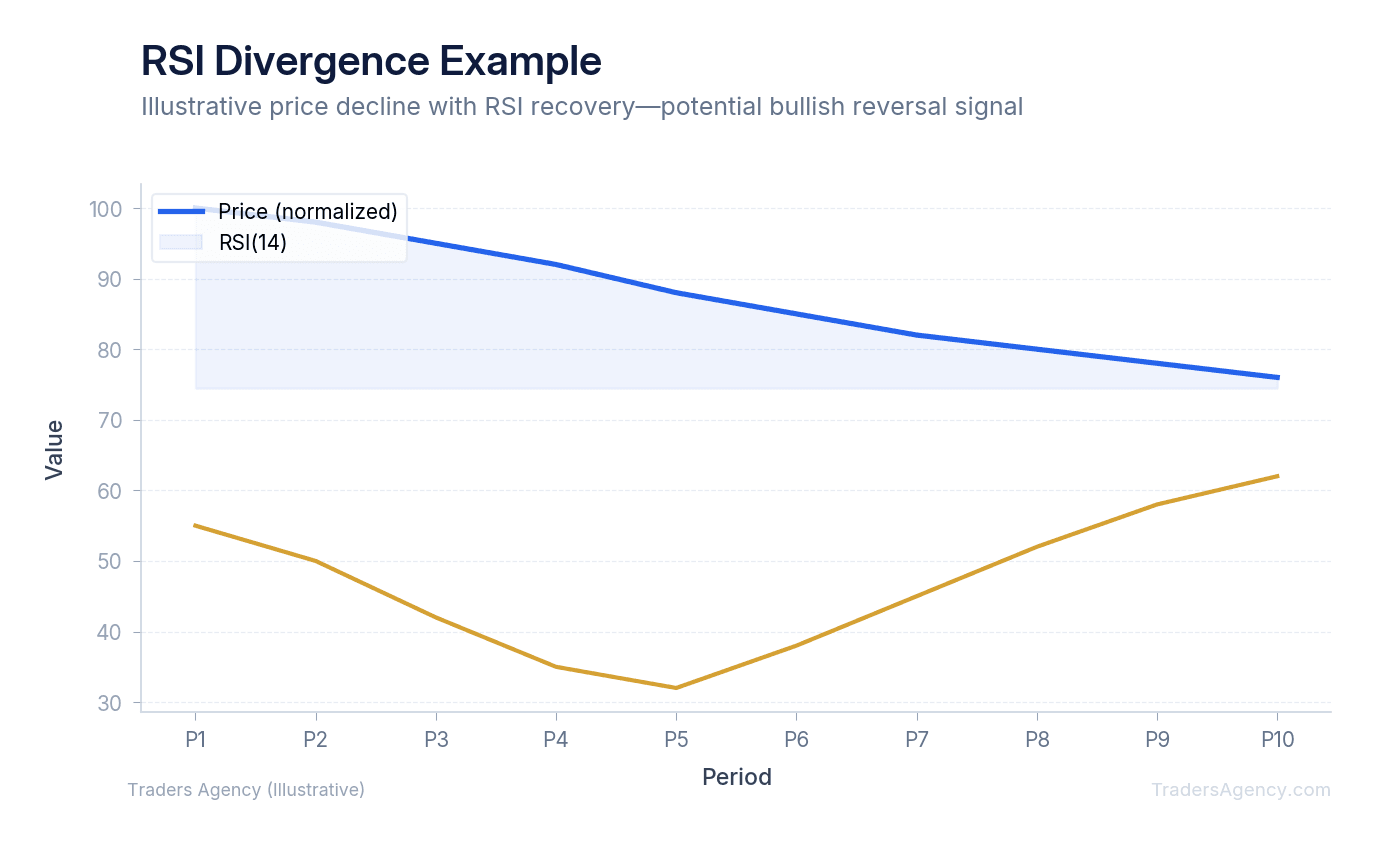
Bearish divergence happens during an uptrend. The stock price pushes up to a higher high, but the indicator forms a lower high. The stock is still climbing, but the buying momentum is fading fast. Smart traders use bearish divergence as a signal to tighten their stop losses or take profits.
Key Concept: Divergence is your early warning system. When price makes a new extreme but RSI does not confirm it, the trend is losing steam. Bullish divergence (price lower low, RSI higher low) signals a potential bounce. Bearish divergence (price higher high, RSI lower high) signals a potential drop.
Does RSI Work Differently in Trending and Ranging Markets?
In a ranging market, RSI reliably bounces between 30 and 70. In a strong trending market, RSI can stay overbought or oversold for long periods, so traders should adjust their reference levels to 40 and 80 for uptrends, or 20 and 60 for downtrends.
A common frustration for beginners is watching a stock hit 70, assuming it will drop, and then watching it climb another 20% while the indicator stays pinned at 85. This happens because strong trends completely override standard oscillator signals.
During a massive bull run, a stock might never drop to 30. Instead, every time the indicator dips to 40, buyers step in and push the price higher. In this environment, 40 becomes the new oversold level.
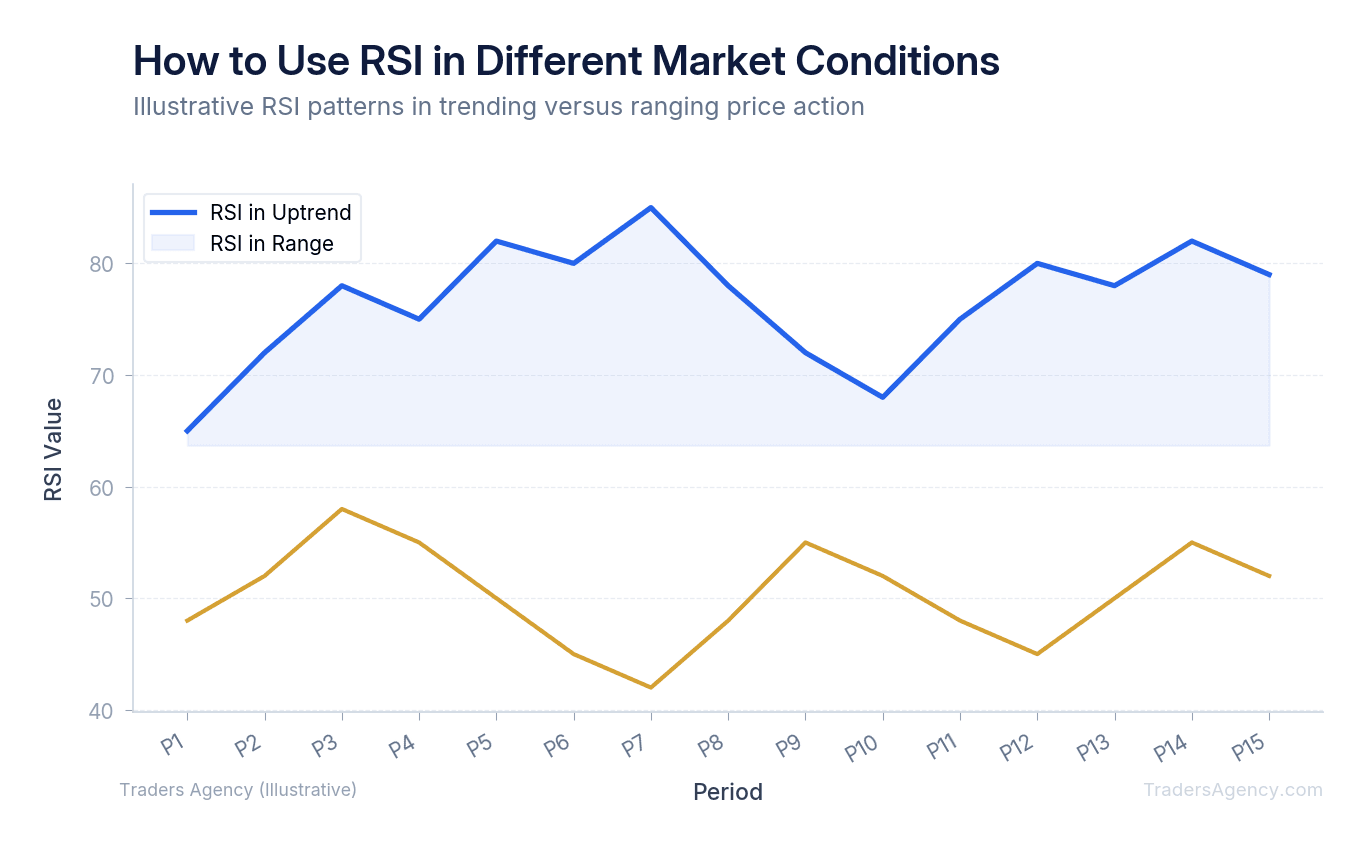
Before you take a trade based on an overbought or oversold signal, you must identify the broader market environment. If the stock is trapped in a sideways consolidation box, the standard 30 and 70 levels work beautifully. If the stock is breaking out to all-time highs, you must respect the trend and ignore standard overbought warnings.
Want expert trading insights delivered daily?
Join thousands of traders who rely on Traders Agency for market analysis and trade ideas.
Join Traders AgencyRSI Settings: Should You Change the Default 14 Periods?
The default RSI setting is 14 periods, which balances sensitivity and reliability for swing trading. Day traders often reduce this to 7 periods for faster signals, while long-term investors might increase it to 21 periods to filter out market noise.
When J. Welles Wilder introduced this indicator in 1978, he determined that 14 periods offered the best mathematical smoothing. On a daily chart, this represents about three weeks of trading data. We recommend that beginners stick with the 14-period default until they gain consistent experience. You can read more about the mathematical foundations of momentum oscillators through resources available at the CME Group's education center.
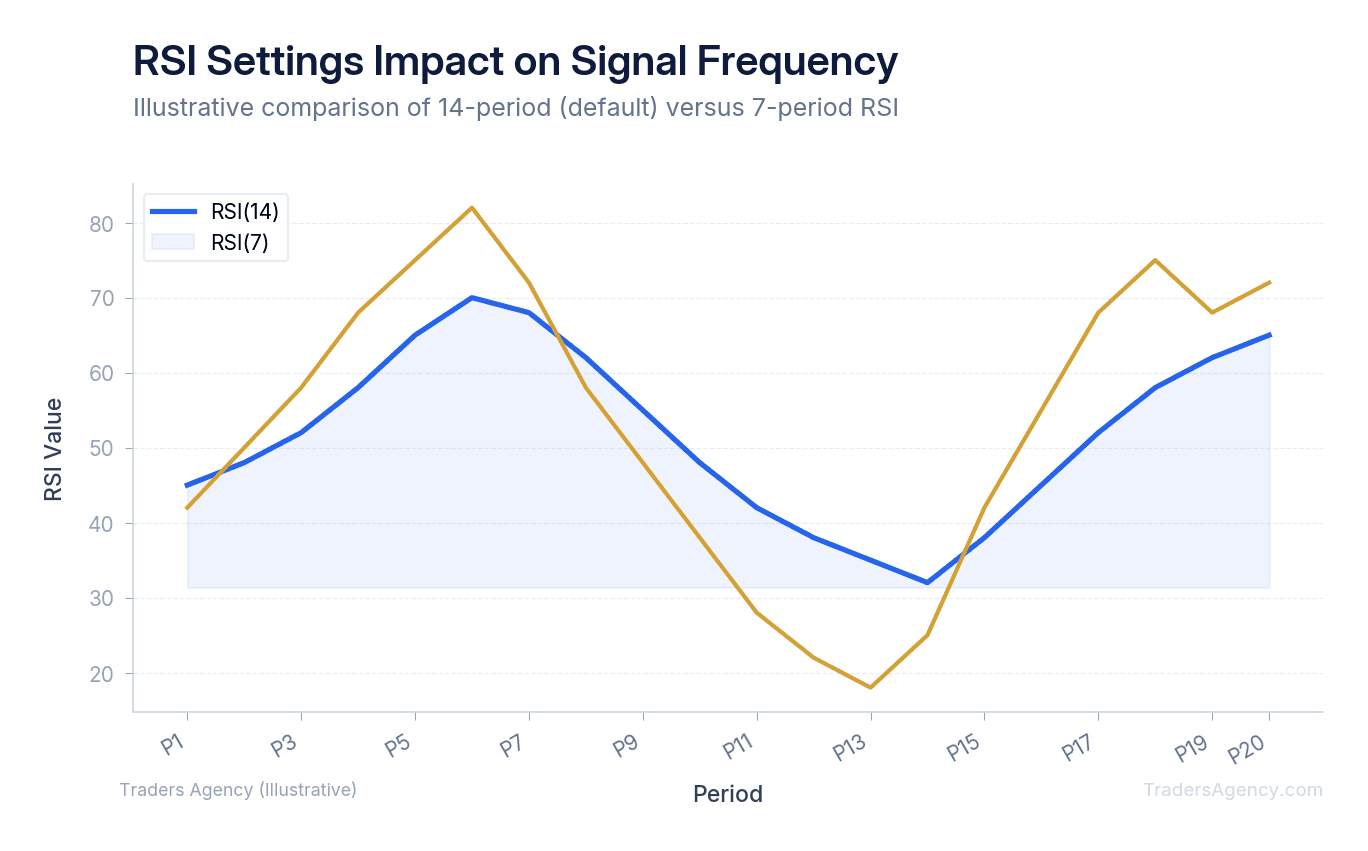
If you lower the setting to 5 or 7 periods, the line will become highly reactive. It will hit 30 and 70 very frequently. This gives you more trading signals, but it also produces many false signals.
If you raise the setting to 21 or 28 periods, the line becomes sluggish. It will rarely reach the extreme zones. This filters out the noise and provides very high-conviction signals, but you will have to wait much longer for trading opportunities to appear.
| RSI Setting | Best For | Signal Frequency | False Signal Risk |
|---|---|---|---|
| 7 periods | Day trading, scalping | High | High |
| 14 periods (default) | Swing trading | Moderate | Moderate |
| 21 periods | Position trading, investing | Low | Low |
Step-by-Step: How to Use RSI in a Trading Strategy
Now we will walk you through a practical application of these concepts. We are going to build a simple swing trading strategy using the oversold bounce technique combined with volume confirmation. Here is exactly what we teach our members to look for:
- Identify the Setup Conditions. We want to find a stock that is in a long-term uptrend but is currently experiencing a short-term pullback. Say Stock DEF usually trades near $60 but has dropped to $50 over the past week. We check our 14-period RSI and see it has dropped to a reading of 28. The stock is officially oversold.
- Wait for the Trigger Signal. We never buy simply because the indicator hits 28. A stock can stay oversold for weeks. Instead, we wait for the RSI line to cross back above the 30 level. This crossover tells us that buyers are finally stepping back in and momentum is shifting upward. When the reading crosses from 28 to 32, we have our trigger.
- Confirm With Volume. Before executing the trade, we look at the trading volume on the day of the crossover. We want to see higher-than-average volume. Heavy volume proves that large institutional buyers are participating in the bounce. If the volume is very low, we skip the trade because the bounce lacks conviction.
- Execute the Trade and Set Risk Parameters. We buy Stock DEF at $50.50. We immediately place a stop loss order just below the recent swing low, perhaps at $48.50. This means our maximum risk is $2.00 per share. We set our initial profit target at $56.50, which gives us a potential gain of $6.00 per share. This creates an excellent 3-to-1 reward-to-risk ratio.
- Manage the Outcome. There are three possible outcomes for this trade, and you need a plan for each one before you enter the position.
| Scenario | What Happens | Action | Result |
|---|---|---|---|
| Best Case | Stock rallies to $56.50 over the next week | Take profits, close the trade | +$6.00/share |
| Most Likely | Stock chops around, slowly grinding higher | Trail stop loss up to breakeven at $50.50 | Protected capital, open upside |
| Worst Case | Momentum fails, stock drops | Stop loss triggers at $48.50 | -$2.00/share |
What Are the Most Common RSI Mistakes Beginner Traders Make?
Understanding how to use RSI also means knowing what not to do. Beginners frequently lose money by misinterpreting the signals this indicator provides.
The most common mistake is treating the 70 level as an automatic short-selling signal. Just because a stock is overbought does not mean it will reverse. In strong bull markets, stocks can remain overbought for months. If you short a stock purely because the reading hits 75, you will likely get run over by the prevailing trend.
Another frequent error is ignoring the broader market context. If the S&P 500 is crashing, buying a single stock just because its RSI hits 25 is highly dangerous. Individual stocks rarely survive a broad market selloff, regardless of how oversold they appear on a chart.
Our team recommends combining this indicator with other technical tools. We prefer to use moving averages to define the trend first. For example, we only look for oversold buy signals if the stock is trading above its 200-day moving average. This simple rule ensures we are only buying pullbacks in established uptrends.
Watch Out: No indicator is perfect. False signals happen constantly in the financial markets. Never risk more than 1% to 2% of your total account capital on any single trade setup, even if the divergence looks textbook perfect. Proper risk management will keep you in the game long enough to let your technical analysis skills develop.
Here is a quick summary of the mistakes we see most often and how to avoid them:
- Shorting overbought stocks blindly. Always confirm the trend direction first. Overbought in an uptrend often means "strong," not "about to drop."
- Ignoring market context. Check the broader market (S&P 500, sector ETFs) before acting on any individual stock signal.
- Using RSI in isolation. Combine it with moving averages, volume analysis, or support and resistance levels for higher-probability setups.
- Oversizing positions on "perfect" setups. Stick to your 1-2% risk rule on every single trade, no exceptions.
Want expert trading insights delivered daily?
Join thousands of traders who rely on Traders Agency for market analysis and trade ideas.
Join Traders AgencyKey Takeaways
- RSI oscillates on a scale from 0 to 100 and uses a default 14-period lookback to measure the ratio of average gains to average losses.
- Readings above 70 signal overbought conditions, but in a strong uptrend this often means momentum is healthy, not that a reversal is imminent.
- RSI works differently depending on market conditions: in trending markets it can stay overbought or oversold for extended periods, making blind fade trades dangerous.
- Combining RSI with moving averages, volume analysis, or support and resistance levels produces higher-probability setups than using the indicator alone.
- Risk management still applies to RSI-based trades: the 1-2% rule per trade holds regardless of how clean the signal looks.
DISCLAIMER: Traders Agency does not offer financial advice. The information provided is for educational purposes only and should not be considered financial advice. Traders Agency is not responsible for any financial losses or consequences resulting from the use of the information provided. Trading carries inherent risks and may not be suitable for all individuals. You are advised to conduct your own research and seek personalized advice before making any investment decisions, recognizing the potential risks and rewards involved.
See more from Traders Agency on Google
Make us a preferred source and our market analysis will appear more prominently in your Google Search, Top Stories, and AI results.
Add to Preferred Sources