
You have probably seen this happen before. You buy a stock that looks promising, step away from your computer for a few hours, and come back to a massive loss. The market turned against you while you were not looking. A stop-loss strategy is a risk management approach where you set predetermined price levels to automatically sell an asset if it drops in value, protecting your trading capital from exactly this kind of scenario. We are going to walk you through how to calculate your risk, place the correct orders, and build a reliable defense for your portfolio.
What Is a Stop-Loss Order and Why Do Traders Use One?
Bottom Line: A stop-loss strategy is not just about picking a price to exit. It is a complete system that pairs logical stop placement with disciplined position sizing so that no single trade can do serious damage to your account. Traders who internalize both sides of that equation are the ones who stay in the game long enough to become consistent.
A stop-loss order is an automated instruction sent to your broker to buy or sell a stock once it reaches a specific price, known as the stop price. When the stock hits this price, the stop-loss converts into a regular market order and executes at the next available price.
Think of this order as an insurance policy for your trade. You pay a small premium in the form of a minor loss to avoid a total disaster. The SEC's investor education resources highlight stop orders as a fundamental tool to limit potential losses, and our team agrees completely.
Key Concept: A stop-loss order removes emotion from your exit decision. When a stock drops, human nature tells you to hold on and hope it recovers. The automated order forces you to stick to your original plan.
We teach our members that trading without a stop is like driving without brakes. You might be fine on a straight road, but a sudden turn will cause a crash. A clear stop-loss strategy keeps your losses small and predictable so you can stay in the game long enough for your winners to pay off.
Stop-Loss vs. Stop-Limit Orders: Which Should You Use?
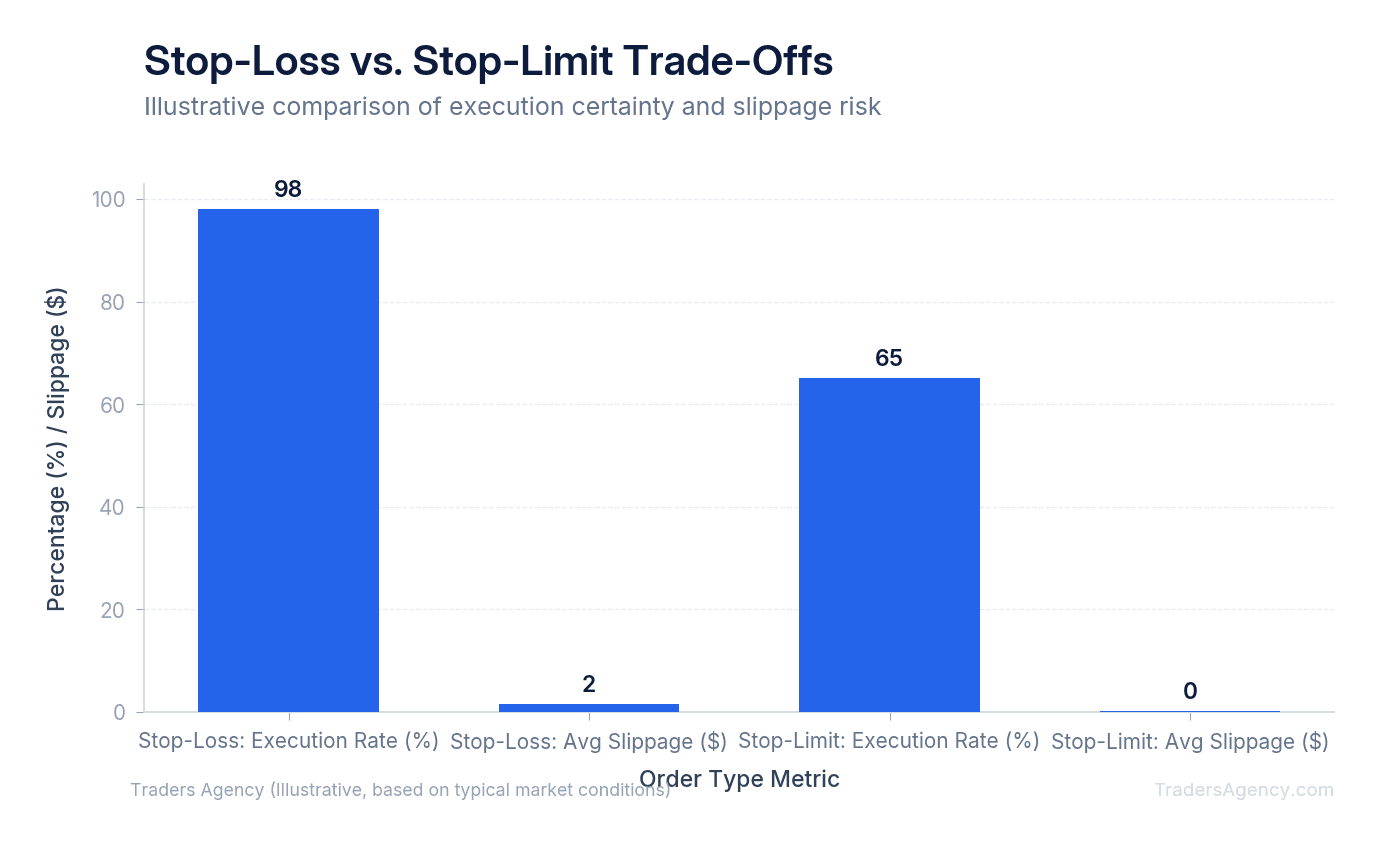
A stop-loss order guarantees execution but does not guarantee the final sale price. A stop-limit order guarantees a specific price limit but does not guarantee execution. Traders must choose between accepting potential slippage with a stop-loss or risking no fill at all with a stop-limit.
When you use a standard stop-loss, the order converts to a market order once triggered. If a stock is dropping fast, your fill price might be slightly lower than your stop price. This difference is called slippage.
A stop-limit order adds a second price point. You set a stop price to trigger the order and a limit price that acts as your minimum acceptable sale price. Here is how that works in practice:
| Step | Action | Price |
|---|---|---|
| Entry | Buy shares of AAPL | $150 |
| Stop Price | Order triggers when stock falls to | $140 |
| Limit Price | Minimum acceptable sale price | $139 |
| Outcome A | Stock drops to $140 and sells at $139.50 | Filled |
| Outcome B | Stock gaps down to $138, skipping your limit | Not Filled |
If the stock price falls instantly to $138, your stop-limit order will not execute. You will be stuck holding a losing position as the price continues to drop. Because of this risk, our team prefers standard stop-loss orders for basic risk management. We accept a few cents of slippage to guarantee we exit a bad trade.
How Do You Calculate Stop Distance When Placing a Trade?
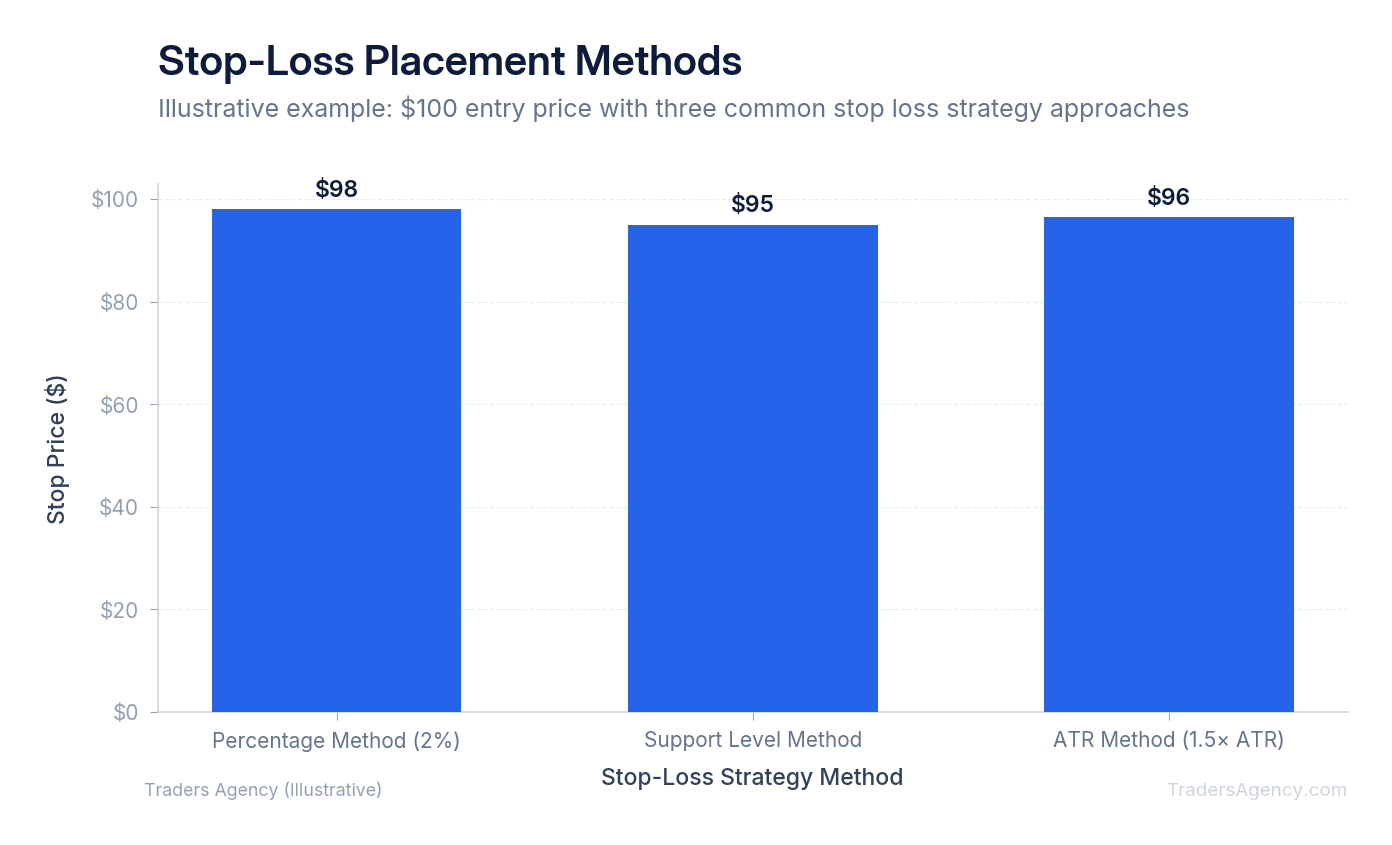
Traders calculate stop distance using three primary methods: a fixed percentage drop from the entry price, a technical support level on the chart, or a volatility-based metric like the Average True Range (ATR). Each method offers a different way to measure risk based on market conditions.
1. The Percentage Method
This is the simplest approach for beginners. You decide on a maximum percentage you are willing to lose on any given trade.
If you buy a stock at $100 and use a 5% stop loss, you place your order at $95. If you use a tighter 2% rule, your stop goes at $98. This method is easy to calculate but ignores the natural price movement of the specific stock.
2. The Support Level Method
This method uses technical analysis to find logical exit points. A support level is a price area where a stock has historically stopped falling and bounced back up.
If a stock is trading at $50 but has repeatedly bounced off the $45 mark, that $45 level is support. We place our stop slightly below support, perhaps at $44.50. If the price breaks through that floor, the original reason for taking the trade is no longer valid.
3. The ATR Stop-Loss Method
The Average True Range (ATR) is an indicator that measures how much a stock moves on an average day. This is our preferred method because it adapts to market volatility.
If a stock normally swings $2 per day, a $0.50 stop loss will get triggered by normal market noise. You will be kicked out of the trade before it has a chance to work.
Here is a step-by-step example of an ATR stop loss:
- Check the current price. The stock you want to buy is trading at $100.
- Read the ATR indicator on your charting platform. It reads $3.00.
- Apply a multiplier. We recommend using 2x ATR for most setups.
- Calculate the stop distance. Multiply the ATR by two: $3.00 x 2 = $6.00.
- Set your stop price. Subtract from your entry: $100 - $6.00 = $94.
- Place your stop order at $94.
| Method | Entry Price | Stop Price | Risk per Share |
|---|---|---|---|
| Percentage (2%) | $100 | $98 | $2.00 |
| Support Level | $100 | $94.50 | $5.50 |
| ATR (2x, ATR = $3) | $100 | $94.00 | $6.00 |
How Do Trailing Stop Orders Work?
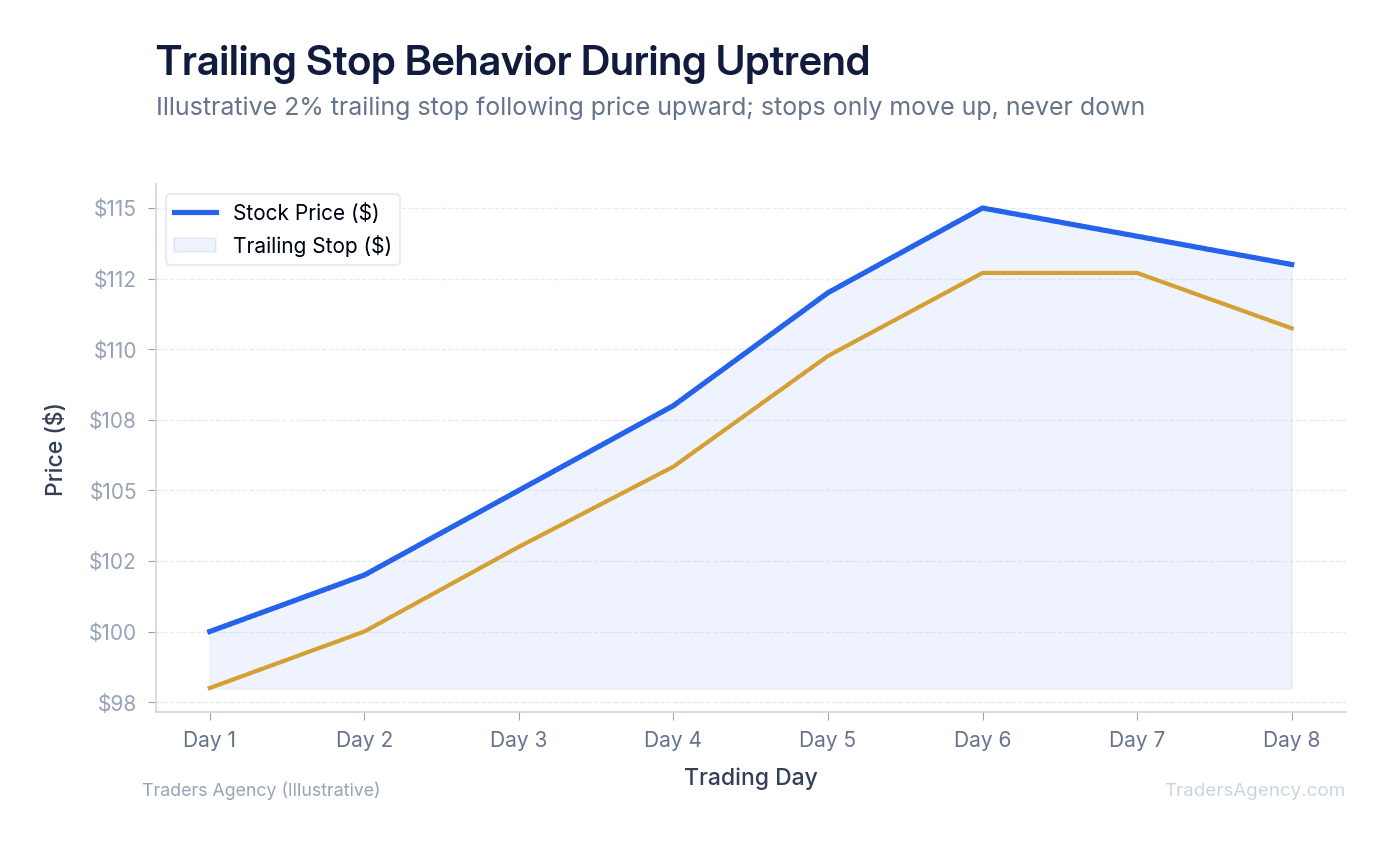
A trailing stop-loss is a dynamic order that moves up as the stock price increases but remains frozen if the price falls. This allows you to lock in profits during an uptrend while still protecting against sudden reversals.
Instead of setting a fixed price, you set a trailing amount. This can be a dollar amount or a percentage. The stop price automatically adjusts based on the highest price the stock reaches after you enter the order.
Here is a concrete example using a trailing percentage:
- Enter the trade. You buy shares at $100 and set a trailing stop at 10%.
- Initial stop is calculated. Your stop price starts at $90 (10% below $100).
- The stock climbs. Over a great week, the price reaches $120.
- Your stop moves up automatically. It adjusts to $108 (10% below $120).
- The stock pulls back. Price drops to $115, but your stop stays frozen at $108.
- If the stock falls to $108, the order triggers and sells your shares for an $8 per share profit.
Key Concept: A trailing stop only moves in your favor. It rises with the stock price but never drops back down. This means you never have to manually update your order as the trade moves in your direction.
Want expert trading insights delivered daily?
Join thousands of traders who rely on Traders Agency for market analysis and trade ideas.
Join Traders AgencyWhat Is Gap Risk and When Can Stops Fail?
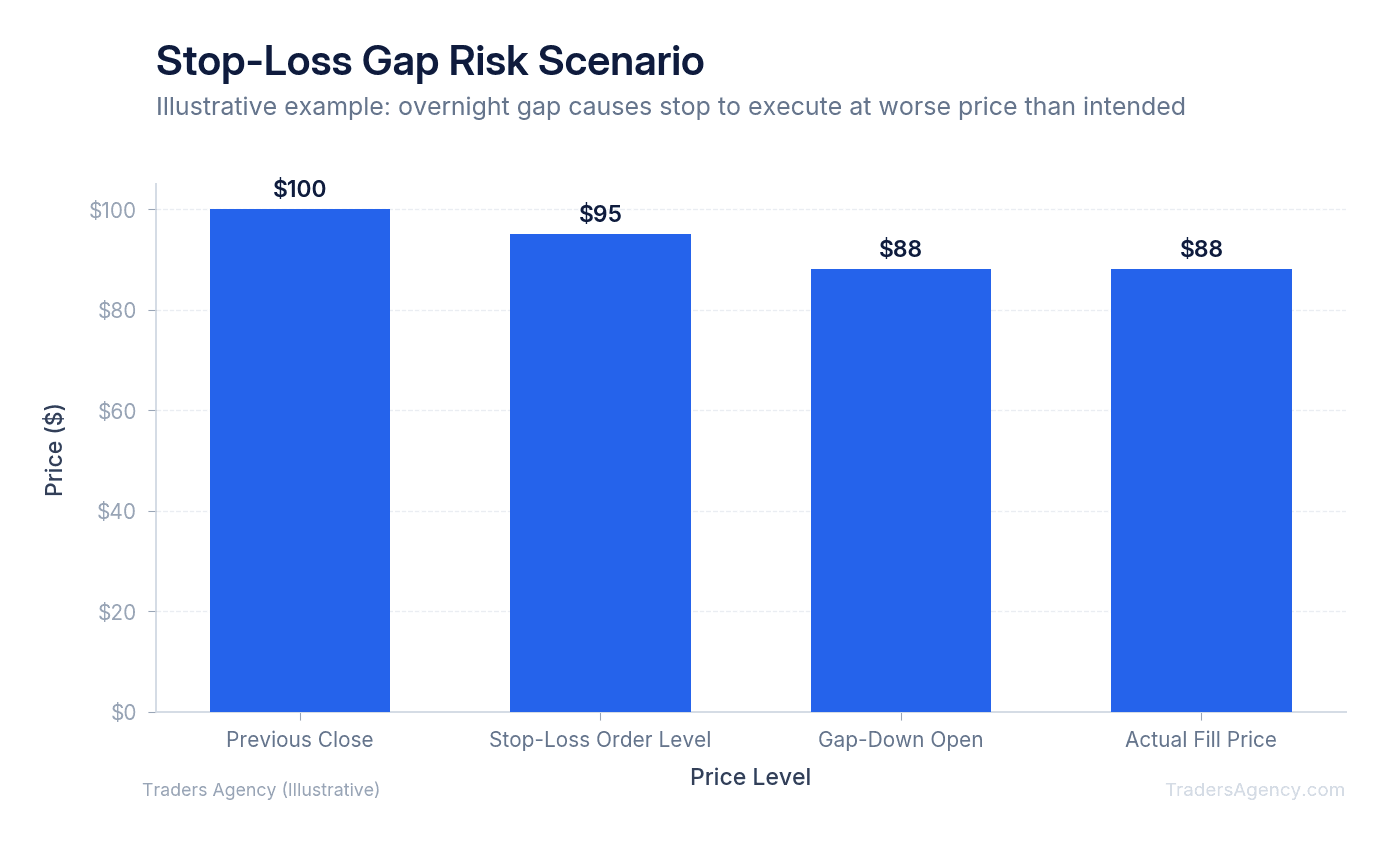
Gap risk occurs when a stock opens at a significantly lower price than its previous close, completely bypassing your stop price. In these situations, a standard stop-loss order triggers immediately at the open and executes at a much worse price than you intended.
The stock market is not open 24 hours a day. Major news events, earnings reports, or economic data releases often happen overnight or over the weekend. This causes the stock to "gap" down when regular trading hours resume.
Here is what gap risk looks like in a real trading scenario:
| Event | Price | What Happens |
|---|---|---|
| Tuesday afternoon | $50 | You hold shares with a stop at $48 |
| Tuesday evening | N/A | Company announces a terrible earnings report |
| Wednesday open | $40 | Stock gaps below your $48 stop |
| Execution | $40 | Your planned $2 loss becomes a $10 loss |
Watch Out: Stop orders only work when there is continuous trading. They cannot protect you from overnight gaps. To manage this risk, we often reduce position sizes before major earnings announcements or scheduled economic reports.
How Do You Place a Stop-Loss Order With Your Broker?
Placing these orders inside a broker interface is a straightforward process. While every trading platform looks slightly different, the core mechanics remain identical across the industry. Here is how to set a stop loss on an existing position:
- Open Your Order Ticket. Navigate to your portfolio and select the stock you want to protect. Click the "Sell" or "Close Position" button to open a new order ticket. Make sure the quantity matches the exact number of shares you want to protect.
- Select the Order Type. Look for a dropdown menu labeled "Order Type." By default, this is usually set to "Market" or "Limit." Click the menu and select Stop (sometimes labeled as Stop Market). If you want to use a trailing order, select Trailing Stop instead.
- Enter Your Stop Price. A new field will appear asking for your activation price. Enter the exact dollar amount you calculated using the ATR or support level methods. If you selected a trailing stop, you will enter your trailing amount as either a percentage or a dollar value.
- Set the Time in Force. This setting tells the broker how long the order should remain active. A Day Order expires at the end of the current trading day. A Good 'Til Canceled (GTC) order remains active for up to 60 or 90 days, depending on your broker. Always select GTC for your protective stops. If you leave it as a Day order, your protection will vanish when the closing bell rings, leaving your position exposed the next morning.
- Review and Submit. Double-check your ticket. Confirm you are selling the correct number of shares at the correct trigger price. Click submit to send the order to your broker. You should now see the active order sitting in your working orders tab.
Watch Out: Forgetting to set your Time in Force to GTC is one of the most common beginner mistakes. A Day order disappears at market close, leaving your position completely unprotected overnight.
Building Your Stop-Loss Strategy: Common Mistakes to Avoid
Knowing how to place the order is only half the battle. You must also know how to manage the order once it is live. Our team sees new traders make the same errors repeatedly when first implementing a stop-loss strategy.
Mistake 1: Setting Stops Too Tight
If you place your stop too close to your entry price, you will experience a "whipsaw." This happens when normal market volatility triggers your order, selling your shares just before the stock shoots up in your intended direction. Always give the trade room to breathe by using the ATR method we discussed earlier.
Mistake 2: Moving Stops Down
This is the most destructive habit a trader can develop. You set a stop at $90. The stock drops to $91. Panic sets in, and you modify your order down to $85 to avoid taking the loss.
By moving the order down, you completely defeat the purpose of having a risk management plan. When you enter a trade, accept the predetermined risk. If the stock hits your level, take the small loss and move on to the next opportunity.
Integrating Risk Management and Position Sizing
Your stop distance must dictate your position size. We teach a strict rule: never risk more than 1% to 2% of your total account equity on a single trade.
| Parameter | Value |
|---|---|
| Account Size | $10,000 |
| Max Risk per Trade (1%) | $100 |
| Stop Distance | $5 per share |
| Maximum Position Size | 20 shares ($100 ÷ $5) |
This mathematical approach ensures that a single bad trade will never ruin your account. You can suffer a string of losses and still have plenty of capital left to trade the next day. A solid stop loss strategy combines logical stop placement with strict position sizing, and that combination is what separates consistent traders from those who blow up their accounts.
Our education team publishes new strategy guides and market analysis every week. If you found this guide helpful, there is much more waiting for you inside the membership.
Want expert trading insights delivered daily?
Join thousands of traders who rely on Traders Agency for market analysis and trade ideas.
Join Traders AgencyKey Takeaways
- A stop-loss order converts into a market order once the stop price is hit, meaning execution happens at the next available price, which may differ slightly from your target.
- Position sizing math matters: if you risk $500 per trade and your stop is $5 away from your entry, you should hold 100 shares ($500 divided by $5).
- The article outlines three methods for calculating stop distance, giving traders a structured way to set stops based on logic rather than gut feeling.
- Removing emotion from your exit is the core function of a stop-loss. The automated order enforces your original plan even when human instinct says to hold and hope.
- A stop-loss strategy only works when combined with strict position sizing. One without the other leaves your account vulnerable to a single bad trade.
DISCLAIMER: Traders Agency does not offer financial advice. The information provided is for educational purposes only and should not be considered financial advice. Traders Agency is not responsible for any financial losses or consequences resulting from the use of the information provided. Trading carries inherent risks and may not be suitable for all individuals. You are advised to conduct your own research and seek personalized advice before making any investment decisions, recognizing the potential risks and rewards involved.
See more from Traders Agency on Google
Make us a preferred source and our market analysis will appear more prominently in your Google Search, Top Stories, and AI results.
Add to Preferred Sources