
An RSI divergence strategy is a technical analysis method that compares price action to the Relative Strength Index to spot when momentum is slowing down. You've probably seen this happen on your own charts: a stock is making new highs, everyone is buying, and then suddenly the price collapses. We're going to walk you through how to spot these momentum shifts before the crowd does. By the end of this guide, you'll know how to identify both reversal and continuation setups using RSI and MACD. Our team relies on these specific patterns to find high-probability entries and manage risk in mature trends.
What Is an RSI Divergence Strategy?
Bottom Line: RSI divergence works because it measures the speed behind a price move, not just the move itself. When that speed drops while price keeps climbing, the trend is running on fumes. Pairing RSI divergence with MACD histogram confirmation and strict position sizing gives traders a repeatable framework for catching reversals and continuation setups before the broader market reacts.
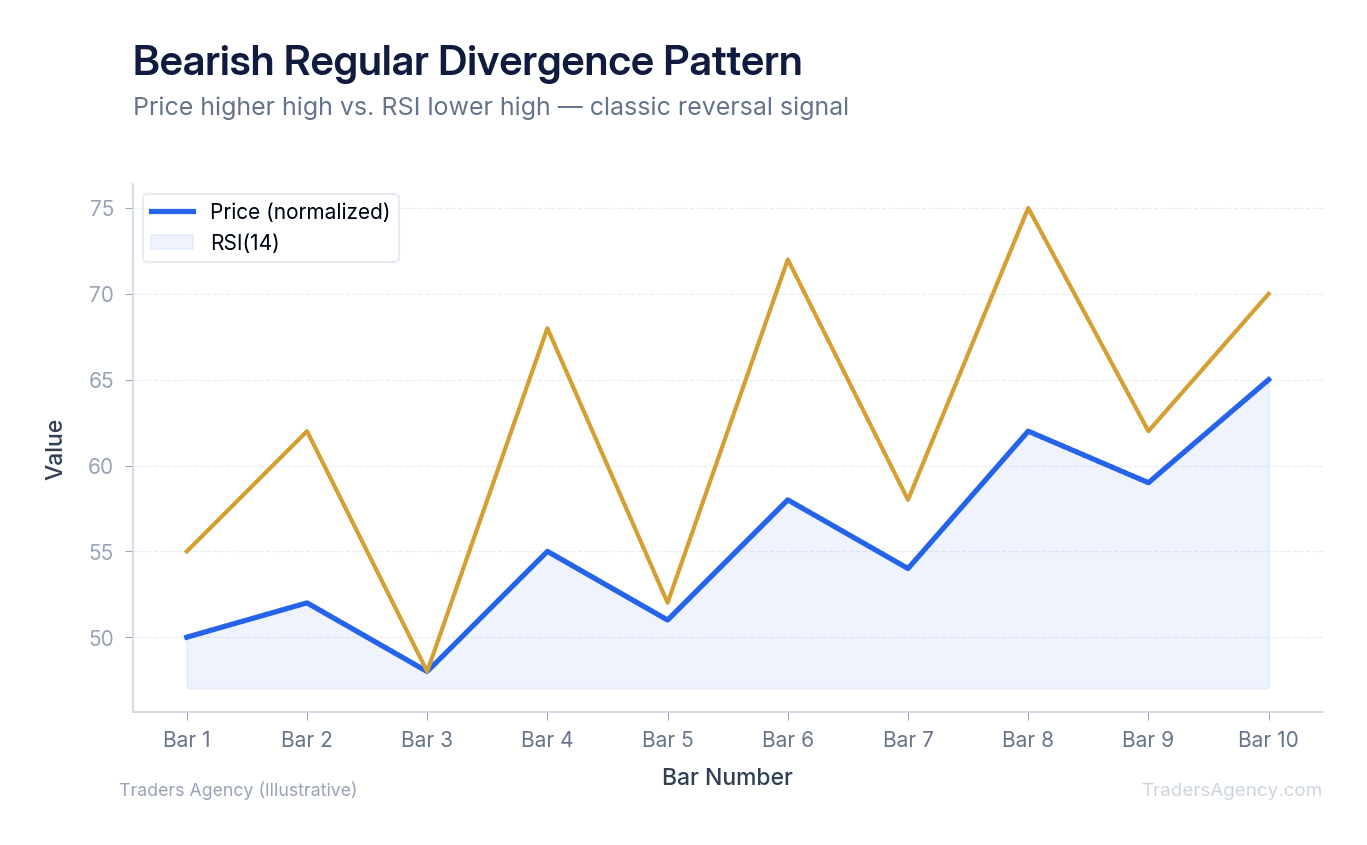
An RSI divergence strategy is a trading technique that identifies a disagreement between price direction and the Relative Strength Index indicator. When price makes a higher high but the RSI makes a lower high, it signals weakening momentum. Traders use this discrepancy to anticipate potential price reversals or trend continuations.
We teach our members that indicators like RSI and MACD measure the speed of price movement. Think of a car driving up a steep hill. The car is still moving forward (price is rising), but the driver is letting off the gas pedal (momentum is falling). Eventually, the car will stall and roll backward.
Key Concept: Divergence occurs when price and a momentum indicator disagree on direction. Price may be making new highs, but if the indicator is making lower highs, the trend's internal strength is fading. This disagreement is your early warning signal.
The SEC's investor education resources often highlight momentum indicators as secondary confirmation tools. They are not standalone magic signals. You must combine them with price action to find a valid trade entry.
What Is the Difference Between Regular and Hidden Divergence?
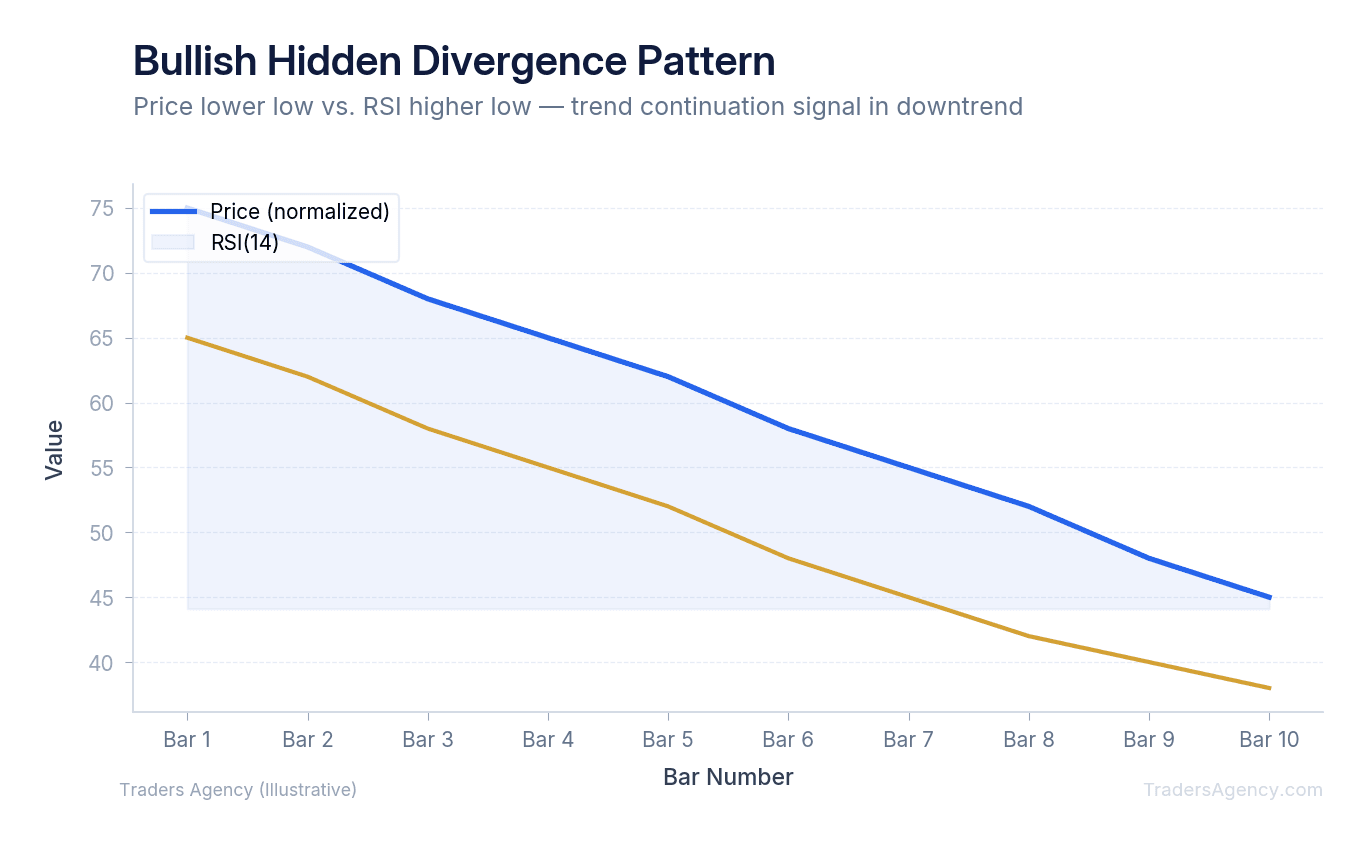
The difference between regular and hidden divergence comes down to trend direction. Regular divergence occurs when price makes a new high or low but the indicator does not, signaling a potential trend reversal. Hidden divergence happens when the indicator makes a new high or low but price does not, signaling trend continuation.
Regular divergence tells us the current trend is exhausted. If a stock pushes to $150, pulls back, and then pushes to $155, you have higher highs in price. If the RSI hits 75 on the first peak but only reaches 62 on the second peak, you have a bearish divergence setup.
Hidden divergence tells us the current trend is taking a breather before resuming. In a bullish hidden divergence, the stock price drops to a higher low, say $140 from a previous low of $135. However, the RSI prints a lower low, moving from 35 down to 28. The selling pressure looks artificially high, meaning buyers are likely to step back in.
| Divergence Type | Price Action | Indicator Action | Signal |
|---|---|---|---|
| Bearish Regular | Higher High | Lower High | Trend Reversal (Sell) |
| Bullish Regular | Lower Low | Higher Low | Trend Reversal (Buy) |
| Bullish Hidden | Higher Low | Lower Low | Trend Continuation (Buy) |
| Bearish Hidden | Lower High | Higher High | Trend Continuation (Sell) |
How Do You Use MACD Histogram Divergence for Entry Signals?
While RSI measures overbought and oversold conditions, we prefer to use the MACD histogram to measure the distance between moving averages. The MACD histogram shows the exact difference between the MACD line and the signal line. This makes it incredibly sensitive to short-term momentum shifts.
When a stock pushes to a new high of $200, but the MACD histogram bars are visibly shorter than the previous peak, you have a clear warning sign. The visual shrinking of the histogram bars means the short-term moving average is catching up to the long-term moving average.
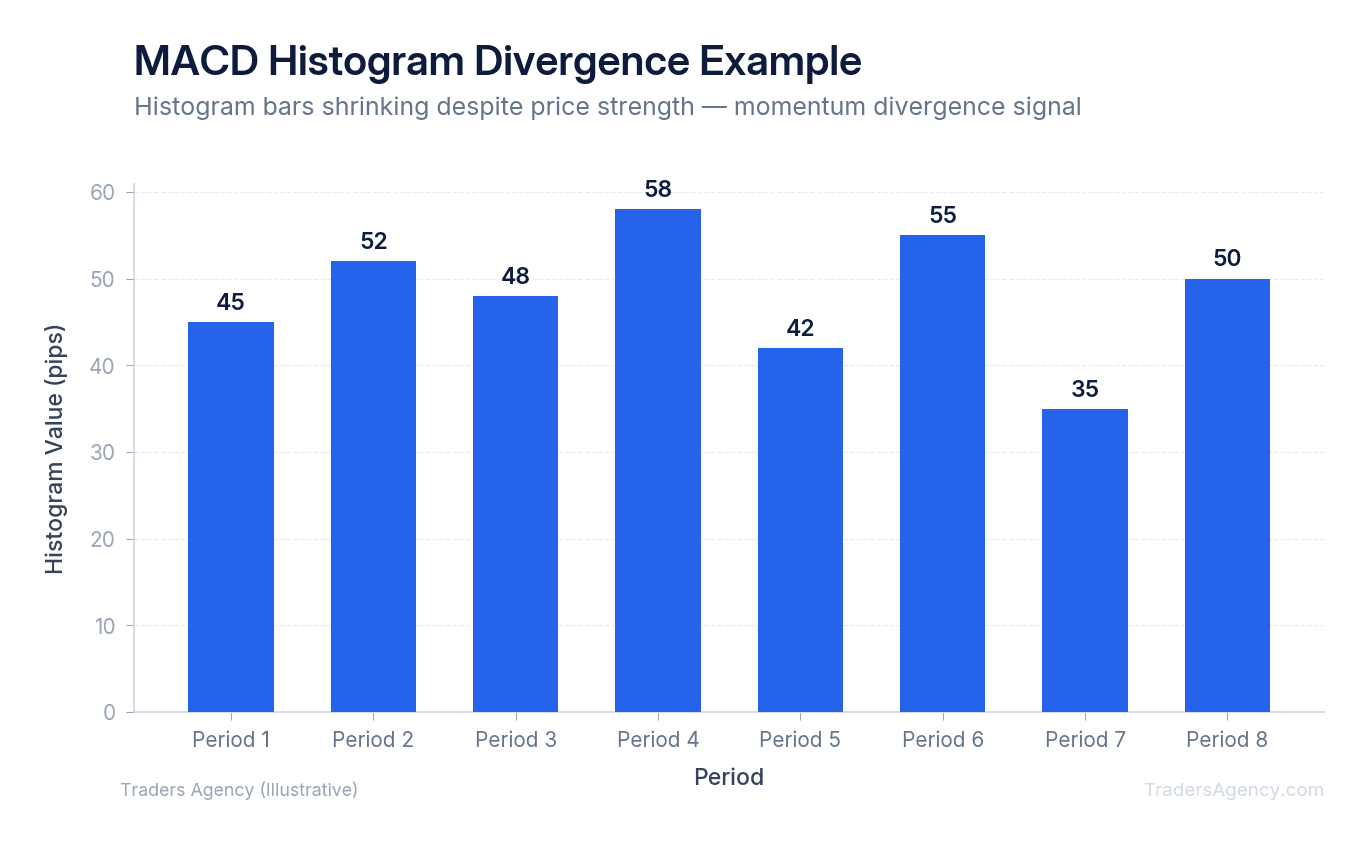
The trend is losing its power. We use this specific MACD histogram divergence to tighten stop losses on long positions or prepare for a short entry. You can literally see the buying volume drying up as the green bars get smaller and smaller on your chart.
How Do You Confirm a Divergence Signal Before Entering a Trade?
You confirm a divergence signal by checking multiple timeframes and waiting for a structural break in price. You should never enter a position based solely on a diverging indicator. Instead, wait for the price to break a trendline, cross a moving average, or violate a recent support level.
We always look for multi-timeframe divergence confirmation. If you spot a bullish divergence on the 1-hour chart, check the 4-hour chart immediately.
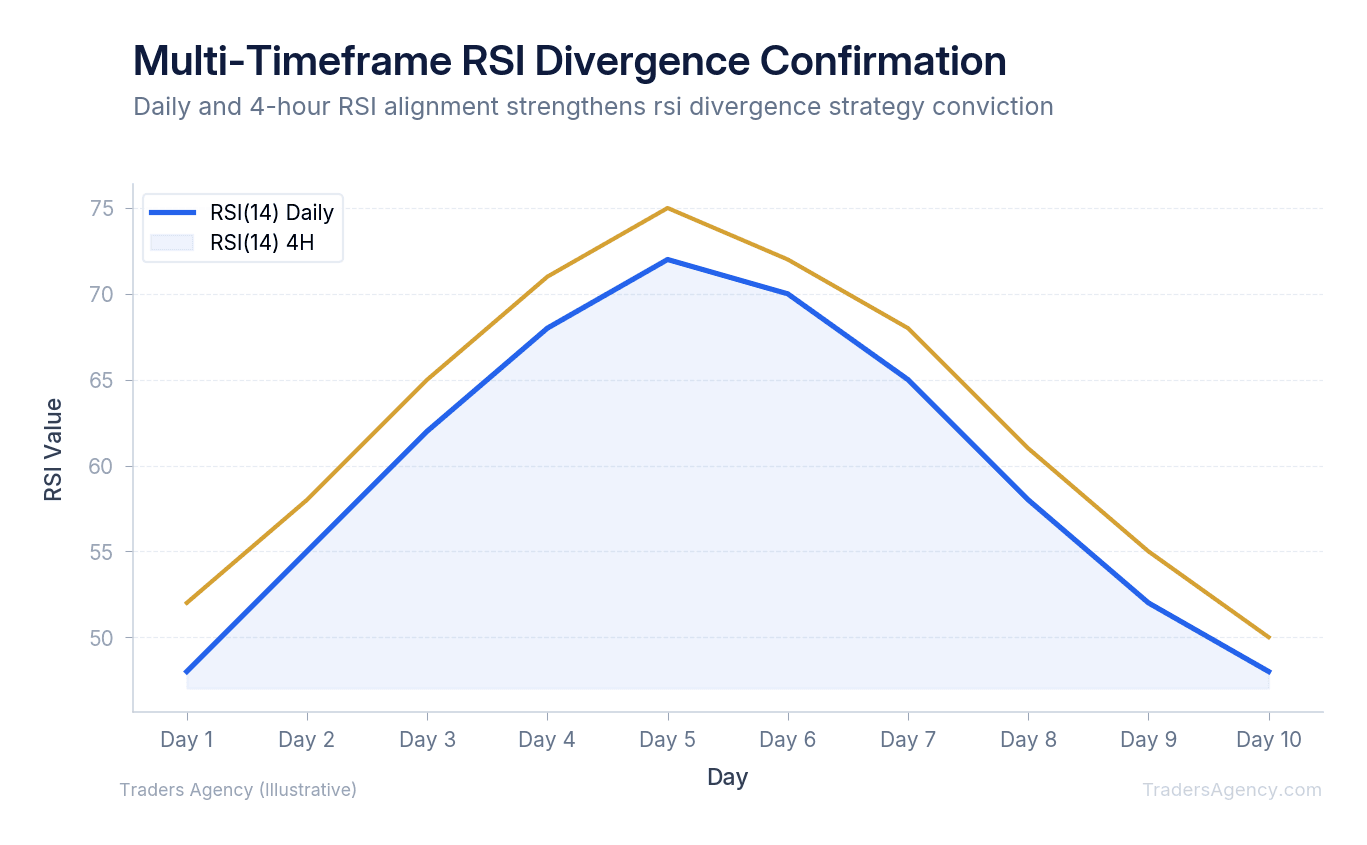
If the 4-hour chart is also showing oversold conditions or its own divergence, your conviction can increase. A common mistake is taking a 15-minute divergence signal directly into the teeth of a strong daily downtrend. Aligning your timeframes keeps you out of low-probability trades.
Watch Out: A divergence signal on a lower timeframe (5-minute or 15-minute) that conflicts with the higher timeframe trend is one of the most common traps for new traders. Always confirm that your signal aligns with the bigger picture before committing capital.
Want expert trading insights delivered daily?
Join thousands of traders who rely on Traders Agency for market analysis and trade ideas.
Join Traders AgencyStep-by-Step: Trading Hidden Divergence for Trend Continuation
Most traders focus entirely on reversals. Our team recommends mastering hidden divergence for trend continuation trades. These are often higher-probability setups because you're trading in the direction of the primary trend.
Here's a concrete example of how we trade a bullish divergence signal using the hidden setup:
- Identify the uptrend: Stock XYZ is clearly trending higher on the daily chart, moving from $50 to $70.
- Wait for the pullback: Price pulls back to $62, forming a higher low compared to the previous $50 swing low.
- Check the RSI: During this pullback, the RSI drops to 35, which is lower than the RSI reading of 42 at the previous $50 price low.
- Execute the trade: We enter long at $62.50 once the price breaks above the previous day's high.
- Set the parameters: We place a stop loss at $59 (below the recent swing low) and target a return to the $70 high.
| Parameter | Value |
|---|---|
| Ticker | XYZ |
| Entry Price | $62.50 |
| Stop Loss | $59.00 (below swing low) |
| Target | $70.00 (previous high) |
| Risk per Share | $3.50 |
| Reward per Share | $7.50 |
| Risk-to-Reward Ratio | 1:2.14 |
The logic here is simple and highly effective. The indicator got heavily oversold, but the price barely dropped. Buyers are aggressively defending the trend, making this a prime entry location.
When Should You Use or Avoid Divergence Trades?
Divergence trading works best in mature, established trends. If a stock has been grinding higher for three months in a clean channel, an RSI divergence strategy can help you perfectly time your exit. You want to see clear, defined swing highs and swing lows to draw your divergence lines accurately.
However, we tell our members to avoid divergence trading during parabolic, news-driven breakouts. If a company announces massive earnings growth, the stock might gap up and run for days. The RSI will show a bearish divergence setup the entire time, but the price will simply ignore it and keep climbing.
You should also avoid this strategy in tight, choppy, sideways markets. Indicators will whip back and forth across their centerlines, creating endless false signals. If the price is stuck in a tight $5 range, ignore the MACD and RSI entirely.
Key Concept: Divergence signals are most reliable at the end of extended, well-defined trends. The longer and cleaner the trend, the more meaningful the divergence. In choppy or news-driven markets, these signals lose their edge quickly.
Risk Management and Position Sizing
Even the most perfect technical analysis divergence setup will fail sometimes. This is why strict risk management is non-negotiable for our trading team. A divergence signal is an edge, not a guarantee.
Our team prefers to risk no more than 1% to 2% of total account equity on a single divergence trade. If you have a $50,000 account, your maximum loss on the trade should be capped at $500 to $1,000. This ensures that a string of false signals won't destroy your portfolio.
Always place your stop loss beyond the extreme of the divergence pattern. For a bearish reversal trade, place your stop just above the highest price peak. If the price breaks that peak, the divergence is invalidated, and you need to exit the trade immediately.
Risk Warning: Divergence signals can persist for extended periods before price finally reverses. A stock showing bearish RSI divergence can continue making new highs for weeks. Never increase position size just because the divergence "looks stronger." Stick to your 1% to 2% risk rule on every single trade.
Our education team publishes new strategy guides and market analysis every week. If you found this breakdown of the RSI divergence strategy helpful, put it into practice on a demo account first. Track your divergence signals, note which timeframes and market conditions produce the best results, and build your confidence before risking real capital.
Want expert trading insights delivered daily?
Join thousands of traders who rely on Traders Agency for market analysis and trade ideas.
Join Traders AgencyKey Takeaways
- Divergence occurs when price makes a new high but RSI makes a lower high, signaling that momentum is fading even as price continues to rise.
- Hidden divergence points to trend continuation rather than reversal, giving traders a way to enter an existing trend at a better price.
- MACD histogram divergence can be used to time entries more precisely once RSI divergence has already identified the setup.
- Multi-timeframe confirmation matters: divergence signals on higher timeframes carry more weight than those on lower timeframes alone.
- Risk management stays fixed regardless of how compelling the divergence looks. The 1% to 2% rule per trade applies every time, no exceptions.
DISCLAIMER: Traders Agency does not offer financial advice. The information provided is for educational purposes only and should not be considered financial advice. Traders Agency is not responsible for any financial losses or consequences resulting from the use of the information provided. Trading carries inherent risks and may not be suitable for all individuals. You are advised to conduct your own research and seek personalized advice before making any investment decisions, recognizing the potential risks and rewards involved.
See more from Traders Agency on Google
Make us a preferred source and our market analysis will appear more prominently in your Google Search, Top Stories, and AI results.
Add to Preferred Sources