You've probably stared at a chart covered in moving averages, RSI lines, and MACD histograms until it looked like a bowl of colorful spaghetti. We see this happen constantly with new traders. Our team's recommendation? Strip away the noise and focus on what actually matters: price itself. In this guide, we'll teach you how to read market structure, identify high-probability setups, and execute trades using a naked chart. By the end, you'll know exactly how to spot entries and manage risk using only candlestick patterns and support levels.
What Is Price Action Trading Without Indicators?
Bottom Line: Price action trading works because it removes the lag built into every mathematical indicator and forces you to read the market as it is, not as it was. The core skill is learning to identify market structure, key levels, and candlestick signals on a clean chart, then confirming high-probability setups with volume before committing capital. Master that process and you have a repeatable framework that does not depend on any single indicator ever catching up to price.
Price action trading without indicators is a methodology where traders make buying and selling decisions based purely on historical price charts. We rely on candlestick patterns, trendlines, and support or resistance levels to read price behavior, completely removing lagging technical overlays from our screens.
This method forces you to watch the actual battle between buyers and sellers. When you use a clean chart, you stop waiting for a moving average to cross. Instead, you react to real-time market structure trading signals. Indicators calculate past data, meaning they always react after the move has started. Price action shows you exactly what is happening right now.
Key Concept: Think of it like driving a car by looking out the windshield instead of staring at the GPS screen. The GPS tells you where you've been. The windshield shows you the road directly in front of you. We prefer to trade what we can see happening in the present moment.
Key Concepts: Trends, Levels, and Market Structure
We teach our members to identify the dominant trend before doing anything else. A confirmed uptrend consists of higher highs and higher lows. A confirmed downtrend consists of lower highs and lower lows. If the chart is moving sideways without a clear direction, the market is in a consolidation phase.
Next, we map out horizontal support and resistance zones. These are specific price areas where institutional buyers or sellers have previously stepped in. Support acts as a floor where buyers take control. Resistance acts as a ceiling where sellers push the price back down.
Once we identify these levels, we look for candlestick patterns to confirm our bias. A single candlestick tells a story about the trading session. A long lower wick indicates that sellers tried to push the price down, but buyers overwhelmed them by the end of the period.
When you combine a clear trend, a major support level, and a bullish candlestick pattern, you have a high-probability trade setup.
Can You Trade With Only Price Action?
Yes, you absolutely can. Many professional traders prefer this clean approach because it eliminates the lag created by mathematical indicators, allowing for faster entries and tighter risk management based on actual support and resistance levels.
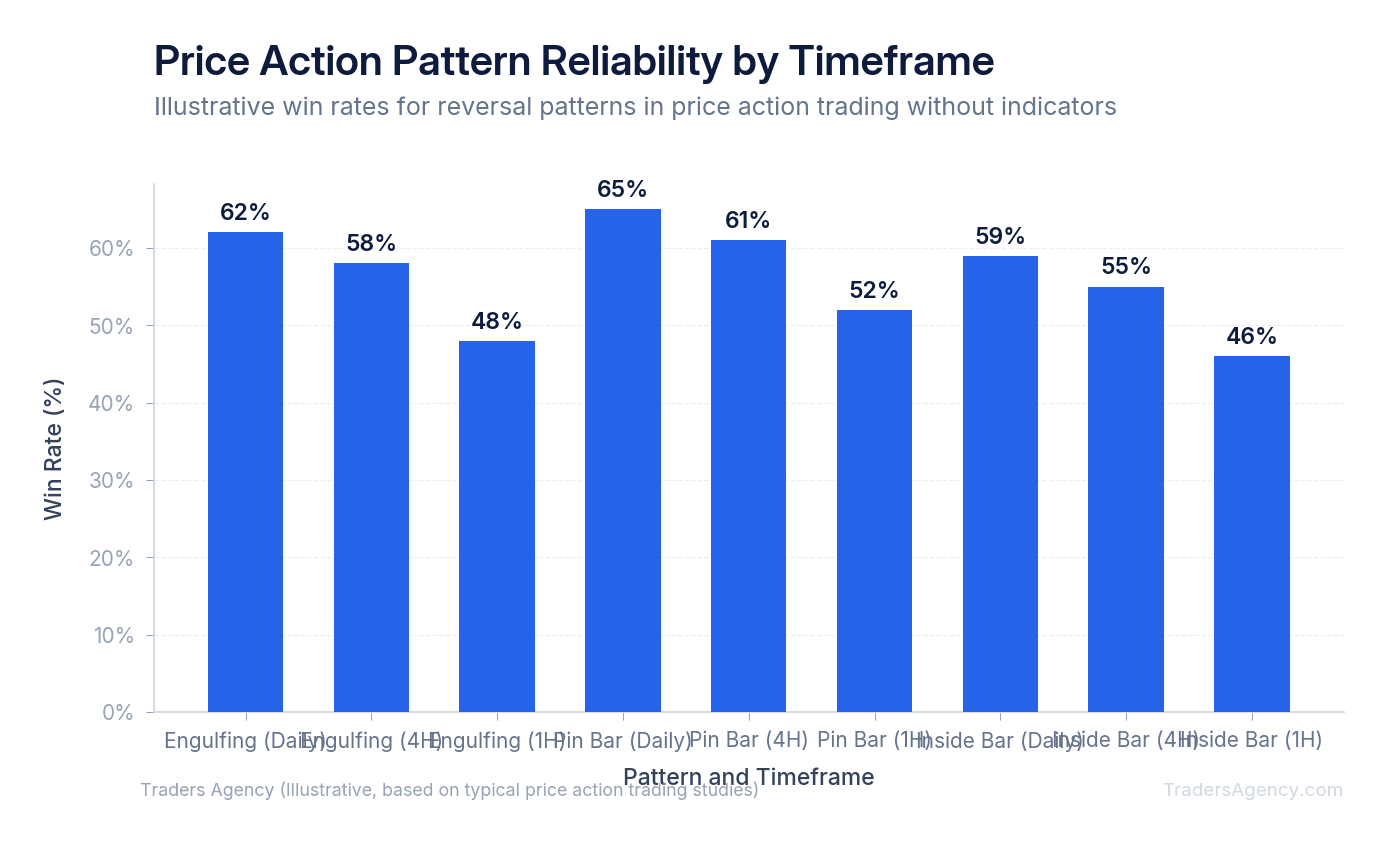
Timeframes play a massive role in the success of this strategy. In our experience, price action trading without indicators works best on the 1-hour, 4-hour, and daily charts. On a 1-minute chart, algorithmic trading noise often creates false signals that trap retail traders.
On a daily chart, a bullish engulfing pattern carries significant weight. It represents a full day of buying pressure and institutional commitment. We advise our members to start their analysis on the daily timeframe to find major levels, then drop down to the 1-hour chart to pinpoint their exact entry.
Our Recommended Approach: Start on the daily chart to identify the trend and key support/resistance zones. Then move to the 1-hour or 4-hour chart to find your precise entry point using candlestick confirmation patterns.
Step-by-Step: Trading a Price Action Breakout
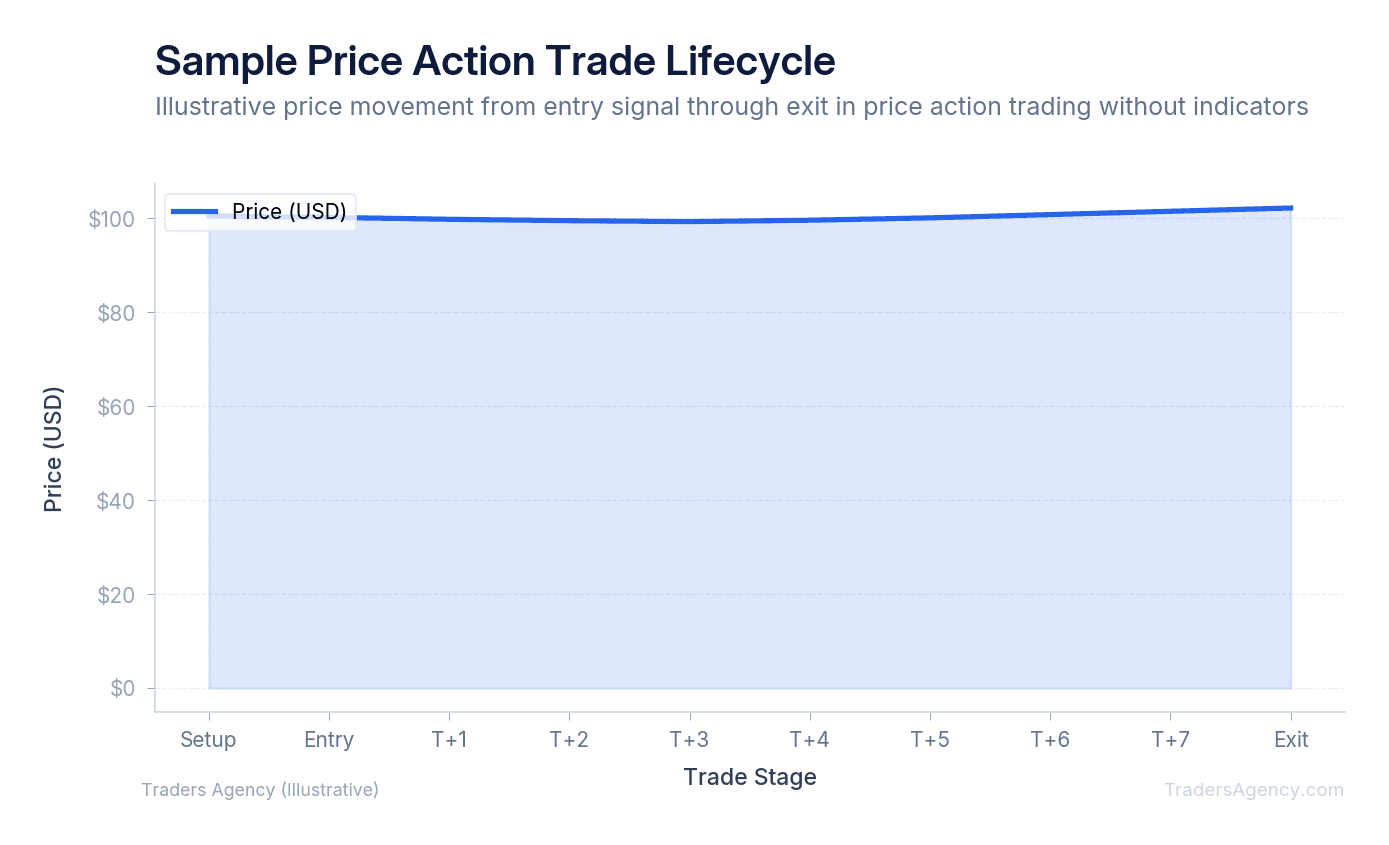
Let's walk through a concrete example of a breakout trade using a hypothetical stock, XYZ Corp, currently trading at $50.00. We'll use a clean chart to plan the entire trade from setup to exit.
- Identify the Setup: We look at the daily chart and see that XYZ Corp has tested the $52.00 resistance level three times over the past month. Each time, sellers pushed the price back down. However, the pullbacks are getting shallower, forming higher lows. This tells us buyers are becoming more aggressive.
- Wait for the Breakout: We do not anticipate the breakout. We wait for a strong daily candle to close completely above the $52.00 level. On Tuesday, the stock surges and closes at $52.60. The resistance level is officially broken.
- Enter on the Retest: Amateur traders chase the initial surge. We prefer to wait for a pullback. Old resistance often becomes new support. We place a buy limit order at $52.10 to catch the retest of the breakout level. On Thursday, the price dips to $52.05, filling our order, before bouncing higher.
- Manage the Risk: We place our stop loss at $50.80, safely below the breakout zone and the recent swing low. Our profit target sits at the next major resistance level on the daily chart: $56.00.
| Parameter | Value |
|---|---|
| Stock | XYZ Corp at $50.00 |
| Breakout Level | $52.00 (tested 3 times) |
| Entry Price | $52.10 (retest of breakout) |
| Stop Loss | $50.80 (below swing low) |
| Profit Target | $56.00 (next resistance) |
| Risk per Share | $1.30 |
| Reward per Share | $3.90 |
| Risk-to-Reward Ratio | 1:3 |
If the trade works, we risk $1.30 per share to make $3.90 per share. That's a highly favorable 1:3 risk-to-reward ratio. If the trade fails, our strict stop loss protects our trading capital.
Want expert trading insights delivered daily?
Join thousands of traders who rely on Traders Agency for market analysis and trade ideas.
Join Traders AgencyHow Do You Handle False Breakouts and Whipsaws in Price Action Trading?
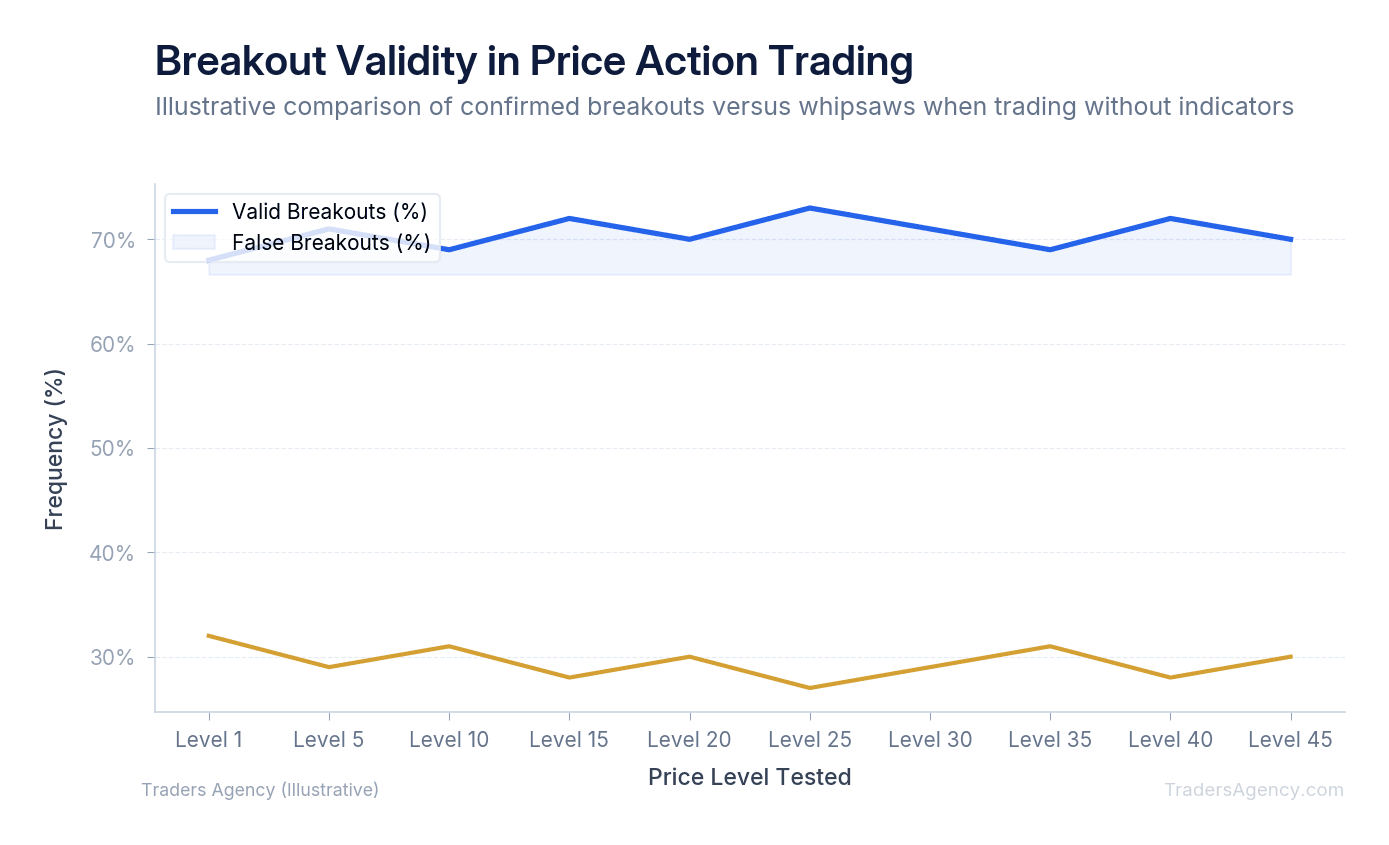
A false breakout occurs when price pushes past a key level but immediately reverses direction. This traps eager buyers who bought the initial spike. Handling these traps is a required skill when reading price behavior.
To avoid false breakouts, we wait for candle closes rather than trading intraday spikes. If XYZ Corp spikes to $52.80 during the morning session but closes the day at $51.50, it leaves a long upper wick on the daily chart.
This specific formation is a bearish pin bar. It tells us sellers violently rejected the higher prices. When we see this, we cancel our buy orders and wait for a better setup. If you're already in a trade and a massive reversal wick forms against your position, it's often a signal to exit early and protect your profits.
Watch Out: Never trade a breakout based on an intraday spike alone. Always wait for the candle to close above or below the key level. A wick through resistance that closes back below it is a classic trap, not a valid breakout signal.
What Are the Most Common Mistakes in Price Action Trading?
The most common mistakes in price action trading include forcing trades in choppy markets, ignoring the broader trend, and placing stop losses too close to entry points. Traders also frequently fail to wait for candle closes, jumping into positions prematurely based on temporary intraday price spikes.
We see beginners try to trade every single candlestick pattern they spot. A hammer candle in the middle of a random trading range means absolutely nothing. Context is everything in trading. You must combine price action reversal patterns with established support or resistance levels for the signal to be valid.
Another frequent error is poor position sizing. Because clean chart trading relies on visual levels, traders sometimes place their stop losses exactly on the support line. Market makers know this. They will briefly push the price slightly below support to trigger those stop losses before reversing the price higher. We teach our members to place stop losses with a buffer zone, typically a few cents or dollars below the actual technical level, depending on the asset's volatility.
When Is Price Action Alone Not Enough?
While we advocate for a clean chart, there are specific times when pure price action needs external context. Technical levels frequently break down during major economic announcements, central bank meetings, or corporate earnings reports.
We advise our members to step aside during high-volatility events. A beautiful technical setup can be destroyed in seconds by an unexpected earnings miss. For fundamental context, we often cross-reference our setups with broad market data from the SEC's EDGAR database to ensure we're not buying a stock right before a major, potentially negative corporate filing is released.
We also pay close attention to trading volume. While volume is technically an indicator, it simply measures market participation. A breakout on low volume is highly suspect. We want to see heavy volume confirming our breakout trades, proving that institutional money is driving the move.
By combining pure price analysis with basic volume confirmation and an awareness of the economic calendar, you can dramatically improve your win rate while keeping your charts entirely free of mathematical clutter.
Risk Warning: Price action trading, like all trading strategies, involves the risk of financial loss. No pattern or setup guarantees a profitable outcome. Always use proper position sizing, defined stop losses, and never risk more than you can afford to lose on any single trade.
Want expert trading insights delivered daily?
Join thousands of traders who rely on Traders Agency for market analysis and trade ideas.
Join Traders AgencyKey Takeaways
- Price action trading removes all lagging indicators from the chart, relying solely on candlestick patterns, trendlines, and support or resistance levels to read what buyers and sellers are doing in real time.
- Indicators are calculated from past price data, meaning they signal after a move has already begun. Reading raw price structure lets you react to what is happening now, not what already happened.
- Volume confirmation is one exception worth keeping: a breakout accompanied by rising volume signals institutional participation, which meaningfully improves the reliability of the setup.
- False breakouts are a known risk in this approach. The article covers specific techniques for identifying and handling whipsaws so you are not stopped out by routine market noise.
- Risk management remains non-negotiable regardless of setup quality. No candlestick pattern or support level guarantees a profitable outcome, and position sizing with defined stop losses is required on every trade.
DISCLAIMER: Traders Agency does not offer financial advice. The information provided is for educational purposes only and should not be considered financial advice. Traders Agency is not responsible for any financial losses or consequences resulting from the use of the information provided. Trading carries inherent risks and may not be suitable for all individuals. You are advised to conduct your own research and seek personalized advice before making any investment decisions, recognizing the potential risks and rewards involved.
See more from Traders Agency on Google
Make us a preferred source and our market analysis will appear more prominently in your Google Search, Top Stories, and AI results.
Add to Preferred Sources