
You're looking at a popular stock and the price action looks great. Revenue growth is impressive. But how much debt is the company carrying behind the scenes? Many new traders ignore the balance sheet entirely, focusing only on profits while overlooking the loans required to generate those profits. The debt-to-equity ratio is one of the most important fundamental analysis metrics we teach, and by the end of this guide, you'll know exactly how to calculate it, interpret it, and use it to spot hidden financial risk before it destroys a stock's value.
What Is the Debt-to-Equity Ratio?
Bottom Line: The debt-to-equity ratio gives traders a fast read on how much financial risk is hiding behind a company's revenue numbers. The goal is not to avoid all debt, but to identify management teams using debt to build new revenue rather than prop up a struggling business. Check the balance sheet before you trade, and always confirm the company earns enough operating income to cover what it owes.
The debt-to-equity ratio is a financial metric that measures how much debt a company uses to run its business compared to the value owned by shareholders. You calculate it by dividing total liabilities by total shareholder equity. This single number tells you whether a company relies too heavily on borrowed money.
Key Concept: The debt-to-equity ratio formula is simple: Total Liabilities ÷ Shareholders' Equity = D/E Ratio. You can find both numbers on any company's balance sheet in its official SEC filings.
To find these numbers yourself, pull up a company's balance sheet from the SEC's EDGAR database or any major brokerage platform.
Total liabilities include everything the company owes to outside parties. This covers short-term obligations like accounts payable and short-term loans, as well as long-term obligations like corporate bonds and multi-year bank loans.
Shareholders' equity represents the true net worth of the company. If the business sold all its assets and paid off all its debts today, the remaining cash is the equity. It includes money raised from issuing shares and all the retained earnings the company has saved over the years.
Understanding this relationship is a foundational skill for any trader. When a company funds its growth through debt, it takes on fixed interest payments. Those payments must be made regardless of how well the business is performing. If sales drop, those fixed payments become a heavy burden.
What Does a 1.5 Debt-to-Equity Ratio Mean?
A 1.5 debt-to-equity ratio means that for every $1 of equity owned by shareholders, the company owes $1.50 to creditors. The company is using $1.50 of debt to finance its operations for every dollar of its own money. That indicates a moderate level of borrowing.
We'll walk through a concrete debt-to-equity ratio example so you can see how this works in practice. Imagine you're evaluating a retail company named Company A. You check their latest quarterly earnings report and review the balance sheet.
| Balance Sheet Item | Value |
|---|---|
| Total Liabilities | $150 million |
| Shareholders' Equity | $100 million |
| Debt-to-Equity Ratio | 1.5 ($150M ÷ $100M) |
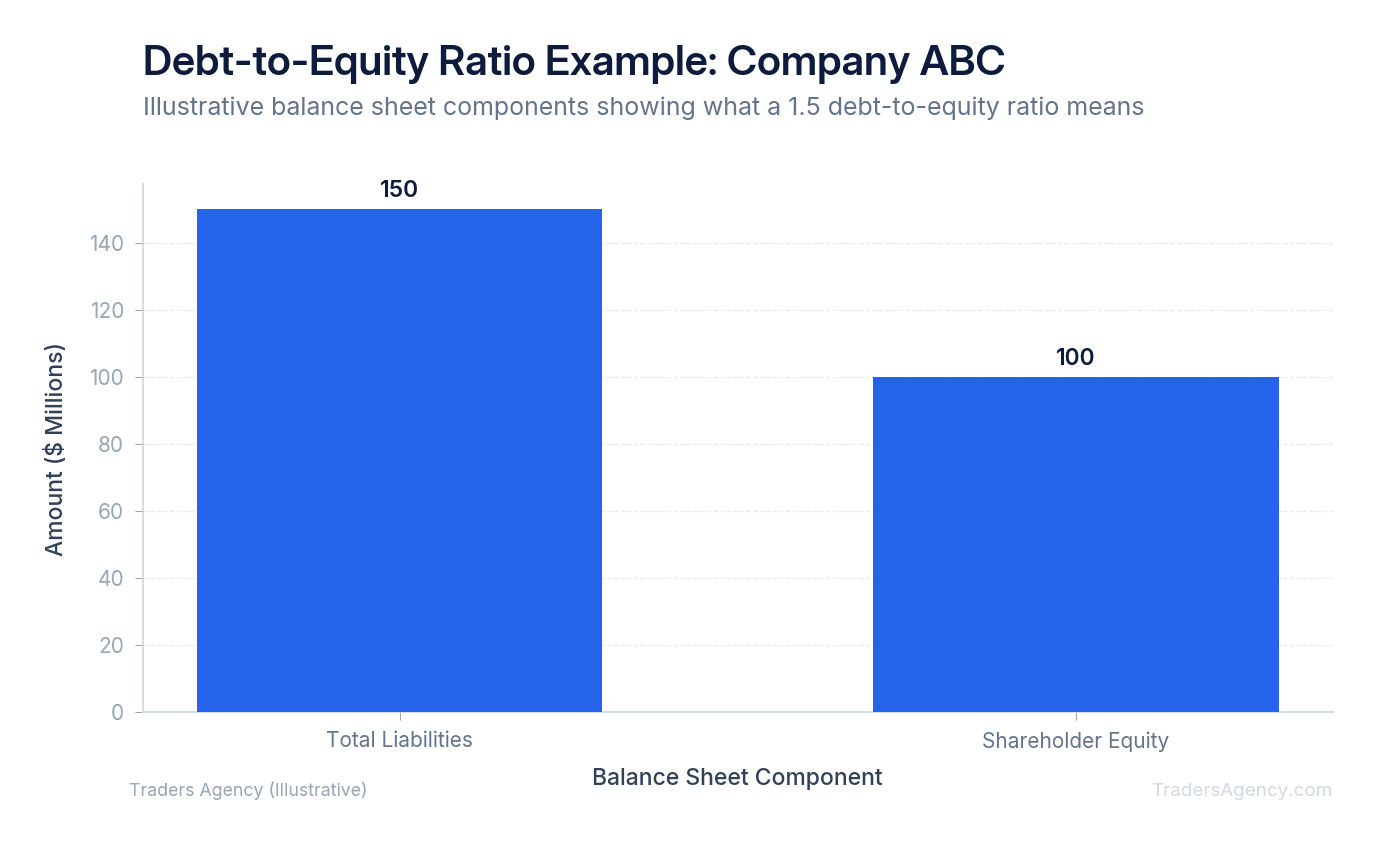
When you divide $150 million by $100 million, you get 1.5. This means the creditors actually have a larger financial claim on the company's assets than the owners do.
We teach our members that this is not automatically a bad thing. Many companies use debt to grow faster than they could by using only their own cash. Borrowing money to build a new factory can generate massive returns if that factory produces high-margin goods. The key is knowing whether the company can comfortably afford the debt payments.
What Is a Good Debt-to-Equity Ratio?
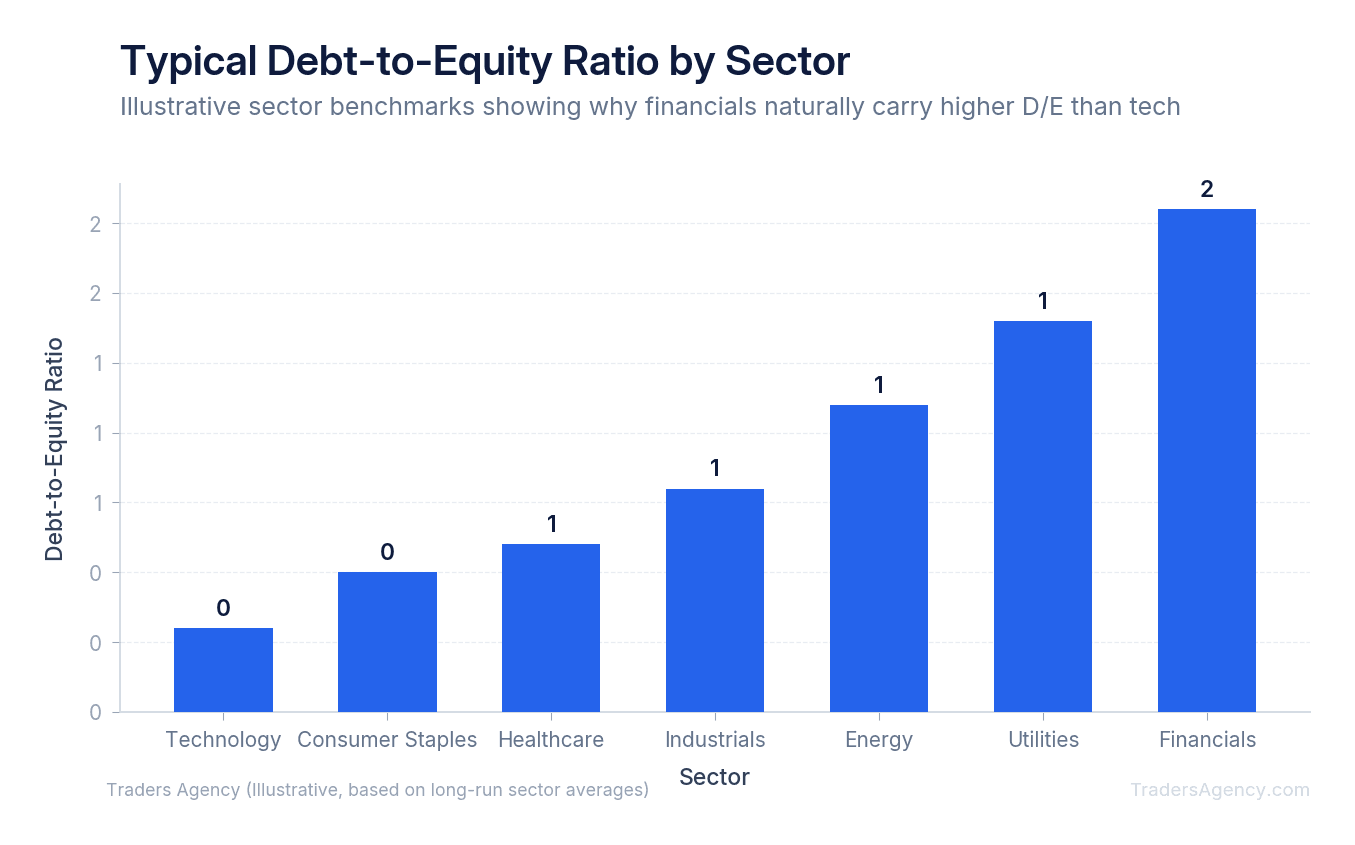
A good debt-to-equity ratio depends entirely on the industry. For technology companies, a good ratio is typically under 0.5 because they require less physical infrastructure. For capital-intensive industries like financials or utilities, a good ratio can safely range between 1.5 and 2.0.
You cannot compare a software company to a major bank. Banks naturally carry higher debt because they borrow money from depositors to lend out to customers. If you see a bank with a ratio of 1.8, that might be perfectly healthy. If you see a software company with that same ratio, it's a massive red flag.
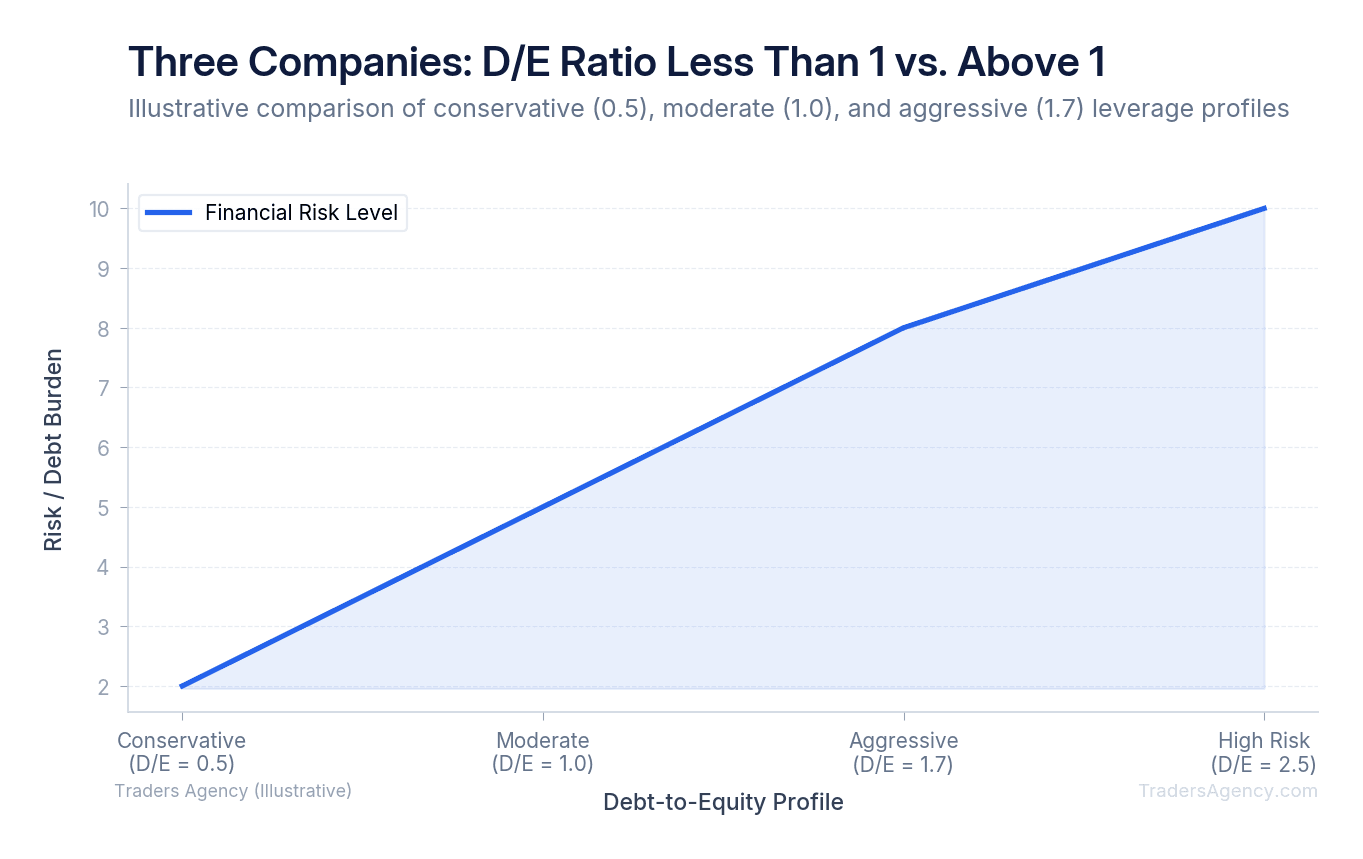
When evaluating high versus low debt scenarios, we prefer to compare a stock directly to its closest competitors. If Stock X has a ratio of 1.2 and the industry average is 0.8, Stock X carries more risk relative to its peers.
Higher debt means higher interest payments. In a rising interest rate environment, companies with high debt loads often struggle to maintain their profit margins. When their old loans expire, they have to refinance at much higher rates. This directly eats into the profits that belong to shareholders.
Want expert trading insights delivered daily?
Join thousands of traders who rely on Traders Agency for market analysis and trade ideas.
Join Traders AgencyIs a Debt-to-Equity Ratio of 0.5 Good?
Yes. A debt-to-equity ratio of 0.5 is generally considered very good and conservative. This means the company only has 50 cents of debt for every dollar of equity. A ratio this low indicates strong financial stability and minimal risk of bankruptcy during economic downturns.
Seeing a debt-to-equity ratio less than 1 tells you that the company is funded mostly by its owners rather than outside creditors. Sometimes you'll see this expressed as a debt-to-equity percentage. In this case, a 0.5 ratio equals 50 percent, meaning total debt is exactly half the size of total equity.
Key Concept: A D/E ratio below 1.0 means the company has more equity than debt. A ratio above 1.0 means creditors have a larger claim on the company's assets than shareholders do.
We always look for these conservative ratios when building long-term portfolios. Companies with low debt have more flexibility to survive recessions. They don't have to worry about making massive monthly loan payments when their sales temporarily drop.
These companies also have the freedom to buy back their own stock or pay dividends. When management isn't forced to send all their cash to the bank, they can return that cash to you as a shareholder.
Where Can You Find Debt-to-Equity Ratio Data?
You can find debt-to-equity ratio data on free stock screeners, financial news websites, or by calculating it yourself using the company's balance sheet from SEC filings on EDGAR. To use it effectively, always pair it with other metrics like the interest coverage ratio to assess overall financial health.
Our team recommends pulling the raw data directly from SEC filings or using standard financial tools on major brokerage platforms. Many free stock screeners allow you to filter thousands of companies by their debt levels. We teach our students to set a maximum filter of 1.5 when screening for conservative dividend stocks. This instantly removes the most heavily indebted companies from your watch list.
Here are the specific steps we follow to evaluate a stock's debt profile:
- Check the Industry Average: First, identify the sector. Find the average ratio for that specific industry to establish a baseline. A ratio of 2.0 is normal for a utility company but dangerous for a retail store.
- Calculate the Ratio: Divide the total liabilities by the total equity. Compare this to the debt-to-asset ratio, which measures the percentage of total assets financed by creditors. Using both metrics gives you a clearer picture of the balance sheet.
- Check the Interest Coverage Ratio: The debt-to-equity ratio tells you how much debt exists, but the interest coverage ratio tells you if the company can actually afford the payments. You calculate this by dividing operating income by interest expenses.
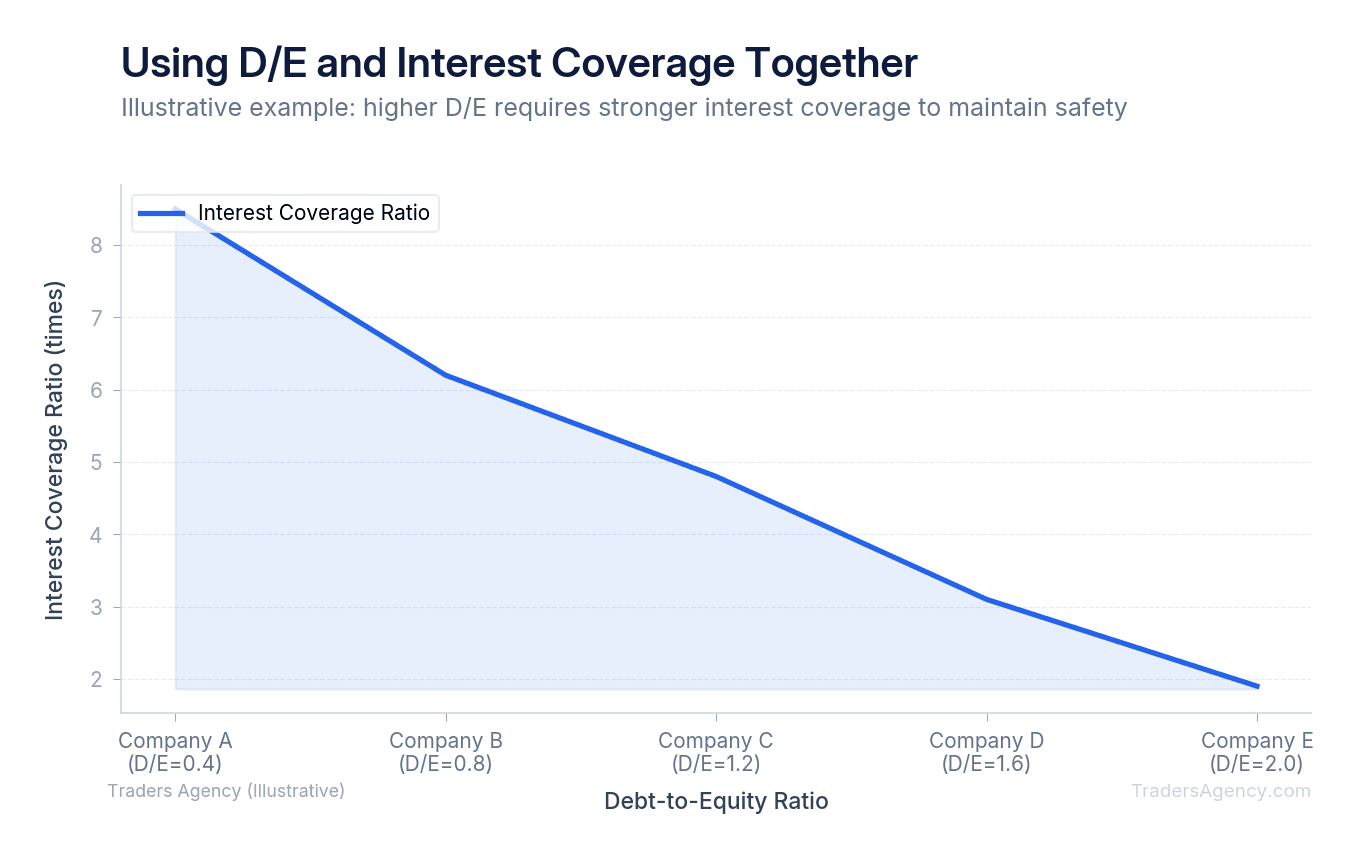
If a company has a high debt load but generates massive amounts of cash flow, they can easily cover their interest payments. If they have high debt and low cash flow, you should avoid the stock completely.
How Does Debt Impact Stock Prices During a Market Sell-Off?
During market sell-offs, companies with high debt-to-equity ratios typically see their stock prices fall much faster than companies with low debt. Investors panic because high debt increases the risk of bankruptcy when revenues decline during an economic recession.
When the broader stock market begins to trend downward, fear takes over. Institutional investors immediately look to reduce their risk exposure. The first stocks they sell are usually the ones with the weakest balance sheets.
If a company has a debt-to-equity ratio of 3.0, it means they owe three times more than their equity is worth. If a recession hits and their sales drop by 20 percent, they still have to make the exact same debt payments. This often forces them to issue new shares to raise cash, which dilutes the value of your existing shares.
Conversely, companies with strong balance sheets often see their stock prices hold up better during a crash. They might even use their cash reserves to buy up struggling competitors at a discount. We always check the balance sheet to ensure our long-term holdings can survive a market panic.
What Are the Most Common Mistakes When Using the Debt-to-Equity Ratio?
The biggest mistake traders make is relying on the debt-to-equity ratio in isolation. You must manage risk by avoiding heavily indebted companies during periods of rising interest rates. Always use strict position sizing when trading stocks with ratios significantly above their industry average.
We prefer to keep our position sizes small when testing a trade on a heavily indebted company. If a stock has a ratio of 2.5 in a sector where the average is 1.0, the risk of a sudden price drop is high. Any bad news about earnings will cause investors to panic about the company's ability to pay its bills.
When trading stocks with high debt, you must use strict stop losses. A stop loss automatically sells your position if the stock drops to a certain price. We prefer to place our stop losses just below major support levels on the daily chart. If the stock breaks that support, the debt load might be scaring away institutional buyers, and you need to exit the trade.
Watch Out: These are the most common mistakes we see traders make with the debt-to-equity ratio. Avoid all of them.
- Ignoring the sector: Never compare a technology stock to a financial stock using this metric. Industry context is everything.
- Forgetting about interest rates: High debt is much more dangerous when the Federal Reserve is raising rates.
- Assuming zero debt is perfect: Companies with zero debt might be missing out on opportunities to expand and grow their market share.
- Skipping the cash flow check: Always verify that the company makes enough operating income to service their debt.
The goal is to find management teams that use debt responsibly to generate higher returns for shareholders. You want to see debt used to build new revenue streams, not just to keep a dying business afloat. By checking the balance sheet before you trade, you protect your capital from hidden disasters.
Want expert trading insights delivered daily?
Join thousands of traders who rely on Traders Agency for market analysis and trade ideas.
Join Traders AgencyKey Takeaways
- The debt-to-equity ratio is calculated by dividing total liabilities by total shareholders' equity. Both numbers come directly from the company's balance sheet in SEC filings.
- A high D/E ratio becomes significantly more dangerous when the Federal Reserve is raising interest rates, because borrowing costs increase and debt servicing eats into profits.
- Zero debt is not automatically a good sign. Companies carrying no debt may be passing up opportunities to expand and grow market share.
- Always pair the D/E ratio with an operating income check. A company needs to generate enough cash flow to actually service its debt, not just carry it.
- D/E ratio benchmarks vary by sector. Comparing a utility company's ratio to a tech company's ratio without that context will lead to the wrong conclusions.
DISCLAIMER: Traders Agency does not offer financial advice. The information provided is for educational purposes only and should not be considered financial advice. Traders Agency is not responsible for any financial losses or consequences resulting from the use of the information provided. Trading carries inherent risks and may not be suitable for all individuals. You are advised to conduct your own research and seek personalized advice before making any investment decisions, recognizing the potential risks and rewards involved.
See more from Traders Agency on Google
Make us a preferred source and our market analysis will appear more prominently in your Google Search, Top Stories, and AI results.
Add to Preferred Sources