
You've probably watched a stock gap up or down on seemingly no news and wondered what you missed. More often than not, the clues were hiding in plain sight within the options market. Options chain analysis is one of the most powerful tools we teach our members for reading institutional sentiment before a move happens. In this guide, we'll walk you through exactly how to read the options chain, spot directional bias, interpret open interest versus volume, and apply these signals to your own trading routine, complete with specific numbers and risk management rules.
What Is Options Chain Analysis and Why Does It Matter?
Bottom Line: Options chain analysis gives traders a way to read institutional positioning before a move plays out, using metrics like open interest, volume, and implied volatility skew as directional clues. The edge comes from combining those signals with price action context and strict position sizing rules, not from using options data in isolation. Master the footprint big players leave behind, and you stop reacting to moves after the fact.
Options chain analysis is the process of evaluating options market data to determine the underlying sentiment and potential future price movement of an asset. By examining metrics like volume, open interest, and implied volatility across different strike prices, you can identify where institutional money is flowing.
Our team relies on this data to look beyond the basic price chart. Stock prices tell you what has already happened, but options data can provide clues about what major market participants expect to happen next. Large hedge funds and institutional players cannot hide their massive orders. When they take a position, they leave a footprint in the options chain.
Key Concept: Options chain analysis reads the "smart money" footprint. Stock prices show you the past. The options chain shows you what big players are betting on for the future.
How Is the Options Chain Organized?
The options chain is organized as a structured matrix displaying all available options contracts for a specific underlying asset. Calls are traditionally listed on the left side, puts on the right side, and strike prices run down the middle column. Expiration dates separate the data into distinct timeframes.
When you open an options chain on your broker platform, the sheer amount of data can look overwhelming. However, this standardized format (established by the CBOE) allows you to quickly compare premiums and liquidity across different strikes. We teach our members to focus on the at-the-money (ATM) strikes first, as these provide the baseline for current market expectations.
From that center point, you can scan up or down to see where the heavy volume is concentrated. The further you move away from the current stock price, the cheaper the options become. These are your out-of-the-money (OTM) contracts. Understanding this layout is the first step in identifying where the smart money is placing its bets.
How Do You Read an Options Chain for Directional Bias?
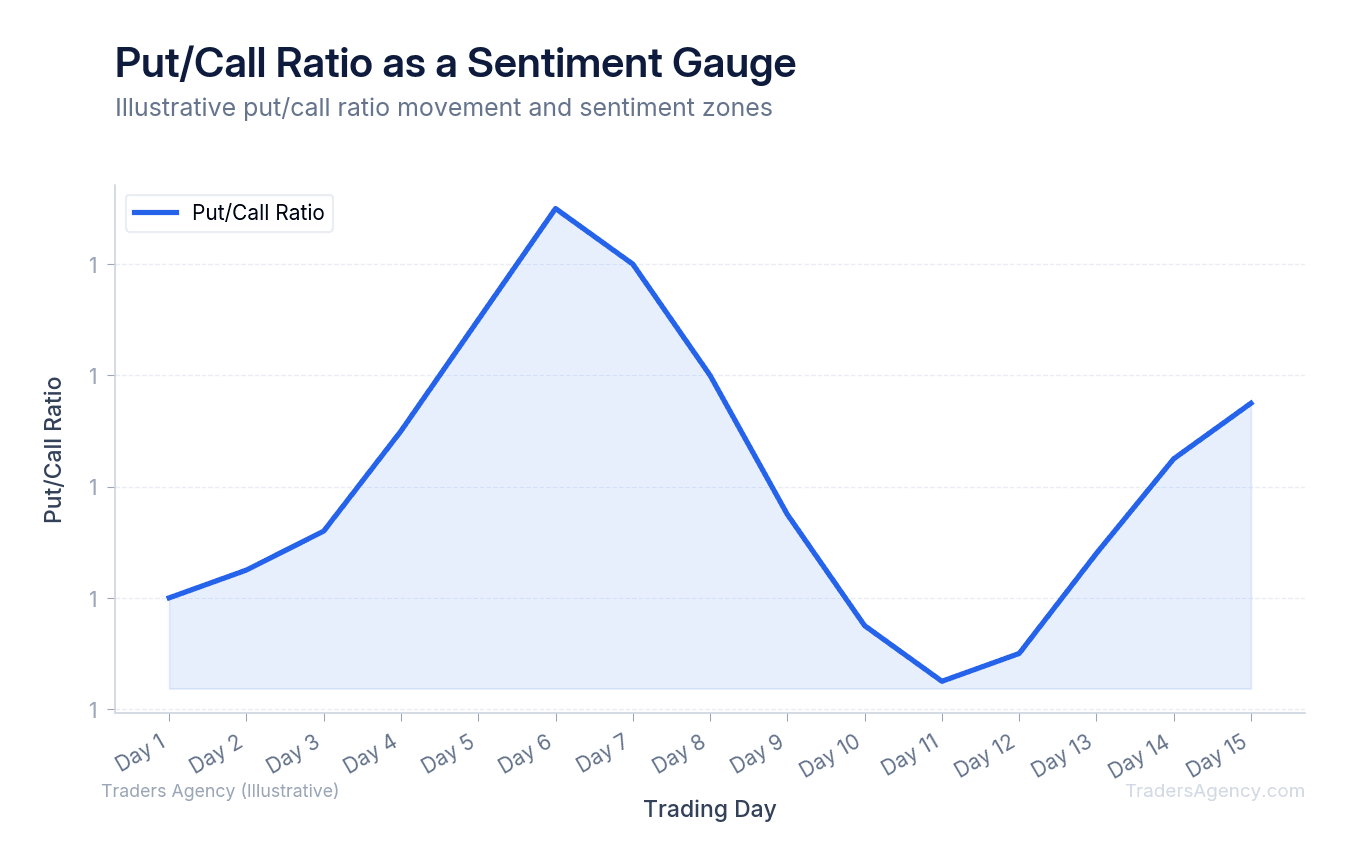
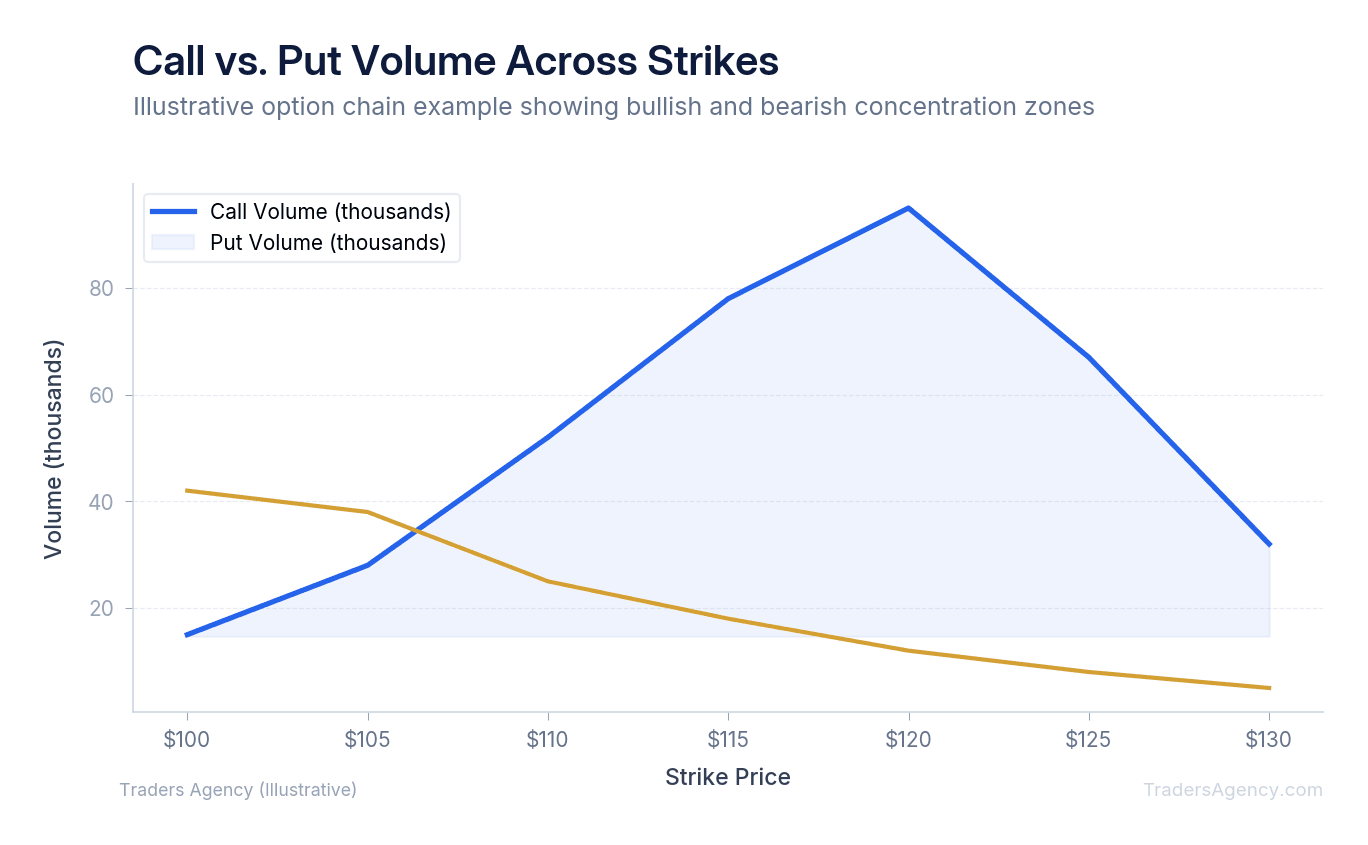
You read an options chain for directional bias by comparing call and put activity to determine if market participants expect the underlying stock to rise or fall. Heavy volume and rising premiums in out-of-the-money calls suggest bullish sentiment. Aggressive buying of out-of-the-money puts indicates bearish expectations.
Here's a specific options chain analysis example to illustrate this concept. Imagine stock XYZ is currently trading at $150 per share. You check the options chain for the expiration date three weeks out. You notice the $160 calls have a volume of 15,000 contracts, while the $140 puts only show 2,000 contracts traded. This massive disparity tells us that institutional traders are aggressively betting on an upward move.
We prefer to look for clusters of activity rather than isolated trades. If the $155, $160, and $165 calls all show elevated volume compared to their historical averages, that is a strong bullish signal.
| Parameter | Value |
|---|---|
| Stock Price | XYZ at $150 |
| Contract Purchased | $160 call, $2.00 premium |
| Cost Per Contract | $200 (100 shares x $2.00) |
| Breakeven at Expiration | $162 ($160 strike + $2.00 premium) |
| Maximum Loss | $200 (premium paid) |
| Maximum Gain | Theoretically unlimited |
When we see thousands of contracts purchased at these levels, we know major players are confident the stock will surge past $162.
How Do You Spot Unusual Activity Using Open Interest and Volume?
You spot unusual activity by comparing the daily trading volume of a specific contract to its existing open interest. When today's volume significantly exceeds the total open interest for that strike price, it strongly suggests new institutional positions are being opened rather than existing trades being closed.
This distinction is essential for any options chain analysis strategy. Volume tells you how many contracts traded today. Open interest (OI) tells you how many contracts remain open and held overnight. If a contract has an OI of 500, but today's volume spikes to 5,000, that strongly suggests a large number of brand-new contracts are being created, since the existing open positions could only account for a fraction of that activity.
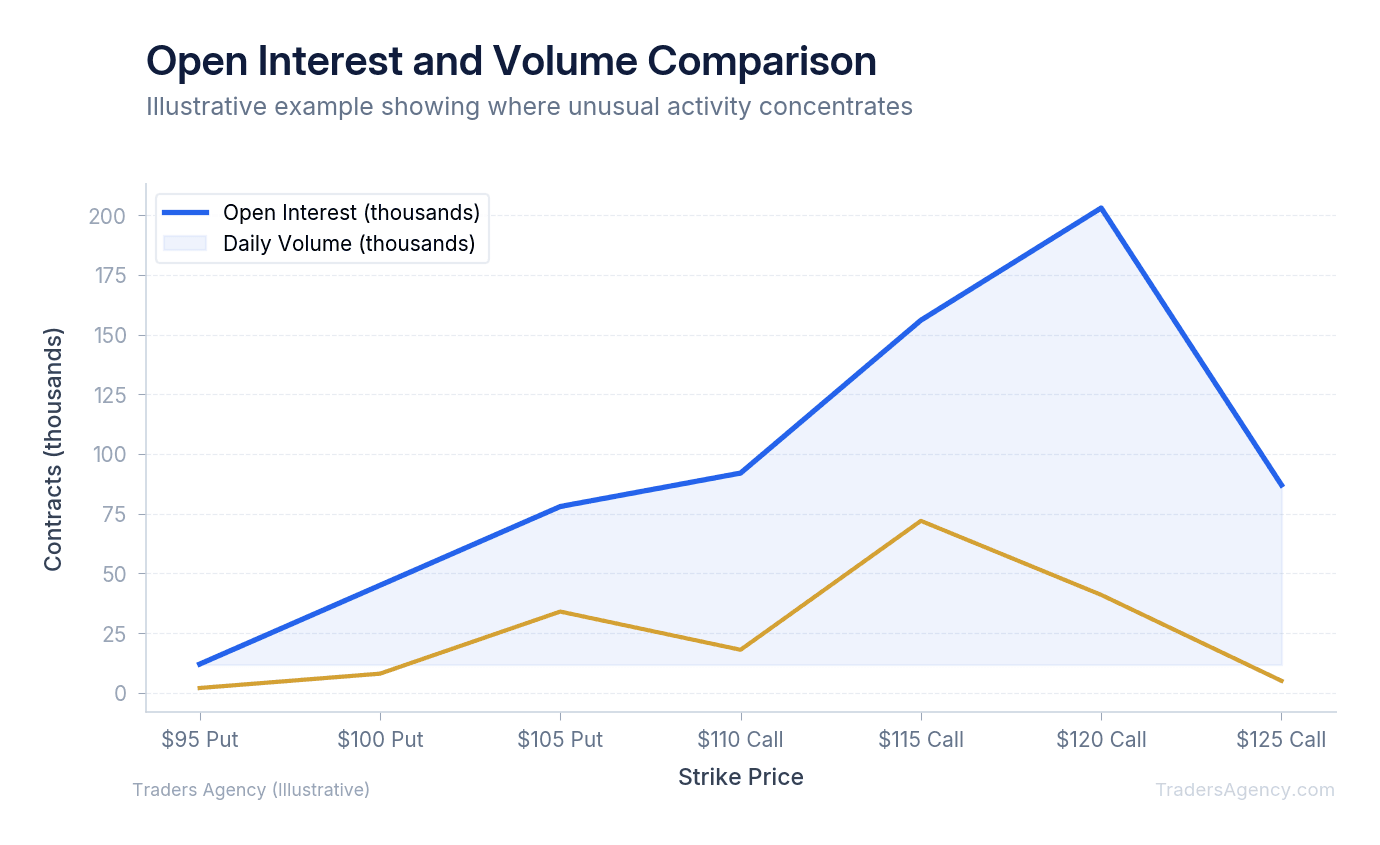
We look for this specific setup when hunting for institutional footprints. For example, if Apple (AAPL) is trading at $175, and we see 20,000 contracts of volume on the $185 calls expiring next Friday with an existing OI of only 1,500, someone is taking a massive, directional bet. They are committing serious capital to the idea that Apple will rally sharply in the coming days.
Conversely, if the volume is 5,000 but the existing open interest is 20,000, the activity might just be traders closing out their existing positions. High volume alone is not enough. When volume significantly exceeds open interest, it strongly suggests fresh money is entering the market.
Key Concept: The golden rule for spotting institutional activity: today's volume must significantly exceed the existing open interest. If volume is 3x or more than OI, fresh money is likely entering the trade.
What Are the Core Sentiment Signals in an Options Chain?
To get a complete picture of market sentiment, our team evaluates three specific metrics together. Relying on just one data point can lead to false signals, so we combine them into a unified framework.
1. The Put/Call Ratio
The put/call ratio compares the total number of traded puts to traded calls. A ratio below 0.7 generally indicates bullish sentiment, while a ratio above 1.0 suggests fear or bearishness. When the entire market has a put/call ratio of 1.5, it usually means retail traders are panicking. We often use this as a contrarian signal to look for buying opportunities.
2. Max Pain
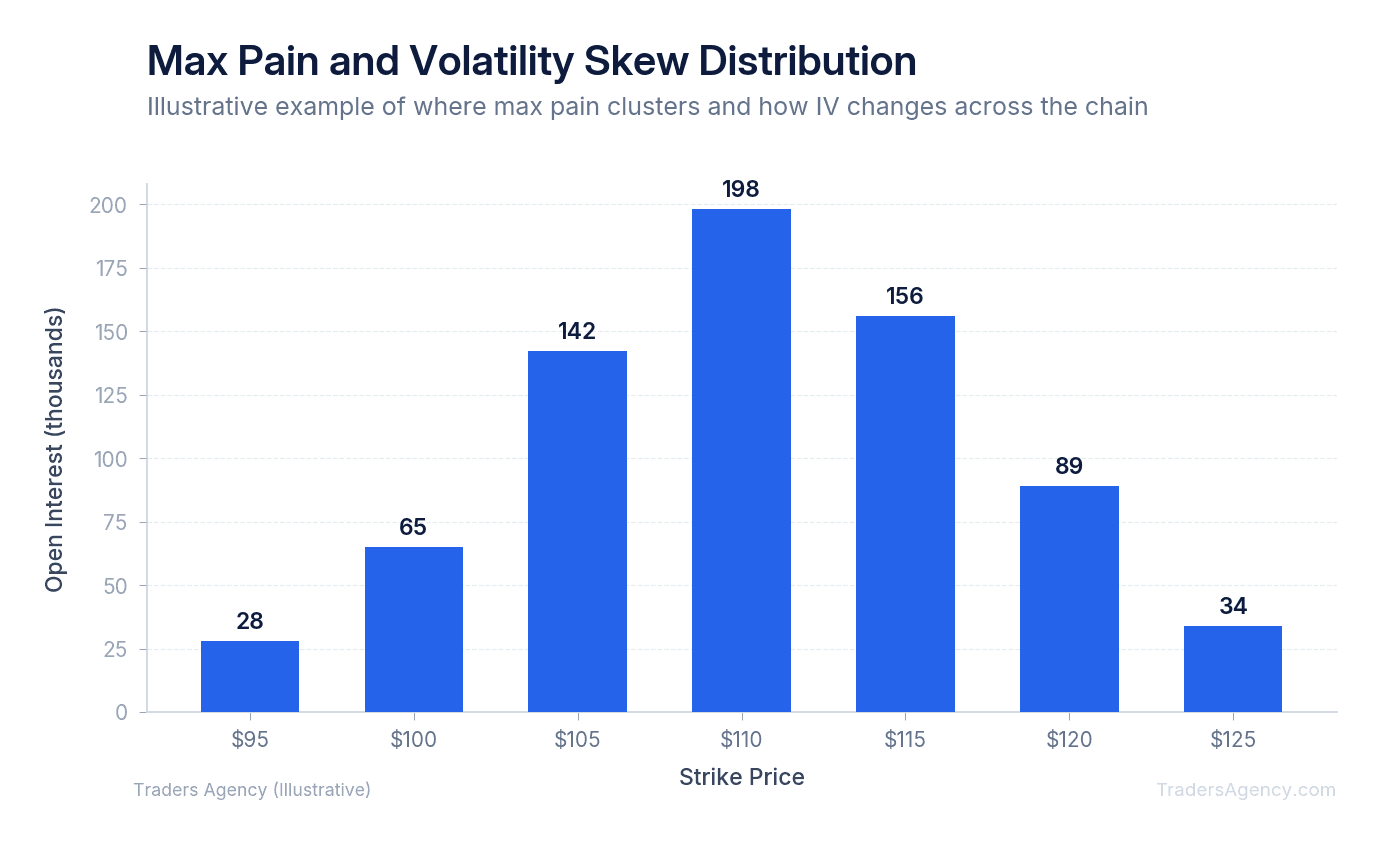
Max pain is the strike price where the total dollar value of outstanding options (both puts and calls) would suffer the greatest loss at expiration. In other words, it is the price at which option writers pay out the least. Option writers (including market makers) benefit when options expire worthless. As expiration approaches, hedging and position-unwinding activity can create a gravitational pull toward the max pain level. If XYZ is trading at $100 but the max pain level is $110, there is a statistical tendency for the stock to drift toward $110 as Friday approaches, though this effect is not guaranteed and works best in liquid names.
3. Volatility Skew
Volatility skew measures the difference in implied volatility between out-of-the-money puts and out-of-the-money calls. If the SPY is trading at $500, a $480 put might cost $5.00, while a $520 call might only cost $2.00. This pricing disparity shows the market is willing to pay a massive premium for downside protection. When skew gets extreme, it warns us that institutional players are bracing for a drop.
Want expert trading insights delivered daily?
Join thousands of traders who rely on Traders Agency for market analysis and trade ideas.
Join Traders AgencyHow Do You Read an Options Chain on Your Trading Platform?
Whether you use Thinkorswim, Unusual Whales, or OptionStrat, the core mechanics remain the same. You need to customize your column layouts to display volume, open interest, and implied volatility side-by-side. By filtering for specific expiration dates and sorting by volume, you can quickly identify where the largest institutional trades are concentrated.
Here is the exact setup we teach our members to use when scanning for opportunities.
Step-by-Step Options Chain Analysis Strategy
- Filter the expiration dates: Select an expiration cycle that matches your intended trade duration. We typically look 30 to 45 days out for swing trades. This provides enough time for the institutional thesis to play out.
- Customize your columns: Remove unnecessary data like bid/ask size. Add Volume, Open Interest, Implied Volatility, and Delta to your main view.
- Scan for volume anomalies: Scroll through the strikes and look for volume that is at least 3x higher than the existing open interest. This is your primary signal.
- Check the Delta: We prefer to see unusual activity in the 0.20 to 0.30 Delta range. A 0.30 Delta is sometimes loosely interpreted as roughly a 30% probability of expiring in the money, though this is an approximation rather than a precise probability. When institutions buy here, they are expecting a significant, outsized move.
- Verify the trade type: Check the time and sales data to confirm if the large volume was executed at or near the ask price or the bid price. Trades executed at or near the ask indicate aggressive buying. Trades at or near the bid suggest selling or premium collection.
When Options Chain Analysis Works (and When It Doesn't)
Options chain analysis is highly effective during periods of market consolidation or ahead of scheduled binary events like earnings reports. When a stock is trading sideways, unusual options activity often precedes the actual breakout. By tracking the institutional money flow, you can position yourself before the retail crowd catches on. We love using this data to confirm technical chart patterns. If a stock is forming a bull flag and we see massive call buying, our confidence in the trade increases dramatically.
However, this strategy has strict limitations. We never rely on options data during low-liquidity environments or for penny stocks. If a stock trades less than 1 million shares a day, its options chain will likely be too thin to provide reliable signals. A single retail trader buying 50 contracts could skew the data, creating a false positive. You must stick to highly liquid, large-cap stocks or major ETFs for this data to be meaningful.
Additionally, be careful with dividend-paying stocks. Heavy call volume right before an ex-dividend date is often related to dividend capture strategies, not a directional bet on the stock price. The SEC's educational resources on options trading warn about misinterpreting volume around corporate actions. Always check the financial calendar before assuming an options print is a directional signal.
Watch Out: Heavy call volume near an ex-dividend date is often a dividend capture play, not a bullish directional bet. Always check the corporate events calendar before acting on unusual options activity.
What Are the Most Common Mistakes When Analyzing an Options Chain?
The biggest mistake we see traders make is confusing a hedge with a directional bet. Just because you see massive put buying on the SPY does not mean the market is about to crash. A large fund might simply be protecting a multi-billion dollar long portfolio. They buy puts as insurance, not because they actively want the market to fall. This is why we prefer to look for unusual activity on individual stocks rather than broad indices.
Another frequent error is ignoring the bid-ask spread. If you spot a perfect setup with massive volume, but the contract has a $0.10 bid and a $0.50 ask, that illiquidity makes the trade dangerous. You give up too much edge just entering the position. We only trade options that have tight bid-ask spreads, typically no more than 10% of the option's total premium.
Finally, never trade options data in isolation. An options chain might look incredibly bullish, but if the stock is trading directly under major technical resistance, the trade is still high risk. We always combine our options data with basic price action and volume analysis on the underlying stock.
Risk Management Rule: We teach our members to risk no more than 1% to 2% of their total account equity on any single options trade. If you have a $10,000 account, your maximum risk per trade should be $200. If the contracts cost $2.00 each, you can only afford to buy one contract. Sticking to these mathematical rules will keep you in the game long enough to master the options chain.
Want expert trading insights delivered daily?
Join thousands of traders who rely on Traders Agency for market analysis and trade ideas.
Join Traders AgencyKey Takeaways
- Options volume and open interest reveal where institutional money is flowing before a price move happens, giving traders a forward-looking edge that price charts alone cannot provide.
- Large hedge funds and institutions cannot hide their positions. Their orders leave a measurable footprint in the options chain through unusual volume spikes and open interest clusters at specific strike prices.
- Risk no more than 1% to 2% of total account equity on any single options trade. On a $10,000 account, that means a maximum of $200 at risk per trade, which may limit you to a single contract.
- Options chain data works best when combined with price action and technical analysis. A bullish options signal loses its edge if the underlying stock is sitting directly under major resistance.
- Implied volatility across strike prices, the put/call ratio, and max pain levels are the three core sentiment signals to evaluate before entering a position based on options chain data.
DISCLAIMER: Traders Agency does not offer financial advice. The information provided is for educational purposes only and should not be considered financial advice. Traders Agency is not responsible for any financial losses or consequences resulting from the use of the information provided. Trading carries inherent risks and may not be suitable for all individuals. You are advised to conduct your own research and seek personalized advice before making any investment decisions, recognizing the potential risks and rewards involved.
See more from Traders Agency on Google
Make us a preferred source and our market analysis will appear more prominently in your Google Search, Top Stories, and AI results.
Add to Preferred Sources