
Bullish candlestick patterns are visual representations of price action that signal a potential upward reversal in the market. These technical formations show the open, high, low, and close prices over a specific timeframe, helping traders identify when buyers are taking control from sellers.
You've probably watched a stock drop for days, only to suddenly reverse and shoot higher. Many new traders feel like they're always guessing when these reversals will happen. Our team at Traders Agency teaches members how to spot these shifts before they happen by reading the story the chart is telling us.
Japanese rice traders developed this charting method centuries ago to track price momentum. Today, modern traders use these same principles to trade the stock market, forex, and futures. We'll walk you through exactly how to read these charts and trade them effectively. By the end of this guide, you'll know how to identify high-probability setups, confirm your entries, and manage your risk like a professional.
How Do You Read Candlestick Patterns in Trading?
Bottom Line: Candlestick patterns give traders a structured way to read the balance of power between buyers and sellers, but pattern recognition alone is not an edge. The real skill is combining these signals with confirmation tools and disciplined position sizing to keep losses small when the setup fails. Master the handful of patterns covered here before expanding your playbook.
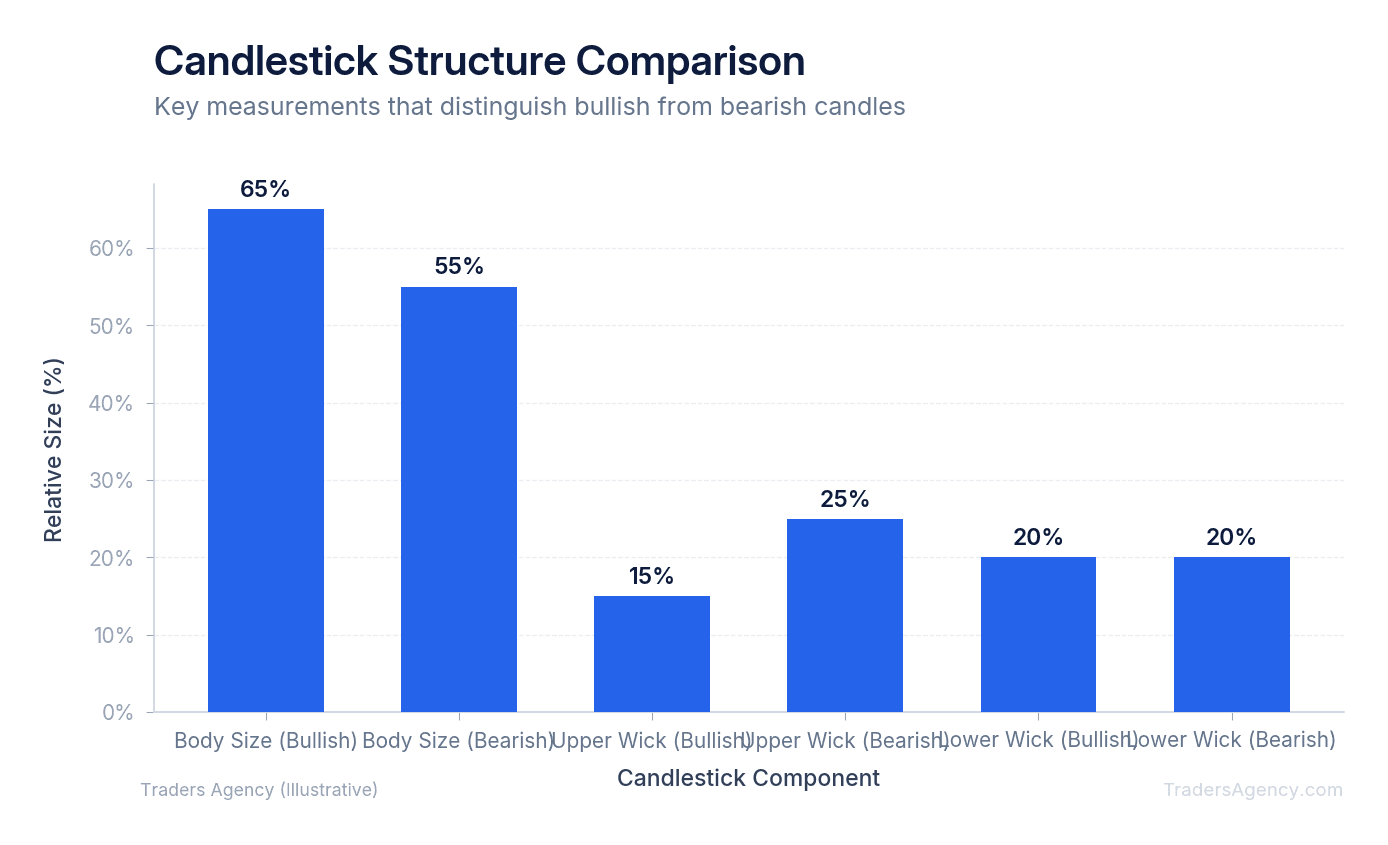
You read candlestick patterns by analyzing the relationship between the open, high, low, and close prices within a specific period. The thick body shows the difference between the open and close, while the thin wicks display the highest and lowest prices reached during that timeframe.
This visual data tells a clear story about the battle between buyers and sellers. A large green body means buyers dominated the session from the opening bell to the close. A long lower wick indicates sellers tried to push the price down, but buyers stepped in aggressively to reject those lower prices.
Conversely, a red body means the closing price was lower than the opening price. Sellers were in control. The size of the body reflects the strength of the momentum. A tiny body means neither side had much conviction, while a massive body shows strong directional pressure.
Key Concept: The body of a candlestick tells you who won the session (buyers or sellers), and the wicks tell you how hard the losing side fought before giving up control.
What Are Single-Candle Patterns Like the Doji, Hammer, and Shooting Star?
We prefer to start our analysis with single-candle formations because they offer immediate feedback on market sentiment. These patterns require only one trading period to form, making them easy to spot on a fast-moving chart.
1. The Hammer
The hammer candlestick pattern is one of our favorite bullish candlestick patterns. It forms at the bottom of a downtrend and signals a potential reversal. You'll see a small body near the top of the candle and a long lower wick that is at least twice the length of the body.
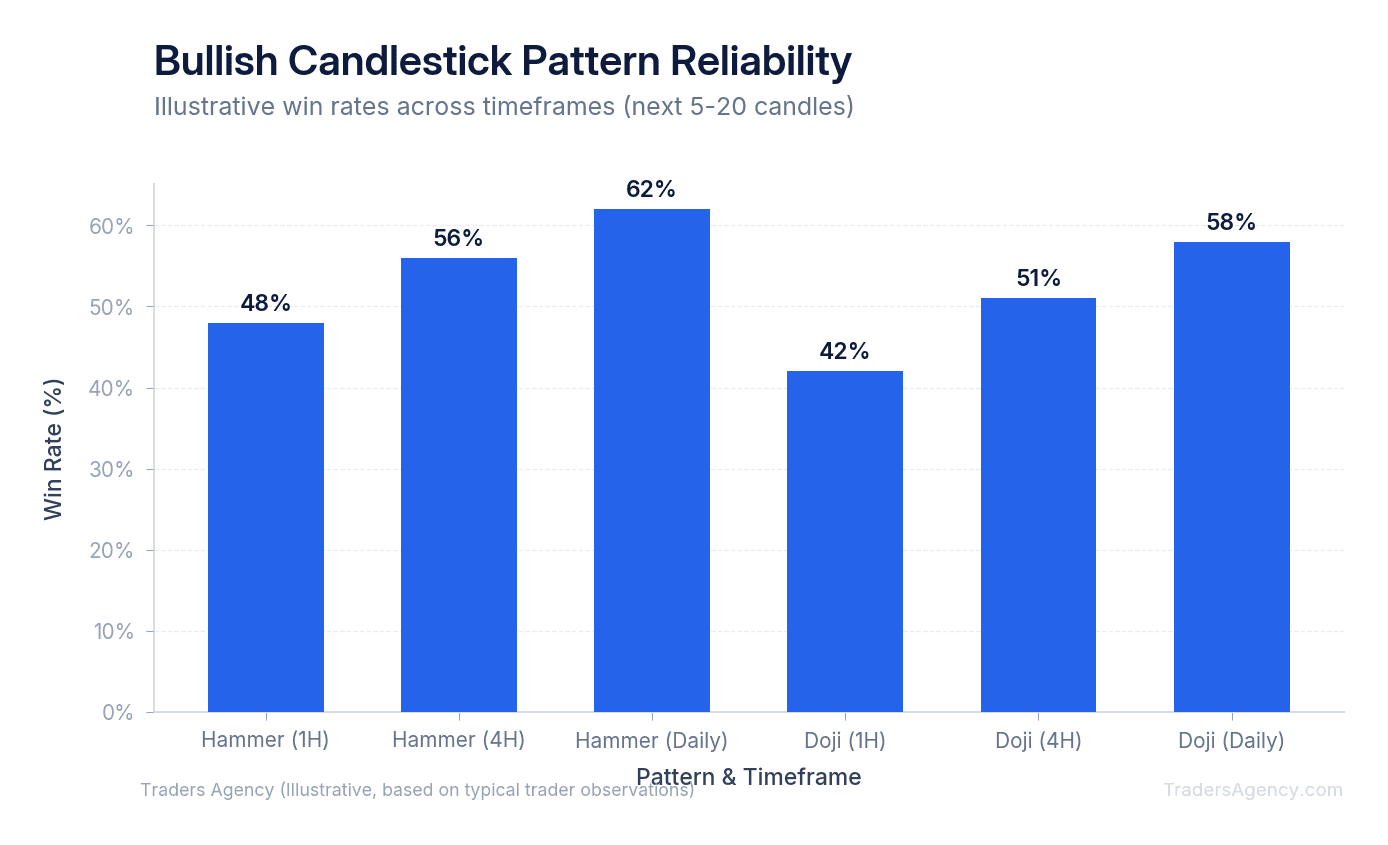
This specific shape shows that sellers pushed the price down significantly during the session, but buyers aggressively bought the dip to close the price near the high. We look for this formation on a daily chart near major support levels. If a stock like MSFT drops to a known support zone and prints a hammer, we prepare for a potential long entry.
2. The Doji
A Doji occurs when the open and close prices are virtually identical. It looks like a cross or a plus sign on your screen. The wicks can be long or short, but the lack of a real body is the defining feature.
This pattern represents absolute indecision in the market. Neither buyers nor sellers could gain the upper hand by the end of the session. When a Doji prints after a long, extended trend, we view it as a warning sign that the current trend is losing momentum.
3. The Shooting Star
The shooting star is a bearish reversal signal that appears at the top of an uptrend. It has a small body near the bottom of the candle and a long upper wick. It looks exactly like an upside-down hammer.
Buyers tried to push the price higher, but sellers overwhelmed them and forced the price back down by the close. This traps late buyers who bought at the top of the wick. If we see this on a 4-hour chart for a stock we own, we immediately start tightening our stop losses to protect our profits.
Multi-Candle Patterns: Engulfing, Morning Star, and Three White Soldiers
Single candles are great for quick reads, but multi-candle formations often provide stronger, more reliable signals. These patterns take two or three periods to develop, giving the market more time to confirm a shift in sentiment.
1. The Bullish Engulfing Pattern
The engulfing candlestick pattern requires two candles to complete. First, you see a smaller red candle during a downtrend. In the very next period, a large green candle completely "engulfs" the body of the previous red candle.
This is a powerful signal that buyers have completely overtaken the sellers. The larger the green candle, the stronger the signal. We frequently trade this setup when it aligns with an oversold reading on the Relative Strength Index (RSI), usually below the 30 level.
2. The Morning Star
The morning star pattern is a three-candle sequence that signals a major market bottom. It starts with a large red candle, followed by a small-bodied candle that gaps down, and finishes with a large green candle pushing back into the first candle's range.
Think of it like a car making a U-turn. The first candle is the car speeding in one direction, the second is the car slowing down to turn, and the third is the car accelerating in the opposite direction. The middle candle shows the exact moment the selling pressure dried up.
3. Three White Soldiers
This pattern consists of three consecutive long green candles. Each candle must open within the previous candle's body and close higher than the last. The wicks should be very short or non-existent.
It shows aggressive, sustained buying pressure over three full periods. We teach our members to use this as confirmation that a new uptrend has officially begun. When you see this pattern, short sellers are usually scrambling to cover their positions, which adds even more buying fuel to the fire.
Want expert trading insights delivered daily?
Join thousands of traders who rely on Traders Agency for market analysis and trade ideas.
Join Traders AgencyHow Do You Confirm a Candlestick Signal Before Trading It?
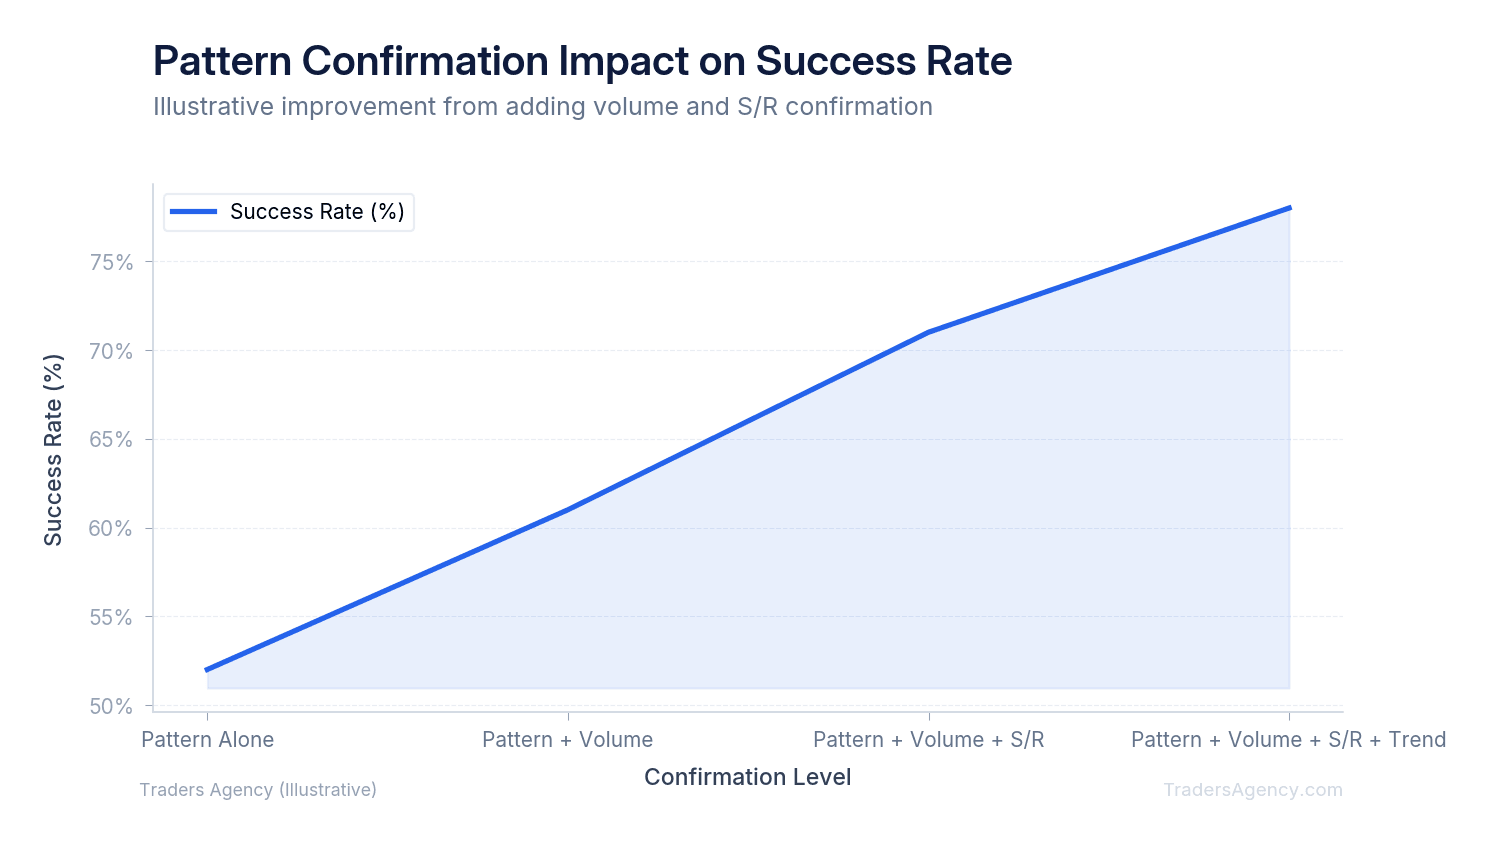
You confirm a candlestick signal by waiting for the next candle to close in the direction of your expected trade. We also require secondary evidence, such as high trading volume or a bounce off a major support level, before committing capital to any candlestick formation.
Trading a pattern in isolation is a fast way to lose money. The SEC's investor education resources emphasize that technical analysis requires looking at the broader market context rather than single data points. A hammer candle means nothing if it forms in the middle of nowhere on low volume.
We always pair our candlestick analysis with volume indicators. If a bullish engulfing pattern prints on volume that is 50% higher than the 20-day average, we pay close attention. High volume proves that institutional money is participating in the reversal, giving the move actual weight.
We also look for confluence with horizontal support and resistance lines. A morning star pattern bouncing directly off a $150 support level carries much more weight than the exact same pattern floating in the middle of a choppy trading range. We want to see multiple technical reasons to take the trade.
Key Concept: Never trade a candlestick pattern alone. Always look for confirmation through volume, support/resistance levels, or a secondary indicator like RSI. The more evidence stacking in your favor, the higher the probability of success.
How Do You Trade the Bullish Engulfing Pattern Step by Step?
Here's a specific, concrete example of how our team trades bullish candlestick patterns. Assume we're watching a tech stock, ticker symbol XYZ, currently trading near $100.
- Identify the Setup: Stock XYZ has been in a short-term downtrend for six days, dropping steadily from $115 to $100. The $100 level is a major psychological support zone where the stock previously bounced three months ago. On Tuesday, the stock closes as a standard red candle at $99.
- Execute the Trade: On Wednesday, XYZ opens at $98.50, dips slightly to test support, and then surges throughout the day to close at $103. This large green candle completely engulfs Tuesday's red body. Volume for Wednesday is double the normal average. We enter a long position near the close at $102.80. We place our hard stop loss exactly ten cents below the low of the engulfing candle at $98.40.
- Manage the Outcome: Our risk on this trade is $4.40 per share. We target a minimum reward of twice our risk, placing our initial profit target at $111.60. If the stock hits our target, we secure a solid profit and perhaps leave a small runner position open. If the pattern fails and the price drops to hit our stop loss, we exit immediately to protect our capital. We accept the small loss and move on to the next setup. We never hold and hope.
| Parameter | Value |
|---|---|
| Ticker | XYZ |
| Entry Price | $102.80 |
| Stop Loss | $98.40 (below engulfing candle low) |
| Risk Per Share | $4.40 |
| Profit Target (2:1 R/R) | $111.60 |
| Potential Reward Per Share | $8.80 |
Which Timeframes Work Best for Candlestick Pattern Trading?
The daily and 4-hour timeframes work best for candlestick pattern trading because they filter out intraday market noise. Longer timeframes require more buying or selling pressure to form a pattern, making the resulting signals significantly more reliable than those found on 1-minute or 5-minute charts.
Intermediate traders often make the mistake of hunting for patterns on very short timeframes. While you can technically spot a morning star on a 5-minute chart, the success rate drops dramatically. Algorithmic trading and random market fluctuations create constant false signals on these micro timeframes.
Our team recommends using the daily chart for your primary trend analysis. Once you spot a daily setup, you can drop down to a 1-hour chart to fine-tune your entry price. This multi-timeframe approach gives you the reliability of the daily chart with the precision of an intraday entry.
When Should You Avoid Using Candlestick Patterns?
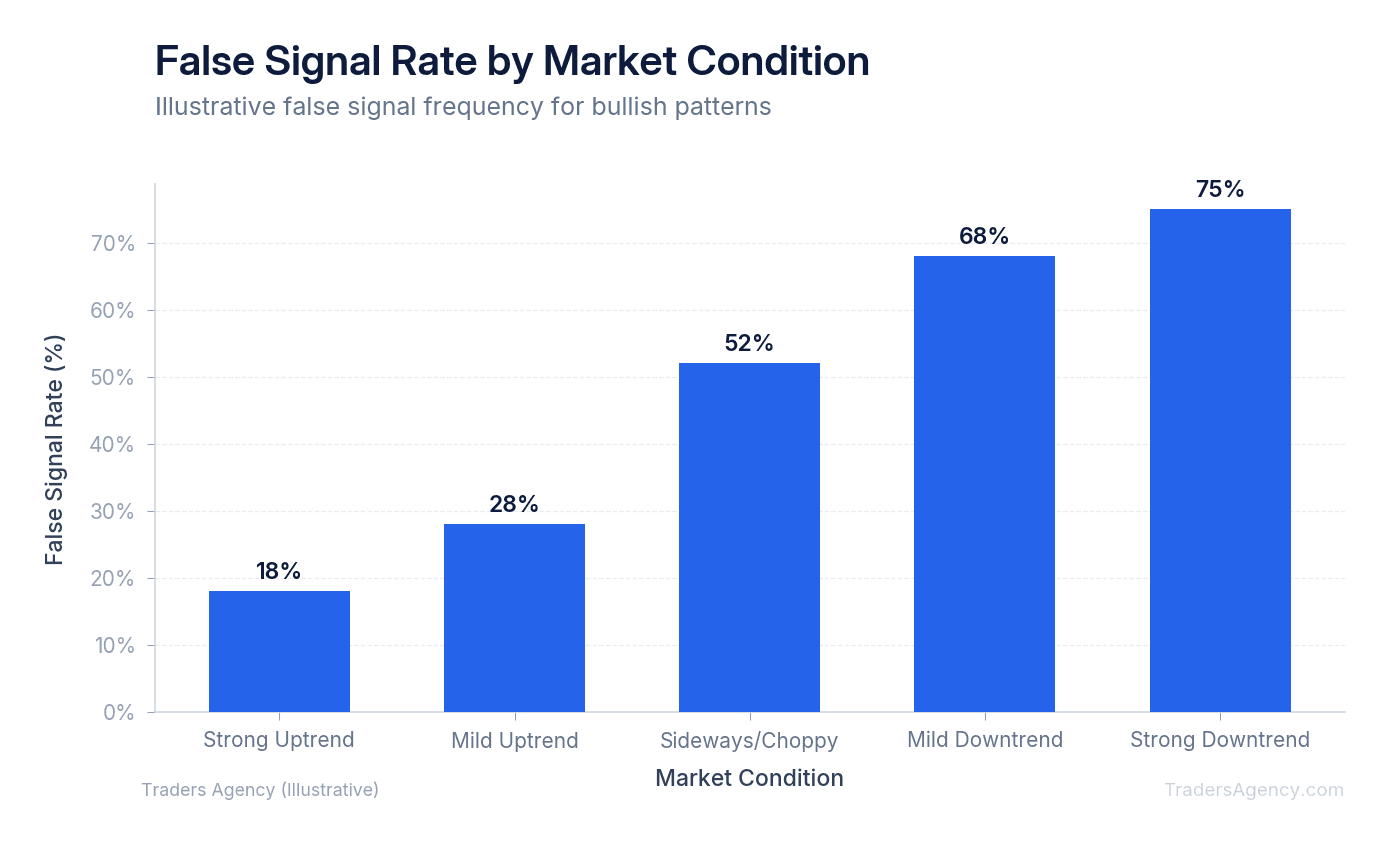
Knowing when to stay out of the market is just as important as knowing when to enter. Candlestick patterns are not magic. They fail frequently under the wrong conditions, and forcing trades in bad environments will drain your account.
Here are the scenarios where we actively avoid trading these patterns:
- During low liquidity: If a stock trades fewer than 500,000 shares per day, the candles will look choppy, broken, and unreliable. Stick to highly liquid assets.
- Right before earnings: A company's earnings report will override any technical pattern on the chart. We never hold short-term technical setups through major fundamental announcements.
- In tight consolidation: When a stock is trading sideways in a very narrow range, engulfing patterns and hammers will trigger constant false signals. Wait for a clear trend before looking for reversals.
Data from the Cboe (Chicago Board Options Exchange) shows that implied volatility spikes massively around earnings and economic data releases. This volatility can blow right through your technical stop losses, rendering the candlestick pattern completely useless. Always check the economic calendar before taking a trade based purely on a chart pattern.
Watch Out: Never trade a candlestick pattern through a scheduled earnings report or major economic data release. The fundamental event will overpower the technical signal, and your stop loss may get blown through by a gap open.
How Should You Manage Risk and Size Positions When Trading Candlestick Patterns?
Even the most reliable bullish candlestick patterns will fail sometimes. The market is unpredictable, and no setup boasts a 100% win rate. That's why strict risk management is essential for our team.
We teach our members to risk no more than 1% to 2% of their total account equity on any single trade. If you have a $10,000 account, your maximum loss on a failed hammer setup should be strictly capped between $100 and $200. This ensures that a string of losing trades will not blow up your account.
Always calculate your position size based on the distance between your entry price and your stop loss. Don't just buy a random number of shares because it feels right.
If your max risk is $100 and your stop loss is $2.00 below your entry, you can buy exactly 50 shares ($100 divided by $2.00). Let the chart and the math dictate your risk parameters. Once the trade moves in your favor, you can use a trailing stop to lock in profits while giving the position room to run.
| Account Size | Max Risk (2%) | Stop Distance | Position Size |
|---|---|---|---|
| $10,000 | $200 | $2.00 | 100 shares |
| $25,000 | $500 | $2.00 | 250 shares |
| $50,000 | $1,000 | $2.00 | 500 shares |
Risk Warning: No candlestick pattern guarantees a winning trade. Always define your maximum loss before entering a position, and never risk more than you can afford to lose. Consistent position sizing is what separates profitable traders from those who blow up their accounts.
Want expert trading insights delivered daily?
Join thousands of traders who rely on Traders Agency for market analysis and trade ideas.
Join Traders AgencyKey Takeaways
- Candlestick bodies show the open-to-close range, while wicks reveal the full high-low range for the period. A large green body means buyers controlled the session from open to close.
- Multi-candle patterns like the Morning Star and Three White Soldiers carry more confirmation weight than single-candle signals because they show sustained buying pressure across multiple sessions.
- The Bullish Engulfing pattern requires the second candle's body to fully engulf the first, signaling that buyers have completely overwhelmed the prior session's selling pressure.
- Position sizing should cap risk at 2% of account value per trade. On a $25,000 account with a $2.00 stop distance, that means 250 shares maximum.
- No candlestick pattern guarantees a winning trade. Confirmation from volume, support levels, or a second indicator is what separates high-probability setups from guesses.
DISCLAIMER: Traders Agency does not offer financial advice. The information provided is for educational purposes only and should not be considered financial advice. Traders Agency is not responsible for any financial losses or consequences resulting from the use of the information provided. Trading carries inherent risks and may not be suitable for all individuals. You are advised to conduct your own research and seek personalized advice before making any investment decisions, recognizing the potential risks and rewards involved.
See more from Traders Agency on Google
Make us a preferred source and our market analysis will appear more prominently in your Google Search, Top Stories, and AI results.
Add to Preferred Sources



