
You sit down to trade, open your platform, and stare at thousands of tickers. Finding the right setup feels like searching for a needle in a haystack. That's exactly why we build custom screeners for swing trading: automated filtering tools that scan the entire stock market to surface specific technical and fundamental setups matching your exact trading rules. In this guide, we'll walk you through the complete process, step by step. By the end, you'll know how to configure exact volume, momentum, and volatility parameters to find high-probability setups. Our team relies on these methods every single week to cut through the noise and focus only on the best opportunities.
What Makes a Swing Trading Screener Actually Useful?
A swing trading screener becomes useful when it combines strict liquidity filters with specific technical indicators to eliminate low-probability stocks. The best screeners reduce a universe of thousands of equities down to a manageable watchlist of 10 to 20 highly qualified candidates that match your exact strategy.
We teach our members that a good screener removes emotion from the equation. Instead of scrolling through charts hoping to spot a pattern, you force the market to bring the patterns to you. This systematic approach saves hours of manual research every single week.
Proper liquidity and risk management checks should happen before you even glance at a chart. The SEC's investor education resources reinforce how important these safeguards are for retail traders. A properly built screener automates those exact safety checks for you.
Key Concept: A custom screener is a discovery tool that filters the entire market down to a short list of stocks matching your specific technical and fundamental criteria. It is not a buy signal on its own. You still need to analyze the chart and manage your risk.
How Do You Set Up a Stock Screener for Swing Trading?
You set up a stock screener for swing trading by applying a sequence of filters in three distinct phases. First, you establish baseline liquidity and volume constraints. Next, you apply trend and momentum indicators to find directional movement. Finally, you add volatility caps to manage your overall risk.
We build our scans in layers. If you apply too many filters at once, you'll end up with zero results. Here is exactly how we recommend structuring your workflow.
Phase 1: Setting Baseline Liquidity and Volume Constraints
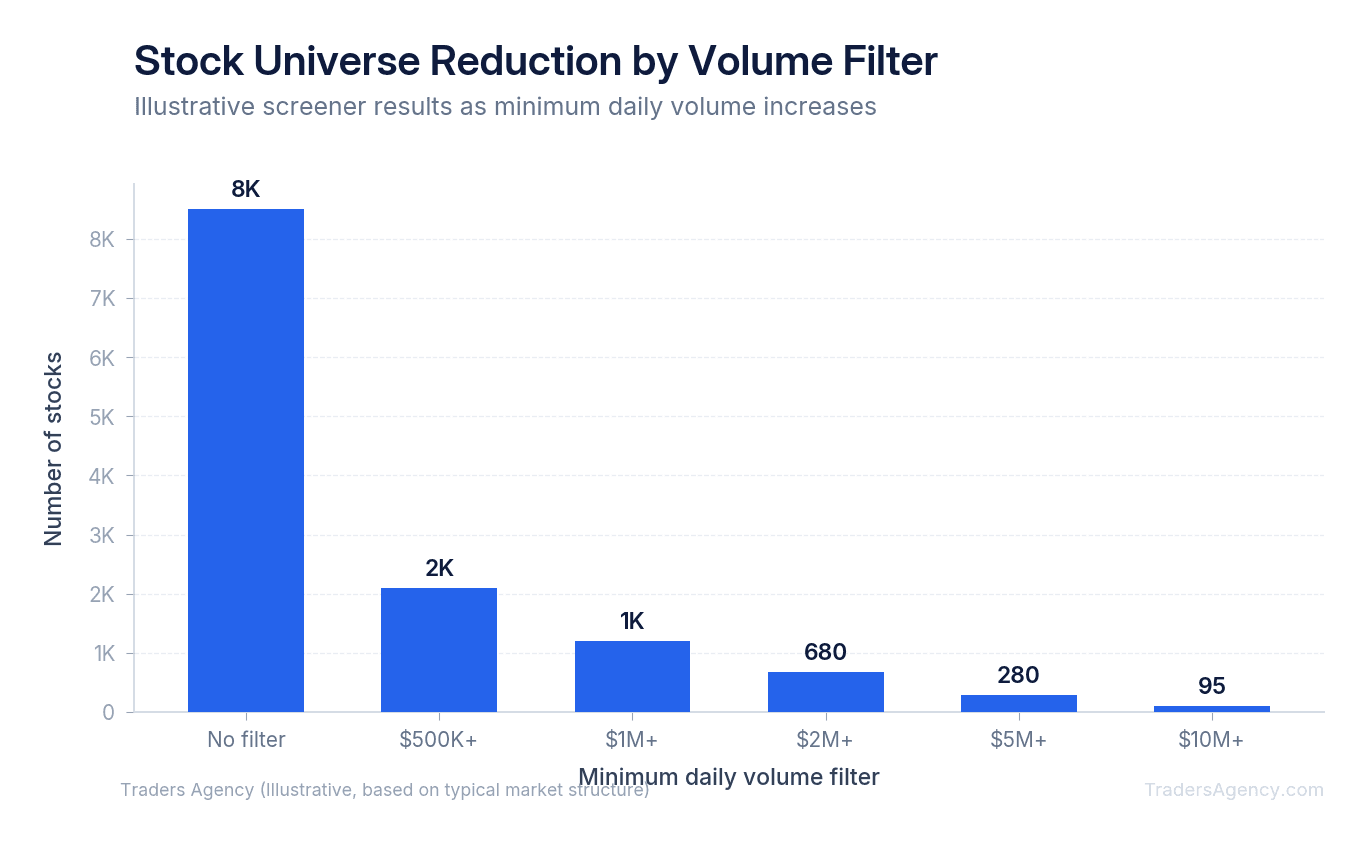
We start by filtering out stocks that are too thin to trade safely. If a stock lacks volume, you'll suffer from wide bid-ask spreads and severe slippage on your entries and exits.
- Set your minimum price to $10.00 to avoid penny stocks. Low-priced stocks are highly susceptible to manipulation and unpredictable gaps.
- Set your minimum average daily volume (ADV) to 1,000,000 shares over the last 30 days. This immediately cuts the market down from roughly 8,000 tickers to approximately 500 highly liquid names.
Phase 2: Applying Trend and Momentum Indicators
Now we want to find stocks that are actually moving. We prefer to use a combination of moving averages and oscillators to identify the primary trend.
- Require the 50-day Simple Moving Average (SMA) to be above the 200-day SMA. This confirms the stock is in a long-term bullish phase.
- Require the current price to be above the 20-day SMA. This ensures short-term momentum is also in your favor.
- Set the Relative Strength Index (RSI) between 40 and 60. This specific range helps you find stocks that are trending nicely but are not yet overbought.
Phase 3: Adding Volatility Caps for Risk Management
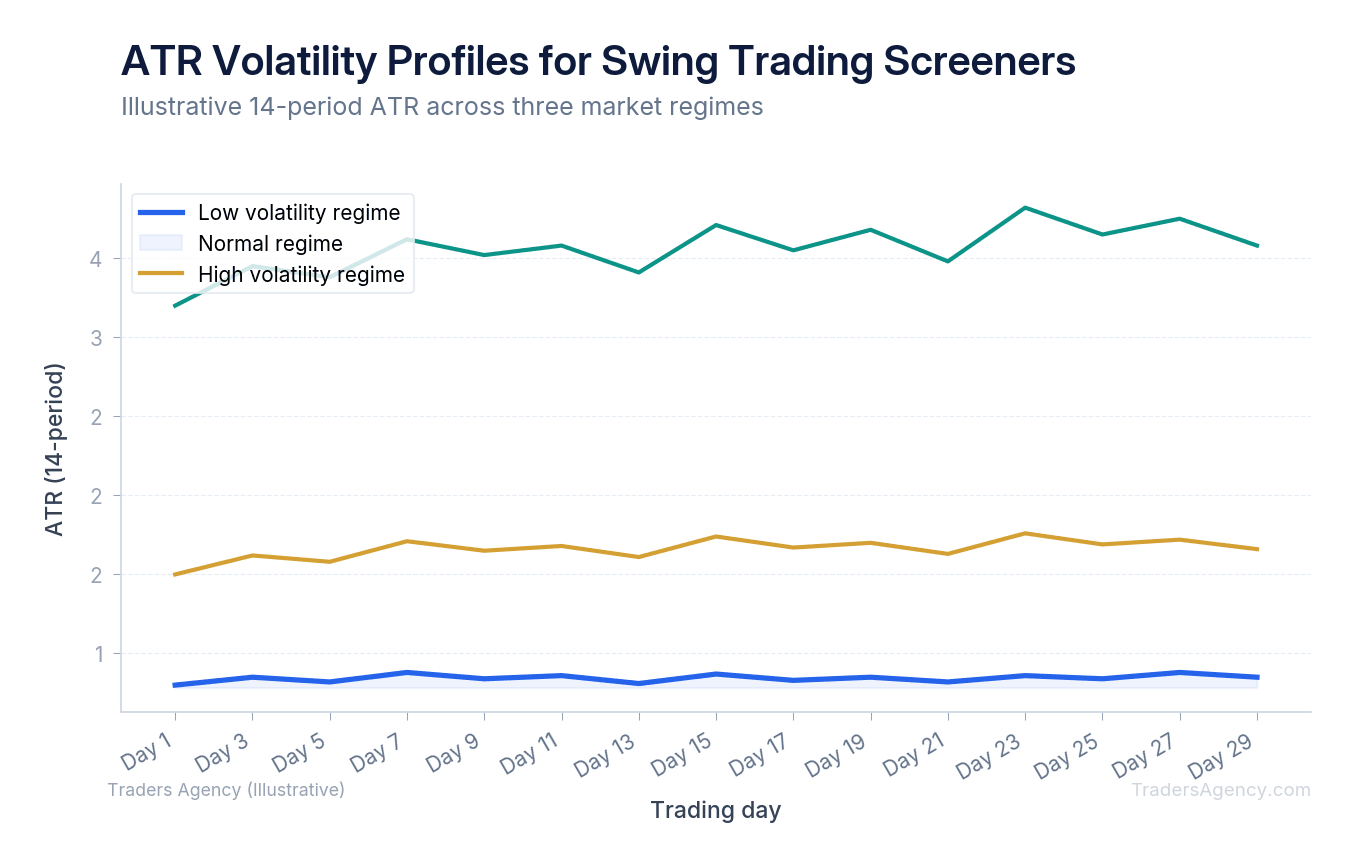
You need to control risk before you enter the trade. We use the Average True Range (ATR) to measure the expected daily price movement of a stock.
- Filter for an ATR of at least $0.50. If a stock barely moves ten cents a day, it won't generate enough price action for a profitable swing trade.
- Cap the ATR at $3.00 or 5% of the stock price. This keeps you out of wildly erratic names that could trigger your stop loss on normal intraday noise.
Watch Out: If your screener returns zero results, you've likely stacked too many filters. Strip it back to your core 3 to 5 filters and add criteria one at a time until you reach a manageable list of 10 to 20 candidates.
Want expert trading insights delivered daily?
Join thousands of traders who rely on Traders Agency for market analysis and trade ideas.
Join Traders AgencyTemplate Screeners for the Most Common Swing Setups
Theory is helpful, but specific numbers are better. Here are exact parameters for actual setups you can build in platforms like TradingView or Finviz today.
The Moving Average Pullback
This setup finds stocks in a strong uptrend that are resting at a major support level. We use this to buy the dip with a tight stop loss.
| Filter | Parameter |
|---|---|
| Price | Greater than $15.00 |
| Volume | Greater than 1.5 million shares |
| Trend | 50-day SMA above the 200-day SMA |
| Pullback Trigger | Current price within 2% of the 50-day SMA |
| Momentum | RSI (14) below 45 |
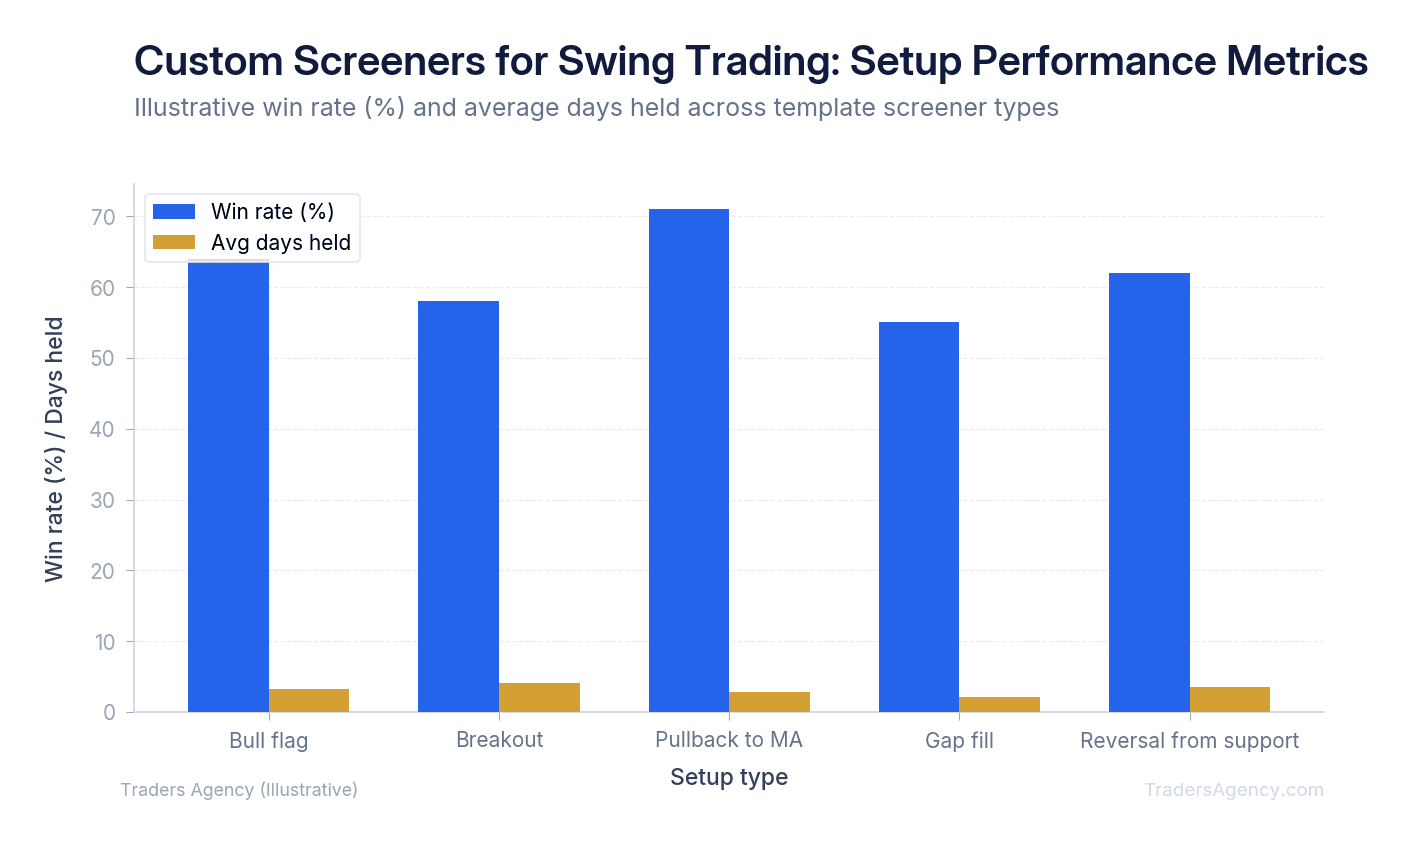
When this scan generates a result, you're looking for a stock that has pulled back to the 50-day moving average. Your entry occurs when the stock shows a green reversal candle off that moving average. Your stop loss goes just below the recent swing low.
The Bull Flag Breakout
This setup looks for tight consolidation after a strong upward move. It's designed to catch the next leg higher.
| Filter | Parameter |
|---|---|
| Performance | Up at least 15% over the last 4 weeks |
| Consolidation | Price within a 5% range over the last 10 days |
| Volume | Current daily volume less than the 20-day average volume |
| Price Location | Price above the 20-day SMA |
The low volume requirement is the secret here. It shows that selling pressure is drying up during the consolidation phase. You enter the trade when the stock breaks above the high of the flag pattern on higher-than-average volume.
Key Concept: Declining volume during consolidation followed by a spike in volume on the breakout is the hallmark of a legitimate bull flag. If volume stays flat on the breakout, treat it as a false signal.
How to Save, Schedule, and Automate Your Scans
Building custom screeners for swing trading is only half the battle. You must run them consistently to catch the best setups before the market opens.
- Save each scan as a preset template with a highly specific name like "Bull Flag - High Volume" or "50 SMA Pullback - Tech Sector." This keeps your workflow organized and repeatable.
- Set your screener to run automatically 30 minutes after the market close. This gives the platform time to update all daily data points accurately.
- Review the results each evening. This gives you a fresh watchlist of 10 to 15 stocks. You can then map out your exact entry prices, stop losses, and profit targets without the stress of the live market ticking away.
Consistency is what separates traders who find great setups from those who chase random tickers. When you run the same scans at the same time every day, you develop a rhythm that keeps you prepared and disciplined.
What Are the Best Filters for a Swing Trading Screener?
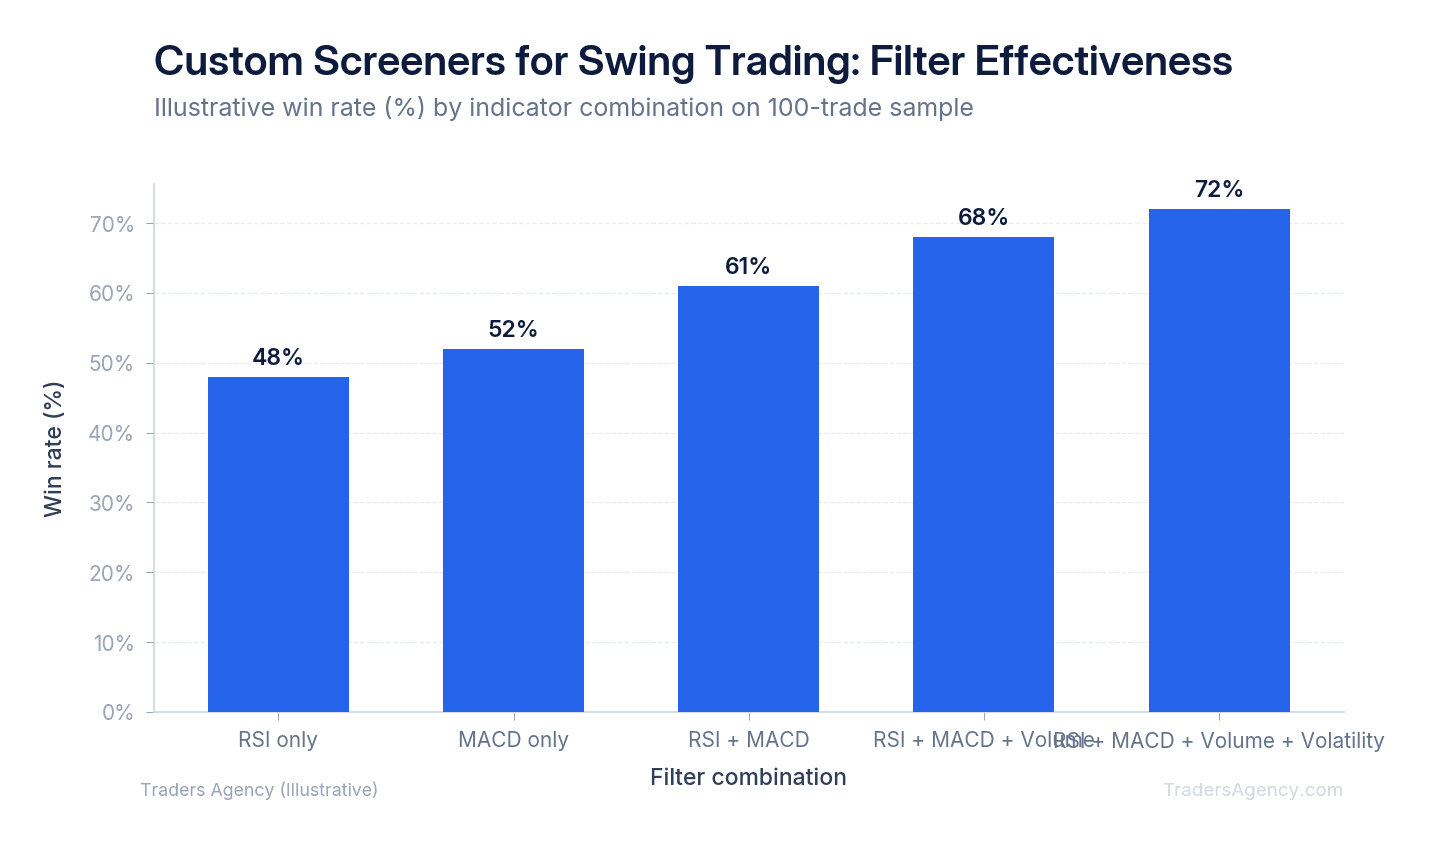
The best filters for a swing trading screener include average daily volume over one million shares, price above the 50-day moving average, and relative volume (RVOL) greater than 1.5. Combining these specific technical filters with basic fundamental criteria like positive earnings growth creates the highest probability watchlists.
We prefer to mix technical price action with light fundamentals. Technicals tell you when to buy, but fundamentals tell you what institutions are buying.
For example, requiring quarterly earnings growth of at least 10% adds institutional backing to your technical setups. Consistent earnings growth often precedes sustained swing trends, and you can verify this by reviewing historical data on the Nasdaq stock screener.
You can also filter by sector. If the technology sector is leading the market, add a filter that only returns stocks within that specific sector. This keeps you trading in the direction of the strongest market currents.
What Are the Most Common Mistakes When Building Custom Screeners for Swing Trading?
Many traders make costly errors when setting up their scans. These mistakes either produce terrible trade candidates or return no results at all. Here is what you must avoid.
- Over-filtering: If you apply 20 different indicators, your scan will return zero results. Stick to 3 to 5 core filters to generate a healthy list of candidates.
- Ignoring relative volume: A stock breaking out on low volume is a trap. Always require RVOL above 1.2 on breakout scans to confirm institutional participation.
- Chasing penny stocks: Screening for stocks under $5.00 introduces massive gap risk. We teach our members to stick to established equities with predictable price action.
- Failing to check the news: A screener only reads raw data. Always check if a stock is popping because of an unexpected buyout rumor or a pending lawsuit before you take the trade.
Risk Warning: A screener is a discovery tool, not a buy signal. You still need to open the chart, draw your levels, and manage your risk. Never risk more than 1% to 2% of your total account equity on a single swing trade, regardless of how perfect the screener setup looks. Position sizing remains your best defense against market volatility.
The bottom line: build your screener with discipline, run it with consistency, and always verify the results with your own chart analysis. That's the workflow our team follows every single week, and it's the same approach we recommend for every trader serious about finding high-probability swing setups.
Want expert trading insights delivered daily?
Join thousands of traders who rely on Traders Agency for market analysis and trade ideas.
Join Traders AgencyKey Takeaways
- A well-built swing trading screener should reduce thousands of tickers down to a focused watchlist of 10 to 20 highly qualified candidates that match your exact strategy criteria.
- Liquidity and risk management filters should be applied before you ever look at a chart, not after you have already spotted a pattern you like.
- Position sizing is the core risk control: never risk more than 1% to 2% of total account equity on a single swing trade, no matter how clean the setup looks.
- The screener's job is to surface setups, not replace chart analysis. Always verify screener results with your own review of price action, key levels, and risk parameters.
- Combining strict liquidity filters with specific technical indicators is what separates a useful screener from one that just generates noise.
DISCLAIMER: Traders Agency does not offer financial advice. The information provided is for educational purposes only and should not be considered financial advice. Traders Agency is not responsible for any financial losses or consequences resulting from the use of the information provided. Trading carries inherent risks and may not be suitable for all individuals. You are advised to conduct your own research and seek personalized advice before making any investment decisions, recognizing the potential risks and rewards involved.
See more from Traders Agency on Google
Make us a preferred source and our market analysis will appear more prominently in your Google Search, Top Stories, and AI results.
Add to Preferred Sources