
You have probably seen this happen in your own trading. You spot a stock with a low price-to-earnings ratio and buy it, only to watch the price stagnate for months. Or you avoid a fast-growing tech stock because the valuation looks too high, only to watch it double in price over the next year. The problem is not your instinct. The problem is the tool you are using to measure value. The PEG ratio solves this by factoring growth into the equation, and we are going to show you exactly how to use it.
Many beginners struggle with valuation. They see a stock trading at ten dollars and think it is cheap. They see another stock trading at two hundred dollars and think it is expensive. But share price alone tells you nothing about the underlying value of the business.
The PEG ratio is a valuation metric that divides a company's price-to-earnings ratio by its expected earnings growth rate. This calculation helps investors determine if a stock is truly overvalued or if its high price is justified by rapid growth.
We will walk you through exactly how this metric works and how to apply it to your own stock analysis. By the end of this guide, you will know how to calculate the metric, compare it across different sectors, and use it to identify fairly priced growth stocks while avoiding value traps.
What Is the PEG Ratio?
Bottom Line: The PEG ratio gives investors a more complete picture of value than the P/E ratio alone by folding growth expectations into the equation. Its real power is in filtering out value traps and overpriced momentum stocks before you do deeper research. Use it to build a shortlist, then verify with fundamentals before putting money to work.
The PEG ratio (price/earnings-to-growth ratio) is a fundamental analysis tool that measures a stock's valuation while factoring in the company's expected earnings growth. It provides a more complete picture than the standard P/E ratio by answering a simple question: are you paying a fair price for future growth?
To understand this metric, you first need to understand the standard P/E ratio. The P/E ratio takes the current stock price and divides it by the earnings per share. It tells you how much you are paying for one dollar of current profit.
We teach our members that looking at a P/E ratio in isolation is like looking at a car's price tag without knowing its mileage. A P/E ratio of 15 might look cheap, but if the company's earnings are shrinking, it is actually a bad deal.
Conversely, a P/E ratio of 30 might look expensive. If that company is growing its earnings by 40% per year, that stock might actually be a bargain.
Key Concept: The PEG ratio adjusts the traditional P/E ratio for growth. A fairly priced stock would have a P/E ratio roughly equal to its earnings growth rate, resulting in a PEG ratio near 1.0.
The core idea is straightforward: a fairly priced stock should have a P/E ratio equal to its growth rate. The PEG ratio simply turns this concept into a basic mathematical formula that you can apply to any stock with positive earnings.
How Do You Calculate the PEG Ratio?
You calculate the PEG ratio by taking a stock's current price-to-earnings (P/E) ratio and dividing it by the expected annualized earnings growth rate for a specific time period. A common version of the formula uses the forward P/E ratio and the projected five-year earnings growth rate.
Here is the exact formula we use:
PEG Ratio = (P/E Ratio) ÷ (Earnings Growth Rate)
Let us look at a concrete example using a hypothetical tech stock, TechCorp.
| Parameter | TechCorp | SlowCo |
|---|---|---|
| Share Price | $100 | $50 |
| Earnings Per Share | $4.00 | $5.00 |
| P/E Ratio | 25 | 10 |
| Projected Annual Growth | 20% | 2% |
| PEG Ratio | 1.25 | 5.0 |
TechCorp trades at $100 per share and has earnings of $4 per share. This gives it a P/E ratio of 25 ($100 ÷ $4). Analysts project TechCorp will grow its earnings by 20% annually over the next five years. We divide the P/E of 25 by the growth rate of 20. The resulting PEG ratio is 1.25.
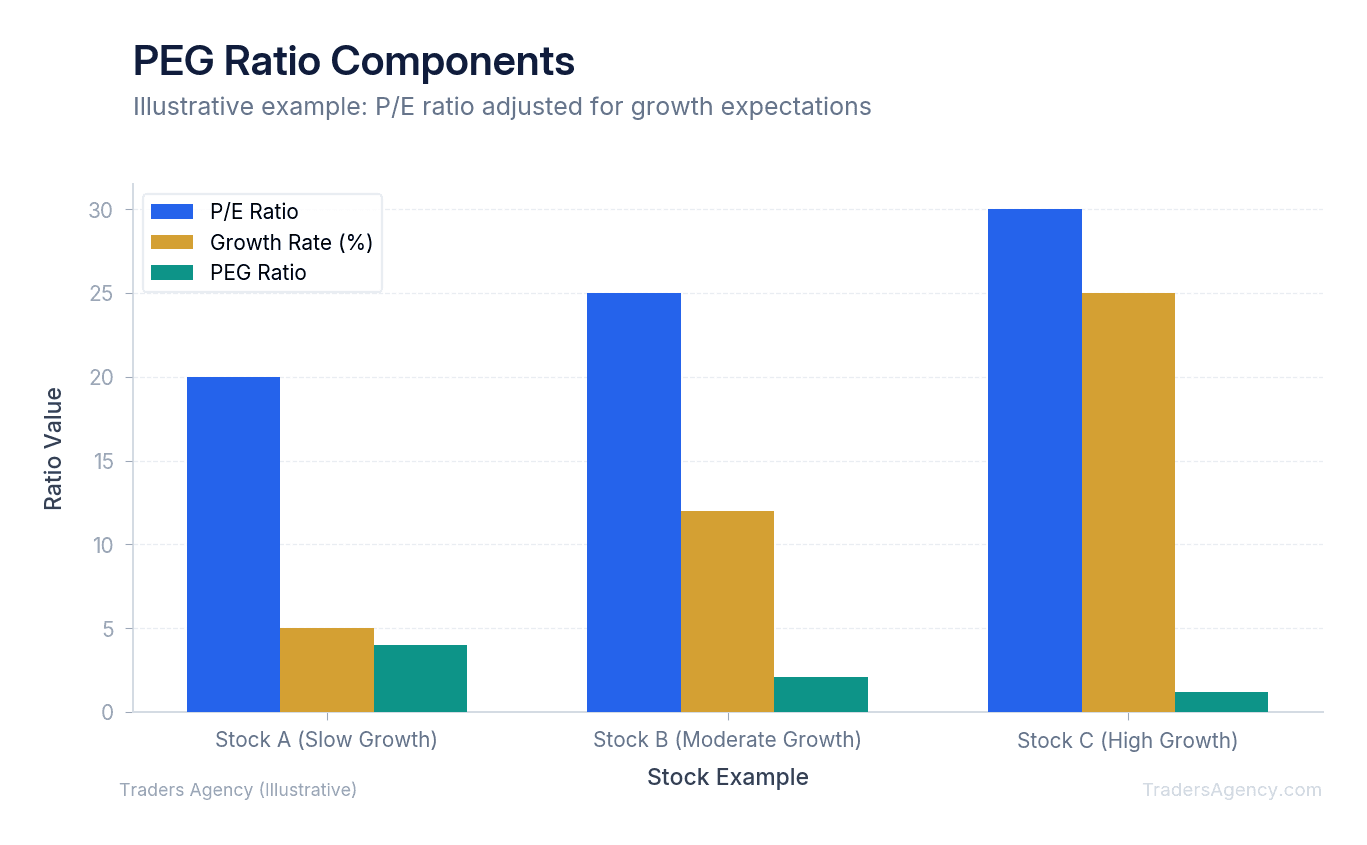
Now look at SlowCo. SlowCo trades at $50 per share with earnings of $5 per share, giving it a P/E ratio of 10. Analysts expect SlowCo to grow earnings by just 2% per year. Dividing the P/E of 10 by the growth rate of 2 gives SlowCo a PEG ratio of 5.0.
Despite having a much lower P/E ratio than TechCorp, SlowCo is actually far more expensive relative to its growth. You do not always have to calculate this manually. Most major stock screeners and brokerage platforms provide this metric automatically. However, knowing the math helps you understand exactly what the number represents.
What Is a Good PEG Ratio?
A good PEG ratio is traditionally considered to be 1.0 or lower, which suggests a stock is undervalued relative to its growth. A ratio exactly at 1.0 indicates fair valuation, while a ratio above 1.0 suggests the stock may be overvalued compared to its expected earnings growth.
However, we prefer to look at this metric with more nuance. Different industries trade at different baseline valuations.
A utility company might have slow, steady growth of 4% per year and a P/E of 12, giving it a PEG of 3.0. That does not automatically make it a terrible investment. It just means investors are willing to pay a premium for the safety and dividends of a utility stock.
On the other hand, a high-growth software company might have a P/E of 40 and a growth rate of 50%, giving it a PEG of 0.80.
Here is how we generally view baseline expectations across different areas of the market:
- Technology and Software: Higher baseline ratios are common due to rapid expansion and high profit margins.
- Utilities and Consumer Staples: Lower growth rates often lead to mathematically higher ratios, but investors accept this for the safety of the dividend.
- Financials and Banks: These typically trade at lower P/E multiples, often resulting in ratios closer to the 1.0 baseline.
- Cyclical Stocks: Companies tied to commodity prices can have wildly distorted ratios depending on where they are in the economic cycle.
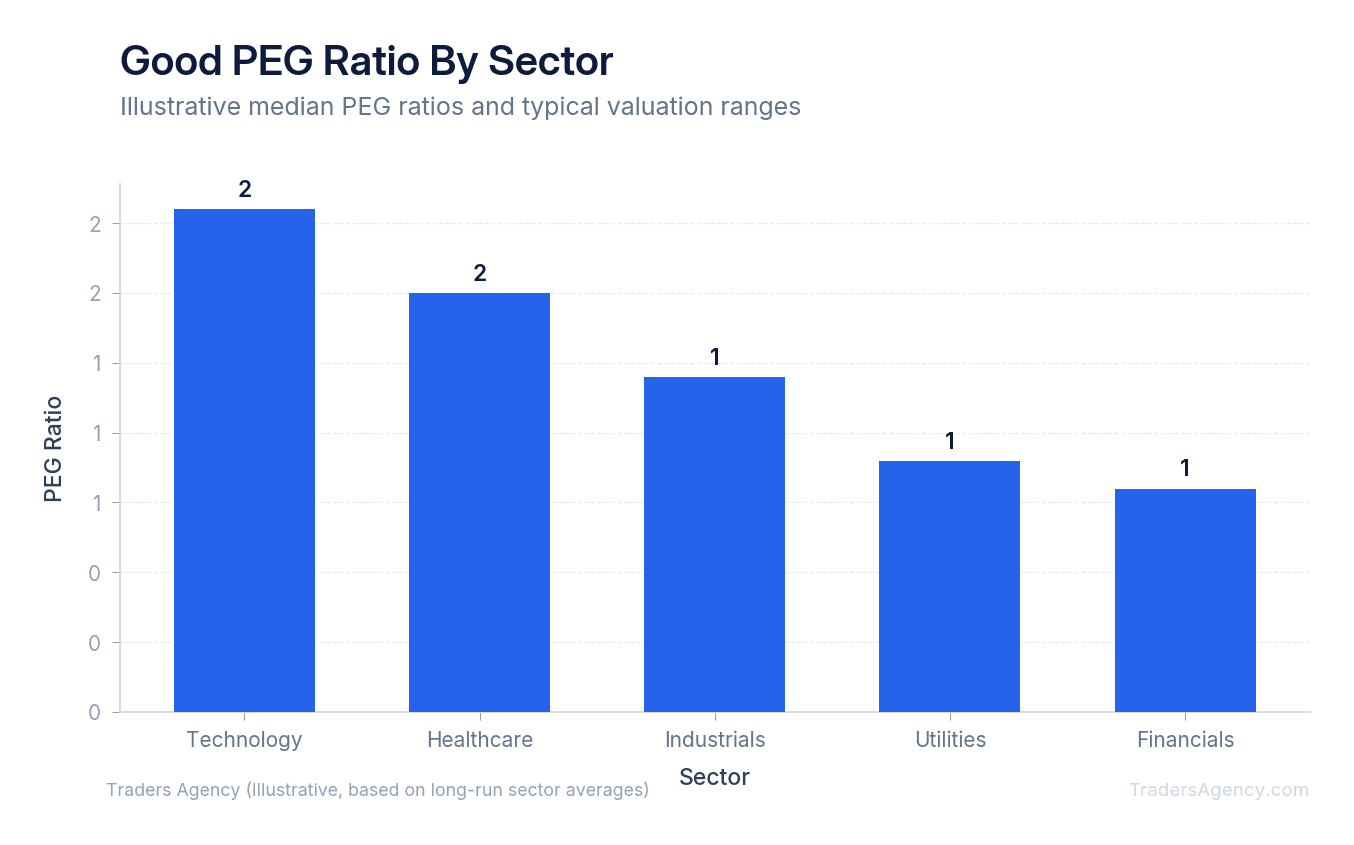
Our team recommends comparing a stock's metric only to other companies in the same sector. A technology stock should be compared to other technology stocks, not to a regional bank.
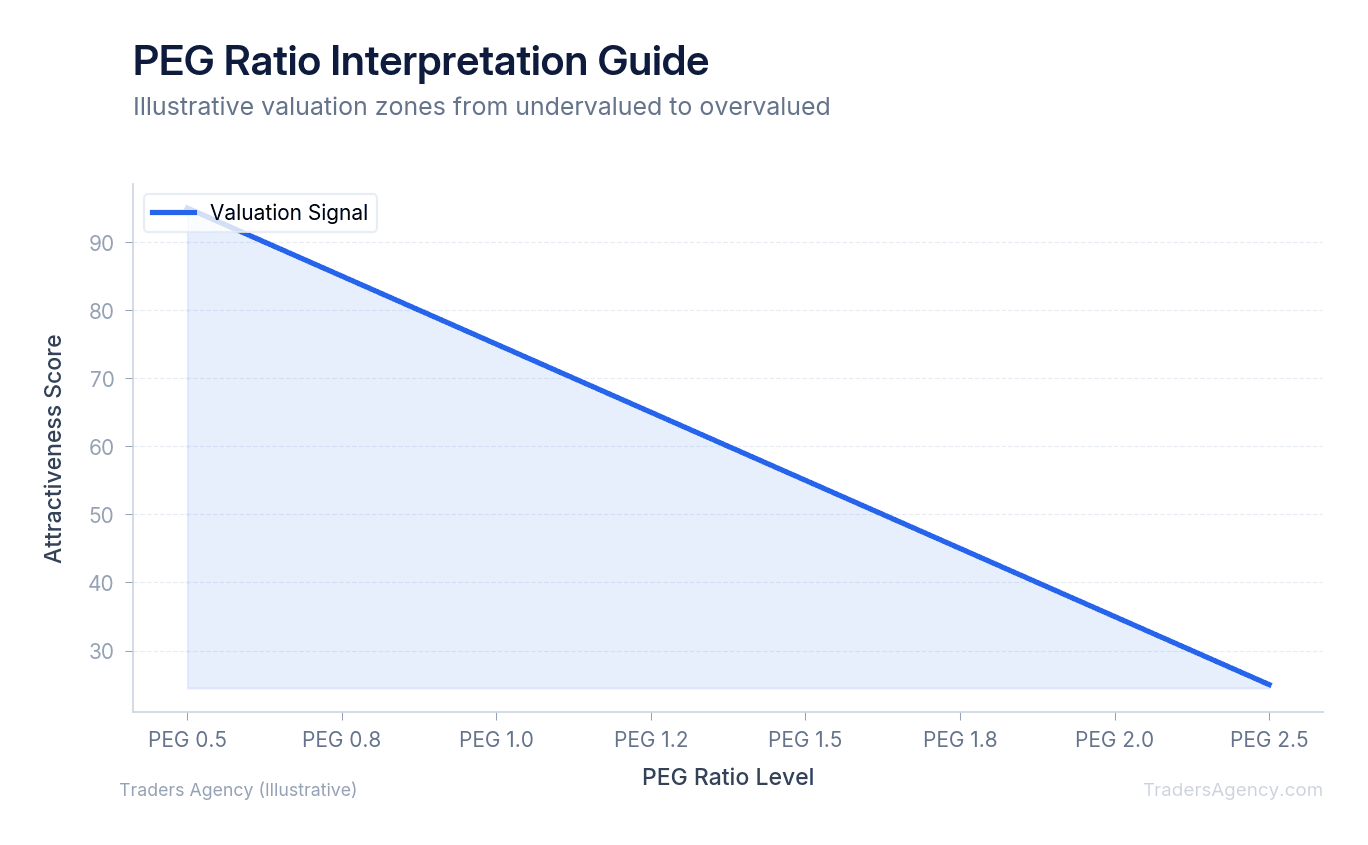
Watch Out: The market rarely offers deep discounts without a reason. A PEG ratio of 0.5 might indicate a massive bargain, or it might indicate that the market simply does not believe the rosy growth estimates published by analysts. Always ask why a stock looks cheap before buying.
PEG Ratio vs P/E Ratio: Which Matters More?
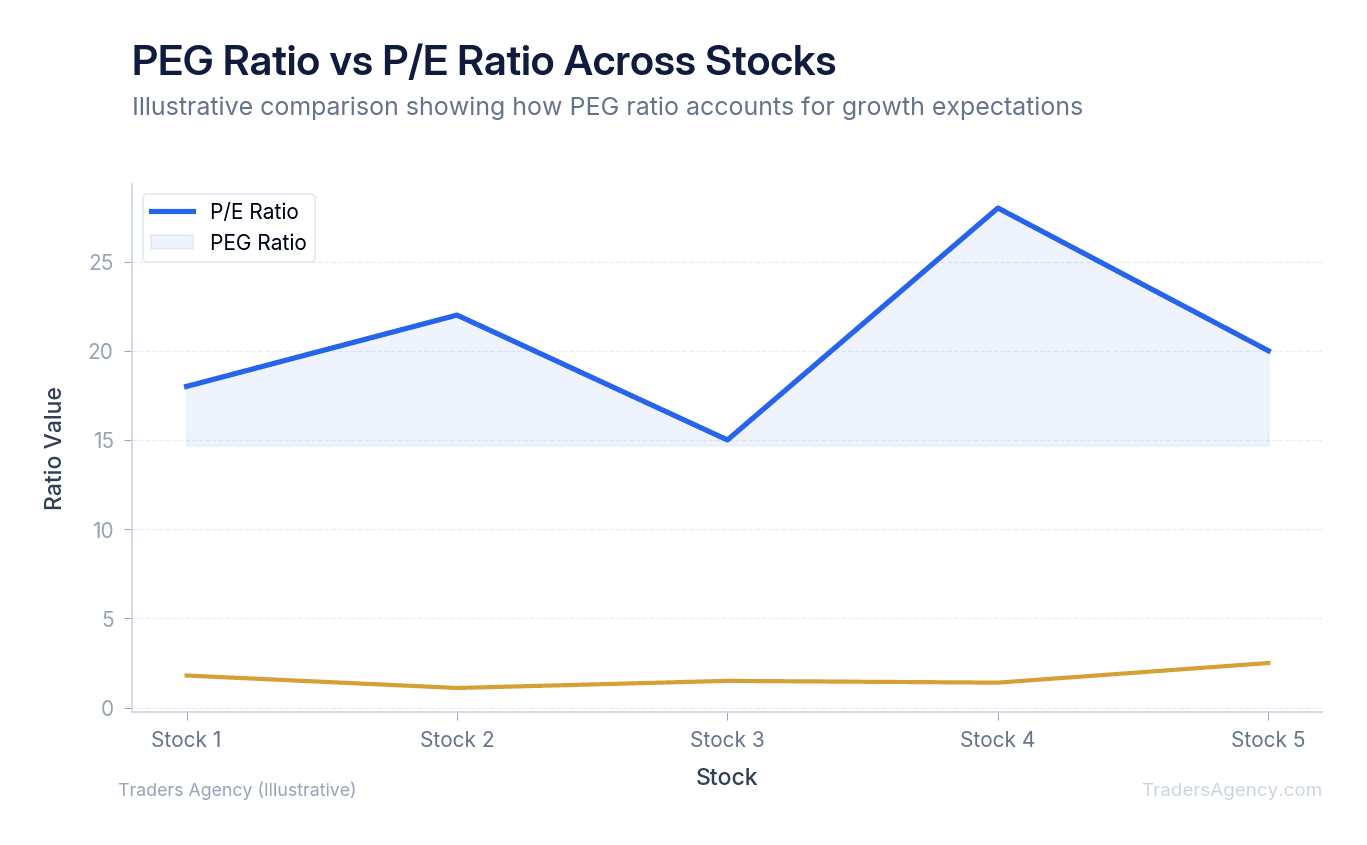
The PEG ratio is generally more useful than the P/E ratio for evaluating growth stocks because it accounts for future earnings expansion. While the P/E ratio only tells you what you are paying for current earnings, the PEG ratio tells you what you are paying for the company's future trajectory.
We view the P/E ratio as a snapshot in time. It is great for mature, slow-growing companies that pay consistent dividends. If you are looking at a company like Coca-Cola or Procter & Gamble, the standard P/E ratio works perfectly well. Their growth rates are highly predictable and relatively low.
But if you are evaluating a company like AAPL or a fast-growing cybersecurity firm, the standard P/E ratio falls short. High-growth companies almost always look expensive on a pure P/E basis. The growth adjustment is required to make an apples-to-apples comparison between a fast grower and a slow grower.
When you rely solely on the P/E ratio, you risk falling into a value trap. A value trap is a stock that looks cheap on paper but is actually a dying business. A company might have a P/E of 6, which looks like a massive bargain. But if their earnings are dropping by 15% every year due to obsolete technology, that stock is a terrible investment. The growth-adjusted calculation helps you spot these traps immediately.
Want expert trading insights delivered daily?
Join thousands of traders who rely on Traders Agency for market analysis and trade ideas.
Join Traders AgencyHow Do You Use the PEG Ratio to Screen Stocks?
We teach our members to use this metric as a filtering tool rather than a final buy signal. Here is a step-by-step walkthrough of how to apply this in a real-world screening scenario.
- Set Your Initial Screener Criteria. Open your preferred stock screener and set your baseline filters. We prefer to start with companies that have a market capitalization above $2 billion to ensure adequate liquidity. Next, filter for positive earnings. Then, set the PEG ratio filter to a maximum of 1.5. We use 1.5 instead of 1.0 because finding quality companies below 1.0 in a strong bull market is incredibly rare.
- Select the Right Timeframe. When setting up your screener, you will usually see options for trailing or forward calculations. We highly recommend using the forward PEG ratio. The stock market is a forward-looking mechanism. Paying for past growth that has already happened is a common beginner mistake. You want to base your valuation on the projected five-year growth rate.
- Compare Competitors Directly. Let us say your screen returns two retail companies. Use the PEG ratio to see which one offers better value for the growth you are getting. The table below shows how this comparison works in practice.
- Verify the Growth Estimates. This is the most important step. You must check where the growth estimates are coming from. Are they based on past performance, or are they forward-looking analyst projections? We always recommend reading the company's recent earnings reports filed with the SEC to see if management's guidance aligns with the analyst estimates used in the screener.
| Parameter | Retailer A | Retailer B |
|---|---|---|
| P/E Ratio | 15 | 24 |
| Projected Growth Rate | 10% | 30% |
| PEG Ratio | 1.5 | 0.8 |
| Verdict | Fairly valued | Undervalued relative to growth |
If you only looked at the P/E ratio, Retailer A looks cheaper. But the growth-adjusted metric reveals that Retailer B is actually offering more growth for your investment dollar.
What Are the Limitations of the PEG Ratio?
While this is an excellent tool, it is not flawless. You should never use it as your only metric for buying a stock. The biggest weakness of this calculation is its reliance on estimated future growth. Here are the key limitations we want you to understand.
The "Garbage In, Garbage Out" Problem
The entire formula depends on accurate growth forecasts. If analysts project a company will grow earnings by 25% next year, the stock might look incredibly cheap today. But if the economy slows down and the company only grows by 5%, that cheap stock suddenly becomes very expensive. Analysts are frequently wrong. They tend to be overly optimistic during bull markets and overly pessimistic during bear markets.
The Negative Earnings Issue
This metric completely breaks down if a company is losing money. You cannot calculate a meaningful P/E ratio for a company with negative earnings. Therefore, you cannot calculate a PEG ratio either. If you are analyzing early-stage biotech companies or unprofitable tech startups, this tool will not help you. You will need to rely on price-to-sales ratios or other valuation methods instead.
The Dividend Blind Spot
This formula only accounts for earnings growth. It completely ignores dividends. If you are evaluating a mature telecommunications company that pays a massive 7% dividend yield but has zero earnings growth, the standard formula produces an undefined result (division by zero), making the stock appear uninvestable by this metric alone. For high-yield dividend stocks, this specific calculation is the wrong tool for the job.
Risk Warning: Because growth estimates can miss the mark, we always employ strict risk management. Finding a stock with a PEG ratio of 0.7 does not mean you should allocate your entire portfolio to it. We prefer to limit any single stock position to 5% of total portfolio capital and use stop losses to protect against broader market sell-offs. A cheap stock can always get cheaper.
Remember This: The PEG ratio is a powerful screening tool, not a complete investment thesis. Use it to narrow your list of candidates, then confirm your analysis with earnings reports, balance sheet health, and sector trends before committing capital.
Want expert trading insights delivered daily?
Join thousands of traders who rely on Traders Agency for market analysis and trade ideas.
Join Traders AgencyKey Takeaways
- The PEG ratio divides a stock's price-to-earnings ratio by its expected earnings growth rate, giving you a valuation that accounts for how fast the company is actually growing.
- A PEG ratio below 1.0 is generally considered undervalued relative to growth, while a ratio above 1.0 suggests the market may be pricing in more optimism than the earnings growth justifies.
- The metric helps avoid two common mistakes: buying a low P/E stock that is cheap for good reason, and avoiding a high P/E stock that is actually fairly priced given its growth trajectory.
- No single position should exceed 5% of total portfolio capital, even when the PEG ratio looks attractive. Stop losses remain essential because a cheap stock can always get cheaper.
- The PEG ratio works best as a screening tool to narrow your candidate list, not as a standalone buy signal. Confirm findings with earnings reports, balance sheet health, and sector context before committing capital.
DISCLAIMER: Traders Agency does not offer financial advice. The information provided is for educational purposes only and should not be considered financial advice. Traders Agency is not responsible for any financial losses or consequences resulting from the use of the information provided. Trading carries inherent risks and may not be suitable for all individuals. You are advised to conduct your own research and seek personalized advice before making any investment decisions, recognizing the potential risks and rewards involved.
See more from Traders Agency on Google
Make us a preferred source and our market analysis will appear more prominently in your Google Search, Top Stories, and AI results.
Add to Preferred Sources