A tradingview chart setup is a customized digital workspace where traders analyze price movements, apply technical indicators, and plan their entries and exits. If you have ever opened a charting platform for the first time, stared at a blank grid with flashing numbers, and felt completely overwhelmed, you are not alone. The screen is cluttered with data, and it is hard to know where to begin.
We are going to walk you through exactly how to transform that blank screen into a professional, easy-to-read trading dashboard. Our team knows that a clean, organized chart is the foundation of profitable trading. If you cannot read the data clearly, you cannot make good decisions.
By the end of this guide, you will know how to configure your charts, add essential indicators, and save your workspace so you are ready to trade. We will use specific examples and real ticker symbols so you can follow along on your own screen.
What Is TradingView and Why Do Beginners Use It?
Bottom Line: Building a proper TradingView chart setup is not about adding every available indicator. It is about creating a clean, repeatable workspace where price action is easy to read and your key tools are always in place. Master the layout first, then layer in risk management, because a great chart setup only pays off when you also know how to protect your capital.
TradingView is a cloud-based financial charting platform and social network used by traders to analyze global markets. Beginners choose it because it offers intuitive drawing tools, hundreds of built-in indicators, and real-time data across stocks, forex, and crypto, all accessible directly from a standard web browser.
Think of TradingView as a digital workbench. Just as a mechanic organizes their wrenches and diagnostic tools before fixing a car, you must organize your charts before placing a trade. The platform is divided into four main sections that you will use daily:
- Top toolbar: Houses your timeframes and chart types.
- Left toolbar: Contains all your drawing tools, like trend lines and text boxes.
- Right toolbar: Holds your watchlists and price alerts.
- Central area: Your actual price chart, where the market data appears.
Key Concept: You do not need to download heavy software or pay for expensive data feeds to get started. TradingView syncs automatically, meaning the work you do on your desktop will appear exactly the same on your mobile app.
How Do You Set Up Your First TradingView Chart?
You set up your first tradingview chart setup by typing a ticker symbol into the top-left search box, selecting your preferred timeframe, and choosing a chart style like Japanese candlesticks. This creates a clean baseline for analyzing price action before you add any indicators.
We teach our members to follow a strict, repeatable process when opening a new chart. Here is a specific example using Apple (AAPL):
- Select Your Asset: Click the symbol search box in the top-left corner of the screen. Type AAPL and select the stock from the NASDAQ exchange list. The central screen will instantly populate with Apple's historical price data.
- Choose Your Timeframe: Next to the symbol search box, you will see time intervals like 1m, 5m, 1H, and 1D. We recommend beginners start with the Daily (1D) timeframe. On a daily chart, each data point represents one full day of trading. This filters out the intraday noise and gives you a clear view of the broader market trend.
- Select the Chart Type: Click the icon next to the timeframe menu and select Candles. Candlestick charts are the industry standard for technical analysis. They show the open, high, low, and close prices for each period. A green candle means the price closed higher than it opened. A red candle means the price closed lower. The thin lines extending from the top and bottom of the candles are called wicks, which show the extreme high and low prices of that session.
- Adjust Your Axes: If your chart looks squished or stretched, hover your mouse over the price scale on the right side of the screen. Click and drag up or down to compress or expand the price view. You can also click the small "Auto" button at the bottom right of the screen to automatically fit the data to your window.
Which Indicators Should Beginners Add to Their TradingView Chart First?
Once your basic tradingview chart setup is in place, the next step is adding indicators, which are mathematical calculations based on price and volume. They help you interpret market data and spot potential trading opportunities. To add an indicator, click the "Indicators" button at the top of your screen to open the search menu.
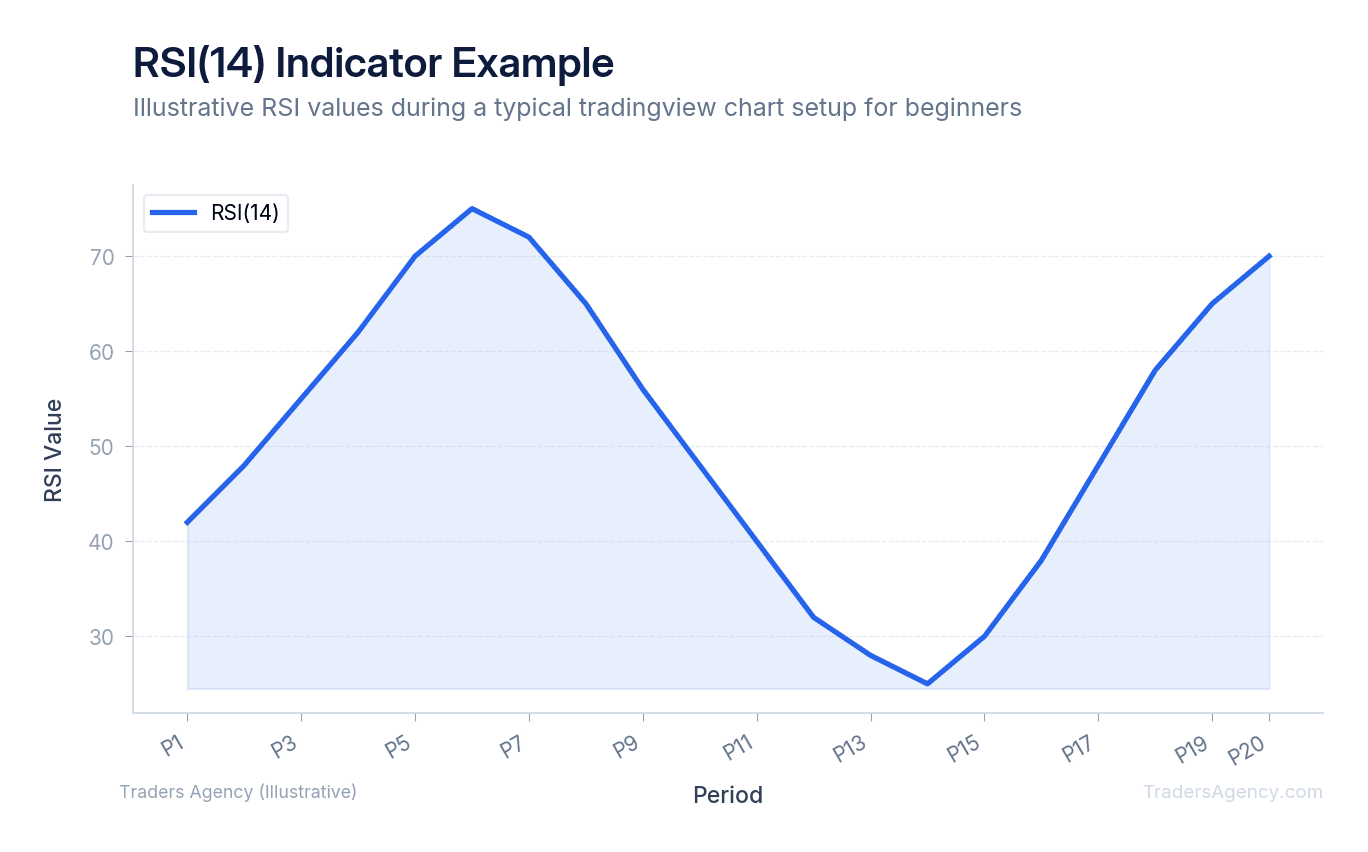
Setting Up the RSI
First, search for the Relative Strength Index (RSI). Click it once to add it to your chart. The RSI will appear in a separate panel below your main price window. We prefer leaving this at the default 14-period setting. The RSI measures the speed of price movements on a scale of 0 to 100. When the RSI crosses above 70, the asset is considered overbought and might pull back. When it drops below 30, the asset is considered oversold and might bounce higher.
Adding Moving Averages
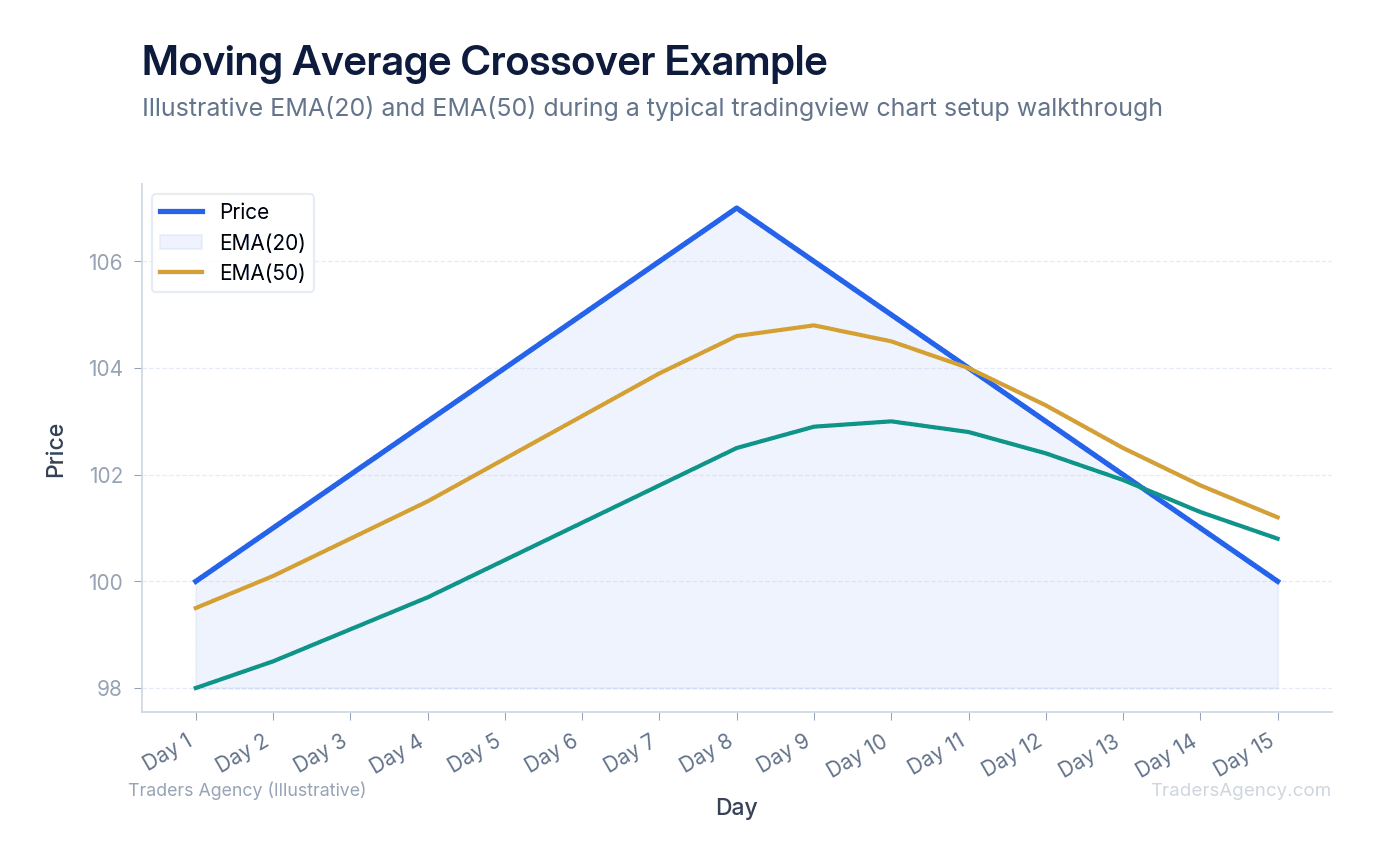
Next, we will add moving averages to the main price chart. Search for Exponential Moving Average (EMA) and click it twice to add two separate lines to your chart. We teach our members to use a fast moving average and a slow moving average to spot trend changes.
- Configure the Fast EMA: Hover over the first EMA label in the top left of your chart and click the gear icon for settings. Set the length to 20 periods and color it blue.
- Configure the Slow EMA: Open the settings for the second EMA, set the length to 50 periods, and color it red.
Key Concept: When the blue 20 EMA crosses above the red 50 EMA, it signals a potential uptrend (a bullish crossover). If the blue 20 EMA crosses below the red 50 EMA, it warns of a potential downtrend (a bearish crossover).
Want expert trading insights delivered daily?
Join thousands of traders who rely on Traders Agency for market analysis and trade ideas.
Join Traders AgencyUsing Drawing Tools for Trend Lines and Support/Resistance
Your left-hand toolbar houses all your drawing tools. These are necessary for marking key price levels where buyers and sellers have historically stepped in.
Drawing Support and Resistance Lines
To draw a support line, select the Horizontal Line tool from the left menu. Look for a price level where the stock has fallen, stopped, and bounced upward at least twice. For example, if AAPL repeatedly falls to $170.00 and bounces back up, place a horizontal line exactly at that level. This is your support floor. Buyers view this price as a discount.
To draw a resistance line, use the same tool but look for the opposite scenario. If AAPL repeatedly rallies to $185.00 and falls back down, place a line at that level. This is your resistance ceiling. Sellers view this price as a premium and step in to take profits.
Drawing Trend Lines
Select the Trend Line tool from the menu. In an uptrend, click on a low price point and drag the line upward to connect to the next higher low. This angled line acts as dynamic support. If the price breaks below this line, the uptrend might be ending.
Our team recommends keeping your drawings simple and obvious. If you have to force a line to fit the data, it is probably not a valid trend. The best support and resistance levels are visible to everyone in the market.
How Do You Save Layouts and Create Price Alerts?
You save layouts by clicking the cloud icon in the top right corner, which syncs your charts across all desktop and mobile devices. You create price alerts by right-clicking any price level on the chart axis and selecting "Add Alert" to receive instant notifications.
Saving your work prevents you from having to rebuild your tradingview chart setup every morning. Once you have your indicators and drawing tools exactly how you want them, click the small cloud icon at the top right. You can name this layout something like "Daily Trend Strategy." The next time you log in, your chart will look exactly as you left it.
Setting Up Price Alerts
Alerts are equally important for managing your time and risk. You do not need to stare at the screen all day waiting for a stock to reach your target. Let the software do the heavy lifting.
- Set a Price Alert: If you want to buy AAPL when it breaks above your resistance line at $185.00, hover your mouse over the $185.00 level on the right-hand price axis. Right-click and select "Add Alert for AAPL at 185.00."
- Customize the Trigger: A menu will pop up allowing you to choose how you want to be notified: email, desktop pop-up, or push notification on the TradingView mobile app.
- Set Indicator Alerts: You can also right-click your RSI indicator and set an alert to trigger when the value drops below 30. This tells you immediately when an asset becomes oversold, allowing you to review the chart for a potential entry.
Do Beginners Need a Paid TradingView Plan or Is the Free Tier Enough?
TradingView offers a free Basic plan and several paid subscriptions like Pro and Premium. We always tell new traders to start with the free version. You do not need to spend money on software while you are still learning the basics of market mechanics.
The free tier allows you to view one chart per tab and add up to two indicators per chart. You also get access to all the drawing tools and basic timeframes.
This limitation is actually a benefit for beginners. It forces you to focus on price action rather than cluttering your screen with dozens of conflicting signals. Two indicators (like one moving average and the RSI) are more than enough to begin developing a trading strategy.
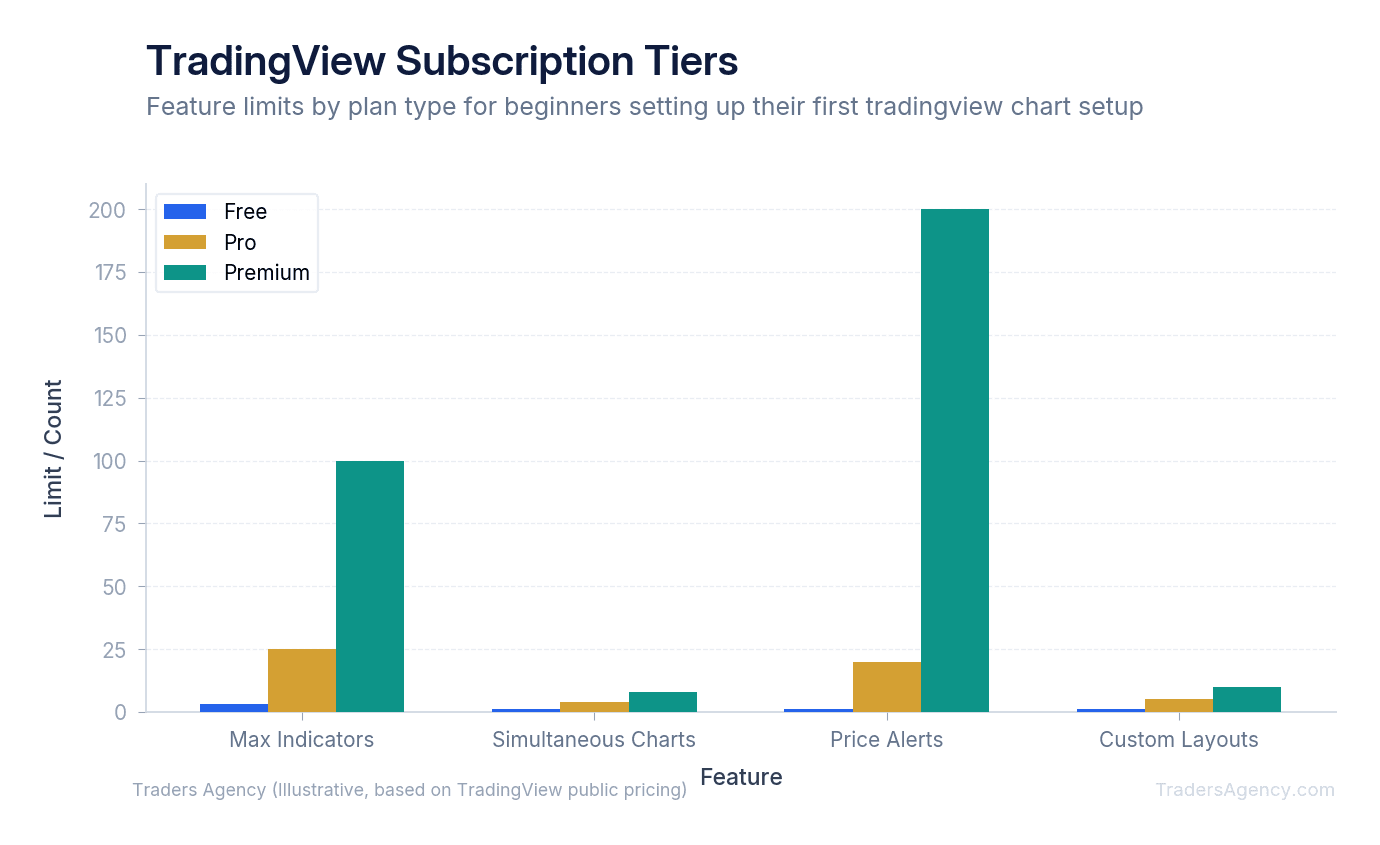
| Feature | Free (Basic) | Pro | Premium |
|---|---|---|---|
| Charts per Tab | 1 | 2 | 8 |
| Indicators per Chart | 2 | 5 | 25+ |
| Active Price Alerts | 1 | 20 | 400 |
| Custom Timeframes | No | Yes | Yes |
| Ad-Free Experience | No | Yes | Yes |
You might consider upgrading to a paid plan later when your trading evolves. Paid plans become useful when you need:
- Multiple charts on a single screen for comparing different timeframes simultaneously.
- More than two indicators on a single chart for advanced strategies.
- Custom timeframes, like a 2-minute or 12-hour chart.
- More active price alerts running at the same time.
- Ad-free browsing, which removes the pop-ups that occasionally appear on the free tier.
Wait until you are consistently executing trades and actually feel restricted by the free tier before you pull out your credit card.
What Are the Most Common TradingView Chart Setup Mistakes Beginners Make?
The biggest mistake we see with any tradingview chart setup is indicator overload. Adding ten different indicators to a single chart makes it impossible to read the actual price candles. If your chart looks like a laser light show, you are doing it wrong. Keep your screen clean. We recommend a maximum of three indicators: two moving averages on the price chart and one oscillator below it.
Another common error is ignoring the mobile app sync. If you draw a trend line on your desktop, make sure your layout is saved so it appears on your phone. Many beginners draw lines as a "guest" user without logging in, and they lose all their work when they close the browser. Always create a free account and stay logged in.
Traders also make the mistake of using the wrong timeframe for their goals. If you are planning to hold a stock for three weeks, you should not be obsessing over a 5-minute chart. Match your timeframe to your trading style:
| Trading Style | Recommended Timeframes |
|---|---|
| Day Trading | 5-minute and 15-minute charts |
| Swing Trading | Daily and Weekly charts |
| Position Trading | Weekly and Monthly charts |
Watch Out: A beautiful chart does not guarantee a profitable trade. Charting is a tool for visualizing data, not a crystal ball. No technical indicator is foolproof. Always practice strict risk management. Never risk more than 1% to 2% of your total account balance on a single trade setup, regardless of how perfect the chart looks. Use stop-loss orders to protect your capital if the market moves against your analysis. A good chart setup gets you into the trade, but disciplined risk management keeps you in the game.
For more on protecting yourself as a trader, the SEC's Investor Education portal offers free resources on risk management and market fundamentals.
Our education team publishes new strategy guides and market analysis every week. If this guide helped you build your first chart, the next step is learning how to read those signals and turn them into real trade plans.
Want expert trading insights delivered daily?
Join thousands of traders who rely on Traders Agency for market analysis and trade ideas.
Join Traders AgencyKey Takeaways
- A TradingView chart setup is a customized workspace combining price data, technical indicators, and drawing tools. Getting it organized before trading is as important as the trade itself.
- TradingView runs entirely in a web browser with real-time data across stocks, forex, and crypto, making it one of the most accessible platforms for beginners who do not want to install software.
- The three essential indicators beginners should add first are RSI, MACD, and moving averages. Each serves a distinct purpose: momentum, trend confirmation, and dynamic support/resistance.
- Saving your workspace as a layout template means you never have to rebuild your chart setup from scratch. This is a step most beginners skip and later regret.
- A clean, readable chart directly affects decision quality. If the screen is cluttered, entries and exits become guesswork rather than analysis.
DISCLAIMER: Traders Agency does not offer financial advice. The information provided is for educational purposes only and should not be considered financial advice. Traders Agency is not responsible for any financial losses or consequences resulting from the use of the information provided. Trading carries inherent risks and may not be suitable for all individuals. You are advised to conduct your own research and seek personalized advice before making any investment decisions, recognizing the potential risks and rewards involved.
See more from Traders Agency on Google
Make us a preferred source and our market analysis will appear more prominently in your Google Search, Top Stories, and AI results.
Add to Preferred Sources