
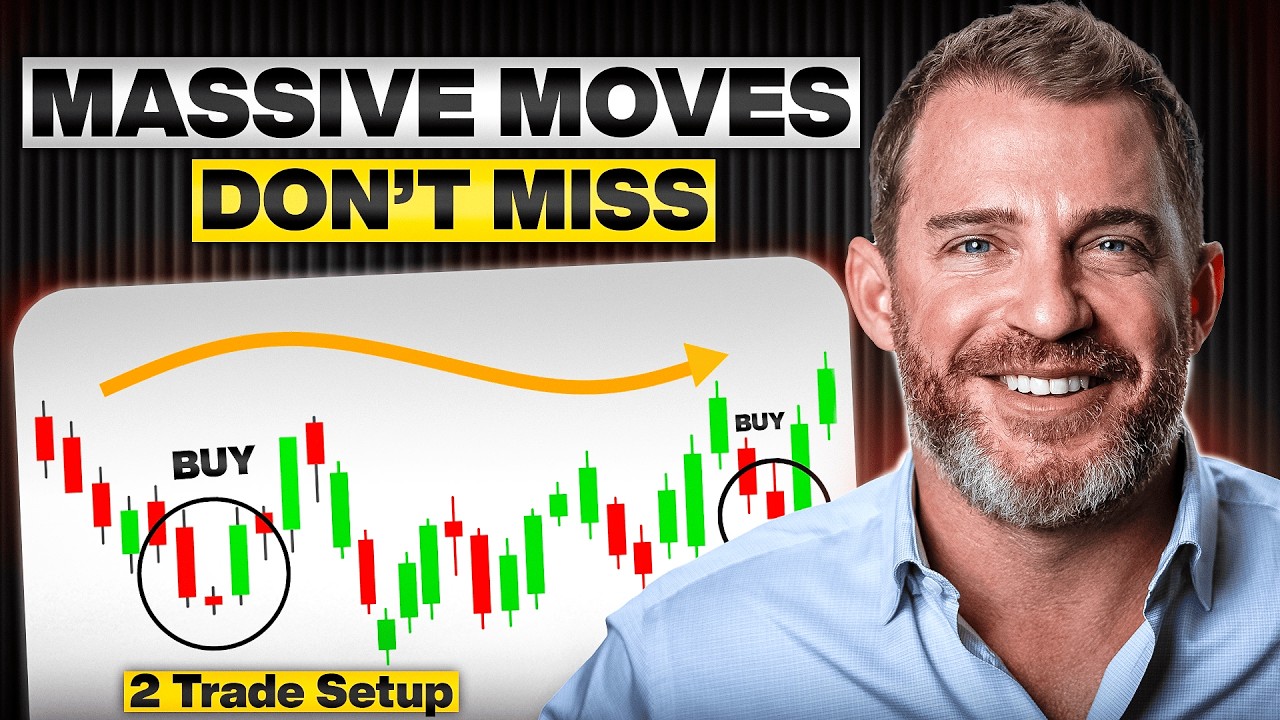
The market just handed us two massive opportunities, and this olin stock analysis breaks down both setups. The first is a midcap chemical company setting up in a perfect stage two breakout, one I believe could deliver 100%+ gains by the end of the year. The second is a direct options trade on the bond market, positioned to profit from what looks like higher interest rates heading into the end of 2026.
Right now, we have a wildly volatile market. Crude oil has swung from $60 to $120, to $90, to $110. Trump spending is moving trillions in market cap with single tweets. This is not an environment built for tactical short-term trades. The volatility will simply shake you out.
You need to play the big picture. That means long-term stage two uptrends and macro-level bond trades.
Here are the exact setups and how to trade them.
Is Olin Corporation Setting Up for a Stage Two Breakout?
Bottom Line: The presenter's thesis is that volatile, macro-driven markets reward patience and big-picture positioning — not short-term trades. Olin Corporation represents a rare, long-duration stage two breakout with a 90–100% upside target, while a TLT put trade offers a defined-risk way to profit if interest rates continue rising. Together, the two trades reflect a strategy built around ignoring the noise and sizing into high-conviction setups.
Olin Corporation, ticker ON, is a midcap chemical company breaking out of a massive 16-month consolidation base. This is a textbook breakout pattern with the potential for serious gains by year-end.
The daily chart tells the story. Price comes in, absorbs supply, and the action tightens repeatedly before finally pushing through into new highs.
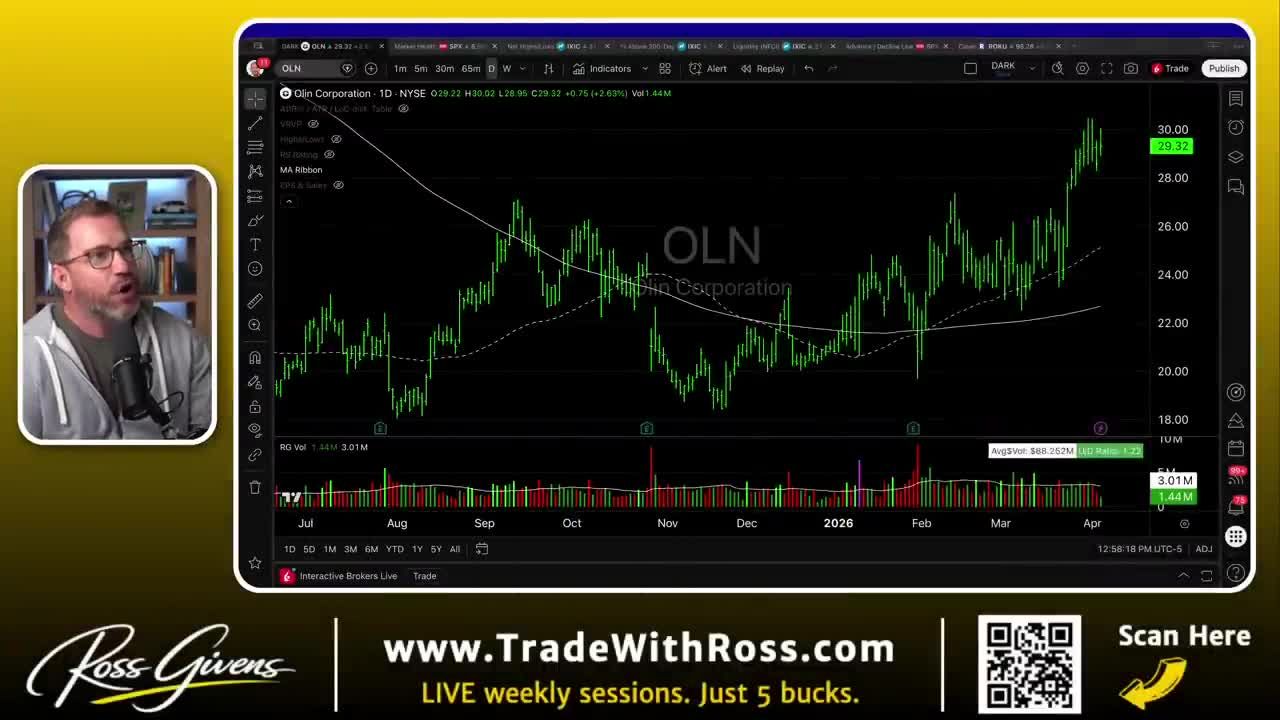
What makes this setup especially compelling is the duration of the base. A 16-month stage one consolidation. We want to see a big, sweeping, shallowing base that tightens up before the stock pushes through resistance. Right now, there is absolutely no supply above this level. The stock has not traded above this price in over a year. The buyers who were trapped at higher levels have already licked their wounds and taken their exits.
The Four-Stage Market Cycle
To understand why this setup is so powerful, you have to understand how stocks move through their lifecycle. Every stock goes through a specific four-stage cycle, and it repeats throughout the entire duration of a company's public life.
Go back and look in logarithmic scale at a 20 or 30-year chart of Amazon, Google, Netflix, or PayPal. You will see this process over and over again. A great example is Roku back in 2021 and 2022.
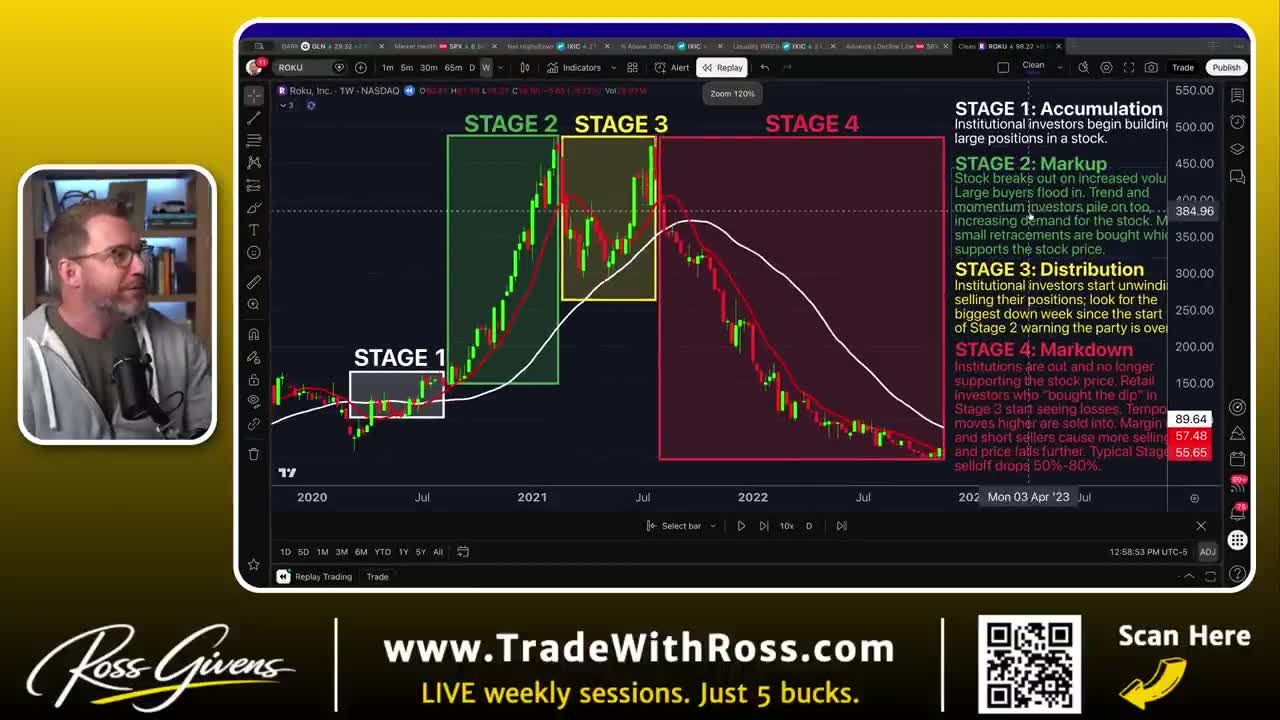
The four phases:
- Stage 1: A deep accumulation phase where the stock builds a base.
- Stage 2: The big markup phase. The stock becomes hot, growth accelerates, and big demand steps in.
- Stage 3: Distribution. The big institutions get out and remove their buying support.
- Stage 4: Markdown. Leading stocks will typically lose 50 to 80% of their value during this decline.
After stage four, the stock goes right back into stage one and repeats the entire process.
Apply this olin stock analysis framework to the weekly chart and these cycles play out perfectly. A big stage one base in 2020. A beautiful stage two uptrend throughout 2021, holding along its 50-day moving average. Then the distribution phase, a couple of big declines, and a harsh stage four markdown.
For the last 14 to 16 months, the stock has been trapped in a new stage one base. Now, it is finally beginning to break out.
The Stage Two Checklist
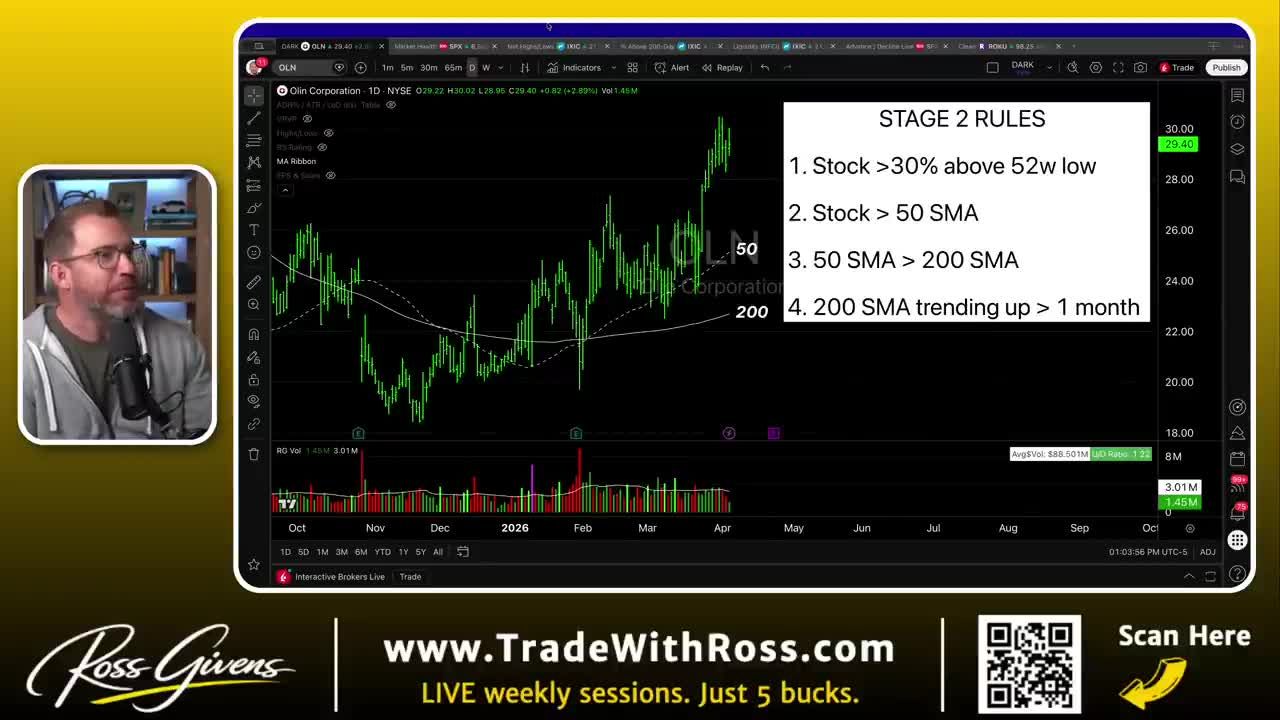
You cannot just eyeball this in hindsight. There are strict technical rules a stock must meet to confirm a new stage two breakout. Olin Corporation currently meets every single one.
1. Price Above the 52-Week Low
The stock needs to be at least 30% above its 52-week low. Real strength coming off the bottom. Often a stock will be 50% or 100% above the low when the setup triggers. Olin currently sits 59% above its 52-week low.
2. Price Above the 50-Day Moving Average
The stock must be trading above its 50-day moving average. The daily chart confirms it is holding above this short-term trend line.
3. Moving Average Stacking
The 50-day moving average must be above the 200-day moving average. Price stacked above the 50-day, the 50-day stacked above the 200-day. This proves the stock is above both its short and long-term trends.
4. Upward Trending 200-Day Moving Average
The 200-day moving average needs to be trending upward for at least one month. During the downtrend, the 200-day was pointing straight down. In late January, it finally turned up. It has now been moving upward for about two months.
What Is the Price Target for Olin Stock?
If this is in fact the start of a new stage two uptrend, my target for Olin Corporation is a move up to the $55 to $60 per share area.
That target zone is the exact area where the stock held in 2022 and 2023. Hitting this level would result in roughly a 90 to 100% gain, and depending on market conditions, the stock could very well go much further above this target.
Get an entire year of live weekly mentoring sessions, my newsletter, indicators, bonus reports, tons more. Click the link and I'll see you in the next live session.
Join my Black Ops Trading ClubWhat Is the Bond Market Signaling Right Now?
You might not like hearing this. The data points to higher interest rates into the end of 2026.
The weekly chart for the 20-year bond yield is flashing a massive warning. A huge run, shallowing, and breakout pattern is setting up in the 20-year bond yield. This technical setup looks exactly like gold did in early 2024 before its massive run.
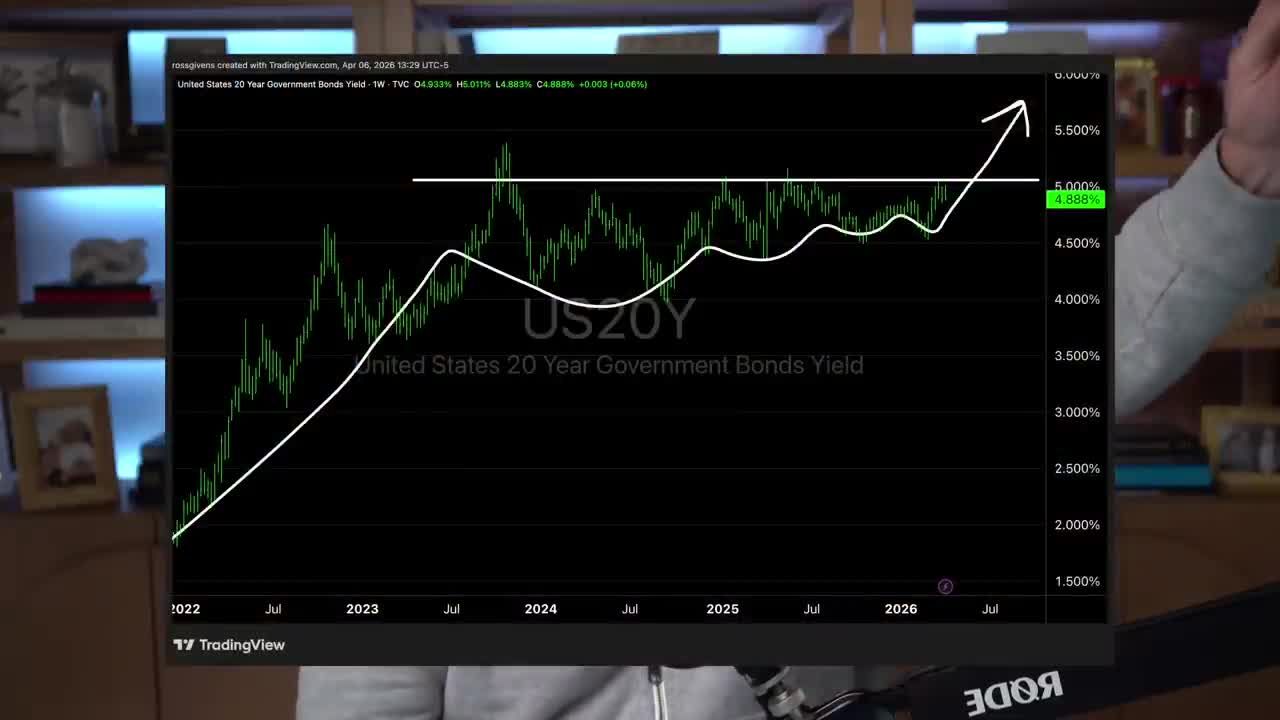
We were promised rate cuts. The macro picture tells a different story. The Fed is trapped. At best, they hold rates steady. At worst, they are forced to raise interest rates.
The reasons are strictly data-driven:
- Massive military spending: The president requested another $500 billion added to the defense budget in 2027.
- Rising inflation: Thanks to an energy spike, the consumer price index is likely to show a 3%, potentially higher, increase year-over-year.
- Global de-dollarization: Foreign nations and sovereign banks are dumping US debt, driving prices lower.
When bond yields go up, bond prices go down. That is simply how these assets work. If you hold a 5% bond and the market suddenly offers a 6% bond, yours is worth less. Buyers will just pay below par to match the new yield.
I thought we were going to see lower yields for a while. The chart is telling a different story. Bond prices are likely going lower, and I want to profit from that move. You certainly are not going to win with loans or mortgages in this environment.
How to Trade Falling Bonds
The easiest and simplest way to profit from falling bond prices without risking a massive amount of money is with stock options.
The vehicle here is TLT, the 20-year Treasury bond ETF. This ETF is the complete inverse of the 20-year yield. Flip the TLT chart upside down and you will see the exact same breakout pattern forming in the bond yield chart.
Why not just short TLT directly, or buy a double or triple short bond ETF? You could. But you probably will not do as well.
Leveraged ETFs are constructed using stock options and futures contracts. Because of that structure, they suffer from transaction costs and time decay. Hold a leveraged ETF for three, six, or nine months and you are not going to get exactly the move you think you are going to.
Shorting TLT directly presents a different problem. This is a big-picture trade expected to play out over several months. Paying margin on that month over month is not ideal.
An option contract solves both problems. Put a couple hundred bucks into the trade. If it plays out, great. If not, you take a small loss.
The TLT Put Option Setup
Right now, TLT is trading at $87.
Even a half-point jump in interest rates, which is exactly what we have seen over the last six weeks, will push TLT down to about $78. If interest rates go a full percentage point higher, TLT drops to $69 or $70.
Here is the exact contract:
1. Select the Expiration Date
Give this trade plenty of time to play out. Go all the way out to the end of the year. The December contract.
2. Pick the Strike Price
Based on the math above, the $80 strike price. We want the $80 December put option.
3. Calculate Your Risk
These contracts are currently trading at about a dollar and a half. Each contract represents 100 shares, so you are paying about $150 per contract.
This is an all-or-nothing bet. If TLT is not below $80 by December 18th, this option is worth zero. Do not put a massive amount of money into this trade. Only put in the amount of money you are willing to risk.
But if we see just a 50 basis point jump in the interest rate, TLT falls 10%. That puts the ETF at around $78.50, placing this put option in the money. If it falls further than that, the value of this contract goes much, much higher.
Play the Big Picture
We are operating in an environment where single tweets move trillions in market cap and oil swings from $60 to $120. You cannot rely on short-term swing trades when the volatility is designed to shake you out.
You must play the big picture.
That means identifying massive stage two breakouts like Olin Corporation for equity gains, and using strictly defined options trades on TLT to profit from the macro shift toward higher interest rates. This olin stock analysis points to a potential 90-100% gain into year-end, while the TLT put trade offers defined-risk exposure to rising rates. Stick to the data, follow the technical rules, and manage your risk.
Get an entire year of live weekly mentoring sessions, my newsletter, indicators, bonus reports, tons more. Click the link and I'll see you in the next live session.
Key Takeaways
- Olin Corporation (ticker: OLN) broke out of a 16-month stage one consolidation base, which the presenter considers a high-conviction setup — the longer the base, the more powerful the potential move.
- The price target for Olin is a 90–100% gain by year-end, based on the stage two breakout pattern and tightening price action on the daily chart.
- The presenter argues that short-term swing trades are the wrong tool in the current environment — crude oil swinging from $60 to $120 and policy-driven volatility make tactical trades too easy to shake out.
- The second trade is a defined-risk put options position on TLT (the 20+ year Treasury ETF), betting on higher interest rates heading into end of 2026.
- The core framework is the four-stage market cycle: only buy stocks in confirmed stage two uptrends, and use a checklist to verify the breakout before entering.
DISCLAIMER: Traders Agency does not offer financial advice. The information provided is for educational purposes only and should not be considered financial advice. Traders Agency is not responsible for any financial losses or consequences resulting from the use of the information provided. Trading carries inherent risks and may not be suitable for all individuals. You are advised to conduct your own research and seek personalized advice before making any investment decisions, recognizing the potential risks and rewards involved.
See more from Traders Agency on Google
Make us a preferred source and our market analysis will appear more prominently in your Google Search, Top Stories, and AI results.
Add to Preferred Sources