
Options open interest is a measure of the total number of active contracts carried over from the previous trading day. It reveals exactly how many positions remain open in the market. You've probably seen a stock suddenly explode higher, seemingly out of nowhere, fueled by retail trading frenzy and social media hype. We're going to walk you through exactly how to spot these setups before they happen. Our team tracks specific data points to separate real market momentum from temporary noise. By the end of this guide, you'll know how to track institutional options positioning and identify gamma squeeze potential. We'll show you the exact mechanics behind these explosive moves and how to protect your capital.
What Is an Option's Open Interest?
Bottom Line: Options open interest tells you where serious money is positioned, but it only becomes actionable when volume confirms the move is actually happening. The real edge comes from combining open interest levels, call and put walls, and max pain theory into a structured process rather than treating any one signal as a trigger. Patience, defined risk, and confirmation from price action separate traders who use this data profitably from those who get caught in false setups.
An option's open interest represents the total number of outstanding derivative contracts that have not been settled, closed, or exercised. When a new buyer and a new seller create a fresh contract, open interest increases by one. If two traders close their existing positions, open interest decreases.
We teach our members to view this metric as a measure of capital commitment. High options open interest means serious money is locked into a specific strike price. It shows us where traders are placing their biggest bets.
This data, maintained by the options exchanges and clearing organizations, updates only once per day. You'll see the official numbers post every morning before the opening bell. This overnight update schedule means you're always analyzing the previous day's final positioning.
Key Concept: Open interest measures the total number of active, unsettled options contracts at a given strike price and expiration. It updates once daily, before the market opens, reflecting the previous session's final positioning.
What Is the Difference Between Open Interest and Volume in Options?
Many traders confuse these two metrics, but they tell completely different stories. Volume counts every single transaction made during the trading day. It measures pure activity and liquidity.
If you buy 10 contracts and sell them five minutes later, the daily volume increases by 20. However, the open interest remains completely unchanged because no new overnight positions were created. The contracts were simply traded back and forth.
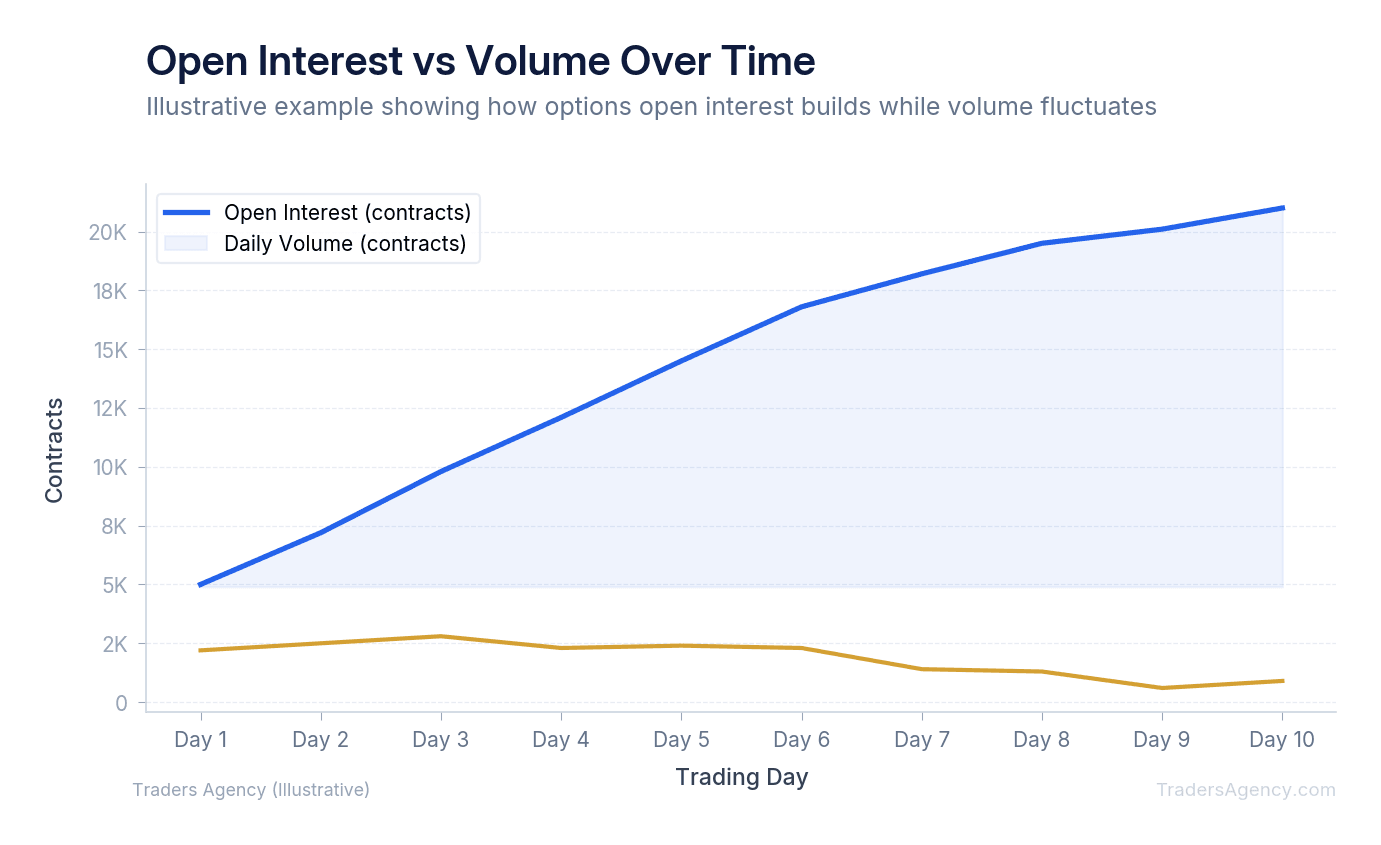
We prefer to look at volume as the daily noise and open interest as the actual trend. Building open interest indicates that traders are holding their positions with conviction. When we see volume exceed the existing open interest on a specific strike, we know major new positions are being established.
| Metric | What It Measures | Update Frequency | What It Tells You |
|---|---|---|---|
| Open Interest | Total active contracts held overnight | Once daily (pre-market) | Conviction and capital commitment at a strike |
| Volume | Total contracts traded during the session | Real-time, intraday | Liquidity and immediate activity level |
How Do You Identify Call Walls and Put Walls Using Open Interest?
A call wall forms when a massive amount of options open interest concentrates at a specific upside strike price. Market makers who sell these calls must hedge their risk by buying the underlying stock as the price rises. This hedging activity directly impacts the stock price.
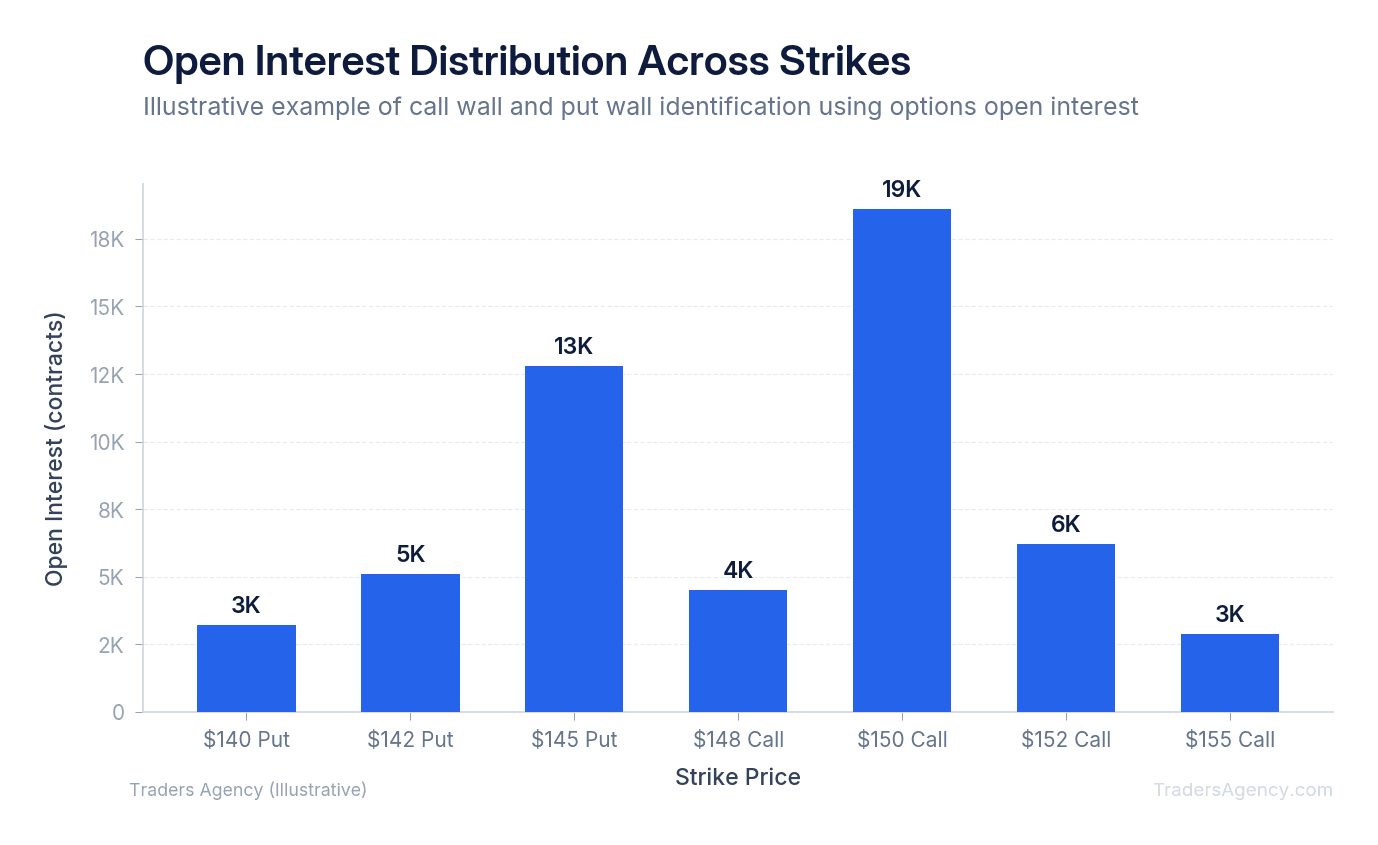
For example, if Tesla (TSLA) is trading at $210, you might notice a massive call wall at the $250 strike. This level acts as a magnet for the stock price. As the stock approaches $250, the buying pressure from market makers accelerates. Once the price breaks through that wall, the momentum can become explosive.
Conversely, a put wall represents heavy concentration at a lower strike price. This often acts as a strong support level. Market makers who sold these puts must hedge by selling the underlying stock (or shorting shares) as the price drops toward this wall, which can accelerate downside moves. However, the heavy put open interest itself often signals that participants expect support at that level. We use these walls to define our trading ranges and set realistic profit targets.
What Does Rising Open Interest Signal About Squeeze Potential?
Rising options open interest signals that a squeeze setup is building because market makers are forced to aggressively hedge their exposure. As traders buy massive quantities of out-of-the-money calls, dealers must buy the underlying stock, creating a self-fulfilling cycle of upward price pressure.
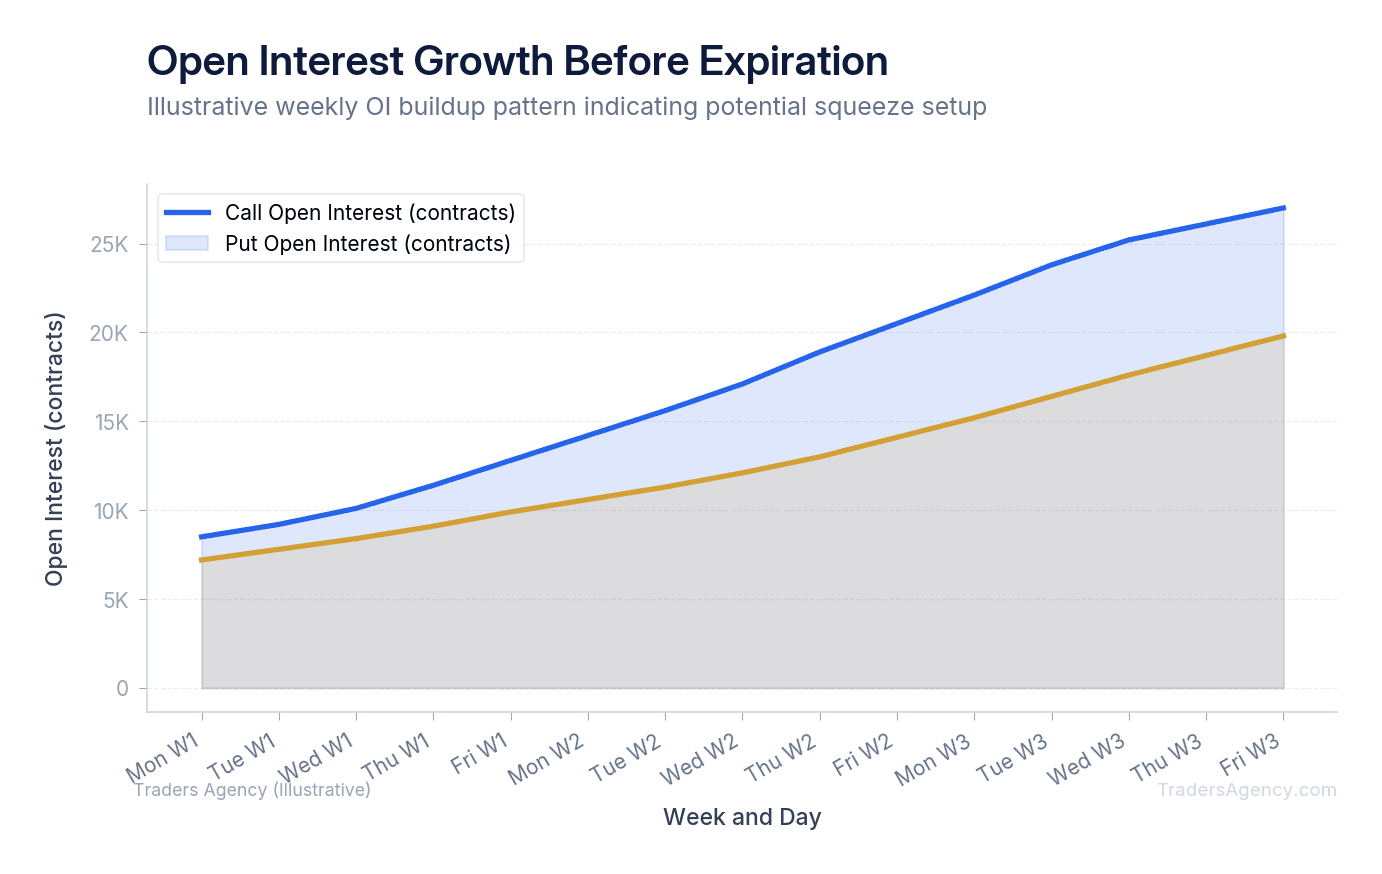
This mechanic is the engine behind a gamma squeeze. When retail traders flood into weekly options, they force institutional dealers to take the other side of the trade. Dealers don't want to take directional risk, so they buy shares to neutralize their position.
If a stock has a low float and suddenly sees open interest spike by 300% in a few days, the squeeze potential becomes explosive. The dealers simply cannot find enough shares to hedge their risk. This lack of available shares forces the stock price higher at an unnatural speed.
Key Concept: A gamma squeeze occurs when heavy call buying forces market makers to hedge by purchasing the underlying stock. This hedging creates additional upward pressure, which triggers more hedging, producing a rapid, self-reinforcing price spike.
Want expert trading insights delivered daily?
Join thousands of traders who rely on Traders Agency for market analysis and trade ideas.
Join Traders AgencyHow to Use Open Interest in Options Trading: A Step-by-Step Example
You use open interest in options trading by identifying unusual contract accumulation at specific strike prices to predict future price movement. Traders track these levels to find optimal entry points, set profit targets near major call walls, and anticipate potential volatility around expiration dates.
Here's exactly how our team recommends setting up a trade based on this data. We'll look at a hypothetical setup for GameStop (GME) to illustrate the mechanics.
- Scan for Weekly OI Changes Before Expiration. We start by looking at the weekly options expiration open interest on a Tuesday. Assume GME is trading at $22 per share. You're looking for sudden anomalies in the data. You notice the open interest on the $30 strike calls expiring this Friday just jumped from 5,000 contracts to 45,000 contracts. This massive overnight increase tells us new money is betting heavily on a quick upward move. Institutions or large retail groups are targeting that specific price level.
- Confirm the Setup and Execute the Entry. Next, we verify that the daily volume supports this trend. We want to see the volume exceeding the existing open interest, which confirms active accumulation rather than old, stale positions. You enter the trade by buying the GME $25 strike calls for a premium of $1.50 per contract.
- Manage the Trade and Plan the Exit. If the stock pushes toward $30, the market makers will aggressively buy shares to hedge that massive 45,000-contract call wall. This buying pressure accelerates the stock price upward in a classic squeeze scenario. We teach our members to sell half of their position when the premium doubles to $3.00. This secures your initial capital and means the remaining contracts are playing with house money. You can then let the rest ride toward the $30 strike while trailing your stop loss.
- Understand the Worst-Case Scenario. If the stock fails to gain momentum and drops to $20, the market makers will reduce their hedges by selling shares. This selling pressure can cause the stock to drop even faster. In this worst-case scenario, your options expire worthless and you lose the entire $150 per contract investment. This is why position sizing is strictly enforced in our trading plans.
| Parameter | Value |
|---|---|
| Stock | GME at $22 |
| Call Purchased | $25 strike, $1.50 premium |
| Maximum Risk | $150 per contract (premium paid) |
| Breakeven at Expiration | $26.50 (strike + premium) |
| Profit Target (half position) | Premium doubles to $3.00 |
| Maximum Reward | Theoretically unlimited if squeeze triggers |
Max Pain Theory and How It Connects to Open Interest
Max pain is the specific strike price where the highest number of active options contracts will expire worthless. This concept relies entirely on accurate options open interest data across both calls and puts.
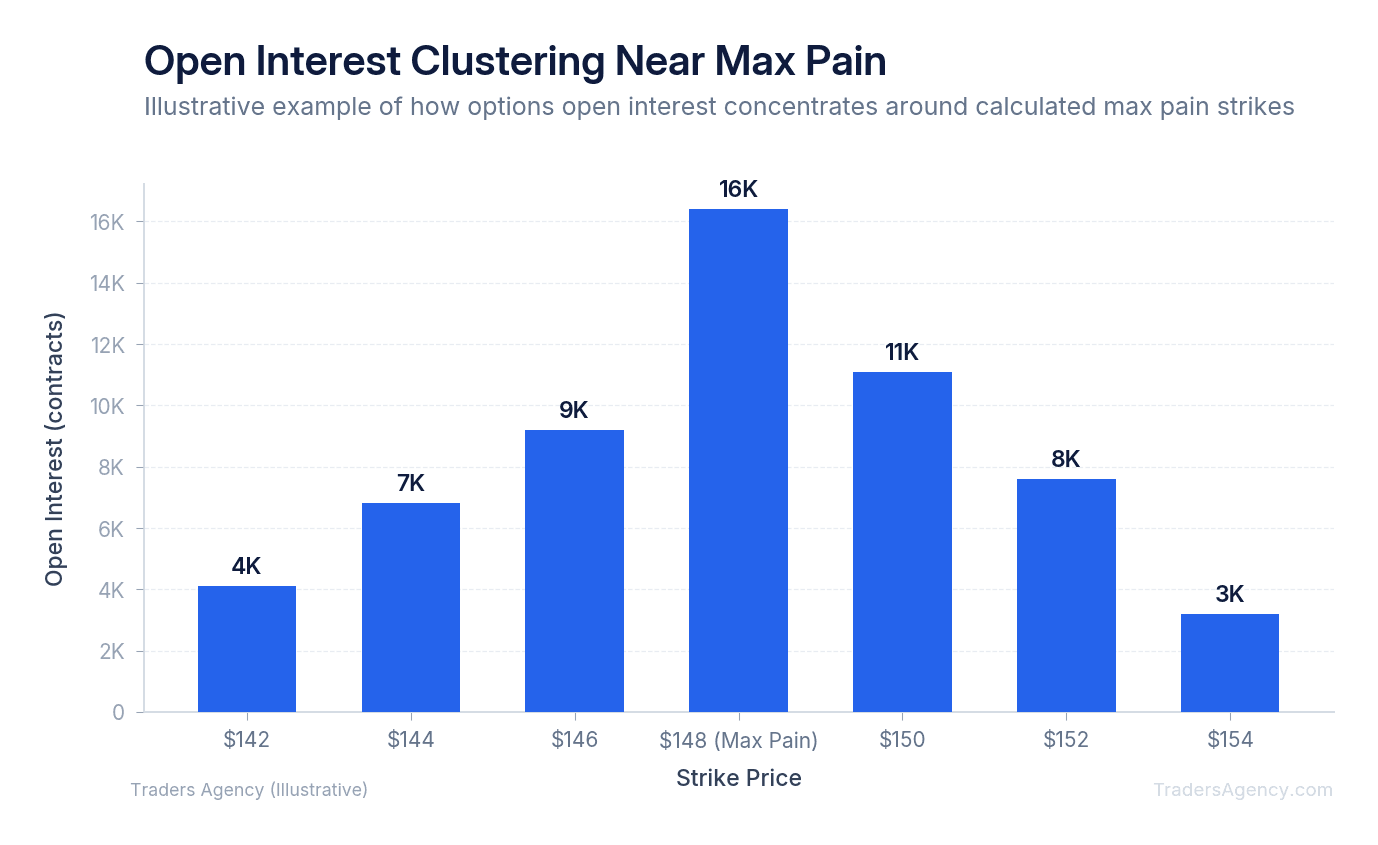
The theory suggests that institutional options positioning naturally drives the underlying stock price toward this max pain level as expiration approaches. Market makers want to pay out the absolute minimum amount of money to option buyers. By pinning the stock price at the max pain level, dealers ensure the majority of contracts expire out of the money.
If the max pain level for Apple (AAPL) is $175, and the stock is currently trading at $185 on a Thursday, you might expect downward pressure on Friday. We frequently use this metric to avoid buying calls right before a stock gets pinned at a lower price. It serves as a powerful gravity point during expiration week.
When NOT to Trade Based on Open Interest Alone
While tracking options open interest is highly effective, it is never a guaranteed predictive tool. You must understand the risks involved with social-media-driven market events. These setups are highly volatile and can reverse in minutes.
We constantly remind our traders that high open interest does not tell you if the contracts were bought or sold. A massive block of calls might actually be a covered call position from a large institution. A covered call is a neutral-to-moderately-bullish signal, not an aggressively bullish one. Assuming every large call position is a speculative buy is a dangerous mistake.
Watch Out: High open interest alone does not reveal whether contracts were bought or sold. A large call position could be a covered call (neutral to moderately bullish), not a speculative long. Always confirm with volume trends and price action before entering a trade.
Here are the specific scenarios where our team avoids trading based solely on this metric:
- During Earnings Week: Implied volatility crush will destroy your premiums even if the stock moves in your direction. The options are simply priced too high.
- Illiquid Options Chains: If the bid-ask spread is wider than $0.20, you'll lose too much capital just entering and exiting the trade. Slippage will eat your profits.
- Relying on Stale Data: Because the SEC and options exchanges only update this data overnight, you're always looking at yesterday's positioning. Intraday volume can completely change the setup before the official numbers update again.
Risk Warning: Always practice strict risk management. We recommend allocating no more than 2% to 5% of your total account equity to any single speculative options trade. Use stop losses on the underlying stock chart to protect your capital if the squeeze fails to materialize. Never trade money you cannot afford to lose.
Tracking options open interest gives you a window into institutional behavior, but it requires patience and discipline to trade successfully. Wait for the volume to confirm the setup, manage your risk on every entry, and stay focused on the process over any single outcome.
The Traders Agency education team publishes new strategy guides and market analysis every week.
Want expert trading insights delivered daily?
Join thousands of traders who rely on Traders Agency for market analysis and trade ideas.
Join Traders AgencyKey Takeaways
- Options open interest updates only once per day, posted each morning before the opening bell, meaning intraday volume is the real-time confirmation signal you need to validate any setup.
- When a new buyer and new seller create a fresh contract, open interest increases by one. When two traders close existing positions, it decreases. This makes it a direct measure of capital commitment at specific strike prices.
- Call walls and put walls form at strike prices with unusually high open interest, acting as magnetic price levels where market makers must hedge, which can either accelerate or stall a move.
- Max pain theory connects to open interest by identifying the price point where the largest number of options contracts expire worthless, giving you a gravitational target for where price may drift near expiration.
- No single options trade should risk more than a small, defined percentage of your equity. Stop losses on the underlying stock chart are the practical tool for protecting capital when a squeeze fails to develop.
DISCLAIMER: Traders Agency does not offer financial advice. The information provided is for educational purposes only and should not be considered financial advice. Traders Agency is not responsible for any financial losses or consequences resulting from the use of the information provided. Trading carries inherent risks and may not be suitable for all individuals. You are advised to conduct your own research and seek personalized advice before making any investment decisions, recognizing the potential risks and rewards involved.
See more from Traders Agency on Google
Make us a preferred source and our market analysis will appear more prominently in your Google Search, Top Stories, and AI results.
Add to Preferred Sources