
You have probably seen this happen. A company reports earnings, the stock jumps 10%, but the options traders who bet on that move still lose money. We see many intermediate traders attempt a straddle before earnings, only to watch their account balances shrink the morning after the announcement. The culprit is almost always a misunderstanding of how options are priced around binary events. In this guide, we will walk you through exactly why these trades often fail and how to fix your approach. By the end, you will know how to calculate expected moves, choose the correct strikes, and decide whether to buy or sell volatility. Our team recommends mastering these mechanics before risking real capital on an earnings announcement.
What Is IV Crush and Why Does It Kill Earnings Straddles?
Bottom Line: The core lesson of this article is that buying a straddle before earnings is not simply a bet on a big move. It is a bet that the actual move will exceed what the options market has already priced in. Traders who understand IV crush, calculate the expected move, and match their strategy to the current IV percentile will make far better decisions than those who simply buy options and hope for a surprise. Mastering these mechanics before trading earnings with real capital is the difference between a repeatable edge and an expensive lesson.
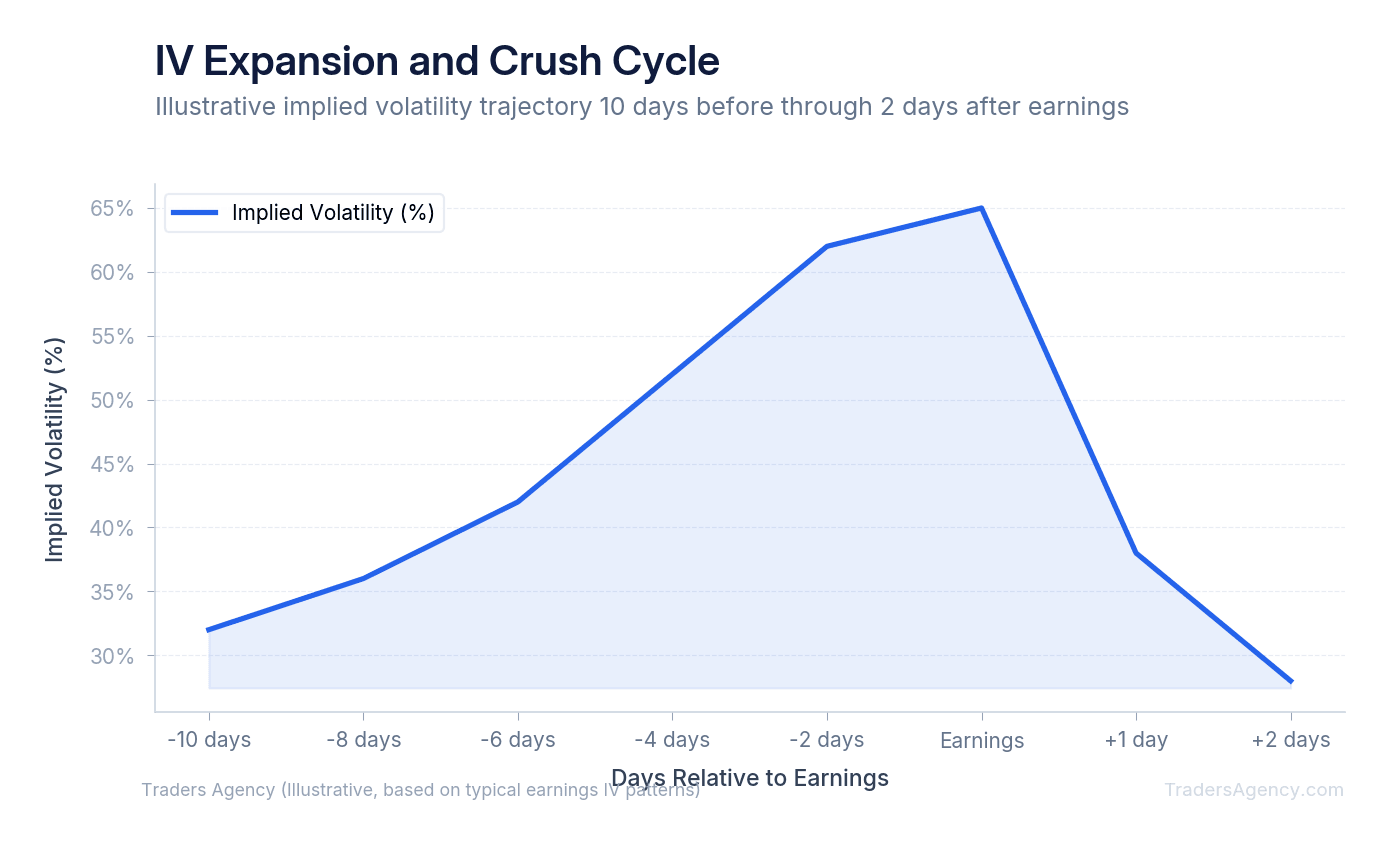
IV crush is the rapid decline in implied volatility that occurs immediately after a known binary event like an earnings report. This sudden drop in volatility drains the extrinsic value from options contracts, which often causes buyers of an earnings straddle to lose money even if the stock moves.
Implied volatility represents the market's expectation of future price swings. In the weeks leading up to an earnings report, uncertainty builds. Traders do not know if the company will beat revenue estimates or lower future guidance. This uncertainty causes demand for options to rise, which inflates the premium of both calls and puts. This phenomenon is known as pre-earnings IV expansion.
The moment the earnings numbers are released to the public, the uncertainty vanishes. The market instantly digests the new information, and implied volatility collapses back to its normal baseline. This rapid deflation strips the inflated premium out of the options contracts.
If you own a long straddle, this volatility drop works directly against you. The underlying stock must move far enough in one direction to generate enough intrinsic value to offset the massive loss in extrinsic value. If the stock stays relatively flat, both the call and the put will lose significant value at the opening bell.
Key Concept: IV crush is the rapid collapse of implied volatility after earnings are announced. Even if the stock moves in your favor, the loss of extrinsic value can wipe out your position's profitability.
How Does a Long Straddle Before Earnings Work?
A long straddle before earnings works by purchasing an at-the-money call and an at-the-money put with the exact same expiration date. This strategy profits only if the underlying stock makes a massive directional move that exceeds the total premium paid, overcoming the inevitable post-earnings volatility drop.
We teach our members to view a long straddle as a bet on extreme volatility. You are not guessing direction. You are simply betting that the market is underestimating the magnitude of the upcoming move.
The Trade Setup
Here is a concrete example. Imagine ticker symbol XYZ is trading at exactly $100 per share two days before its earnings report. You decide to deploy a long straddle.
| Parameter | Value |
|---|---|
| Underlying | XYZ at $100 |
| Call Purchased | $100 strike, $5.00 premium |
| Put Purchased | $100 strike, $5.00 premium |
| Total Debit | $10.00 ($1,000 per contract pair) |
| Upside Breakeven | $110 (strike + premium) |
| Downside Breakeven | $90 (strike - premium) |
Calculating the Breakeven Points
Because you paid $10.00 in total premium, the stock must move more than $10 in either direction for you to make a profit. Your upside breakeven is $110 (the $100 strike plus the $10 premium). Your downside breakeven is $90 (the $100 strike minus the $10 premium). If the stock opens anywhere between $90 and $110 the morning after earnings, the trade will result in a loss.
The Outcome Scenarios
| Scenario | Stock Opens At | Call Value | Put Value | Net P/L |
|---|---|---|---|---|
| Large Drop (Guidance Cut) | $80 | $0.00 | $20.00 | +$1,000 |
| Moderate Move (Average Report) | $102 | ~$2.00 | $0.00 | -$800 |
| Flat (In-Line Numbers) | $100 | ~$0.10 | ~$0.10 | -$980 |
Notice the second scenario carefully. The stock moved up 2%, yet you still suffered an $800 loss. That is IV crush at work. The extrinsic value evaporated overnight, leaving you with almost nothing.
How Do You Calculate the Expected Move Before a Report?
You calculate the expected move before an earnings report by adding the price of the at-the-money call and the at-the-money put for the nearest expiration date. This combined premium approximates the dollar amount the options market expects the stock to move up or down after the announcement.
Market makers use complex pricing models to determine option premiums. These models directly factor in binary events like earnings. By looking at the at-the-money straddle price, you can reverse-engineer the market's prediction. You can find more detail on how options pricing works on the Cboe Options Exchange education center.
For example, if ticker ABC is trading at $150, you look at the options expiring in three days. The $150 call costs $6.00 and the $150 put costs $6.00. The total straddle price is $12.00.
Divide that $12.00 by the $150 stock price. The market is pricing in an expected move of exactly 8%. If you buy this straddle, you are betting the stock will move more than 8%. If you sell premium, you are betting it will move less than 8%.
Key Concept: The expected move can be approximated by the at-the-money straddle price. Divide that number by the stock price to get the expected percentage move. This single calculation tells you what the market is pricing in.
Strike Selection Methodology
We prefer to use the expected move to guide our strike selection for other strategies. If the expected move is $12, we know the market defines the "normal" post-earnings range as $138 to $162. Traders can use this data to place short strikes just outside the expected move. This mathematical approach removes emotion from the trading process and relies strictly on market-generated data.
Strangles vs. Straddles: Which Earnings Play Costs Less?
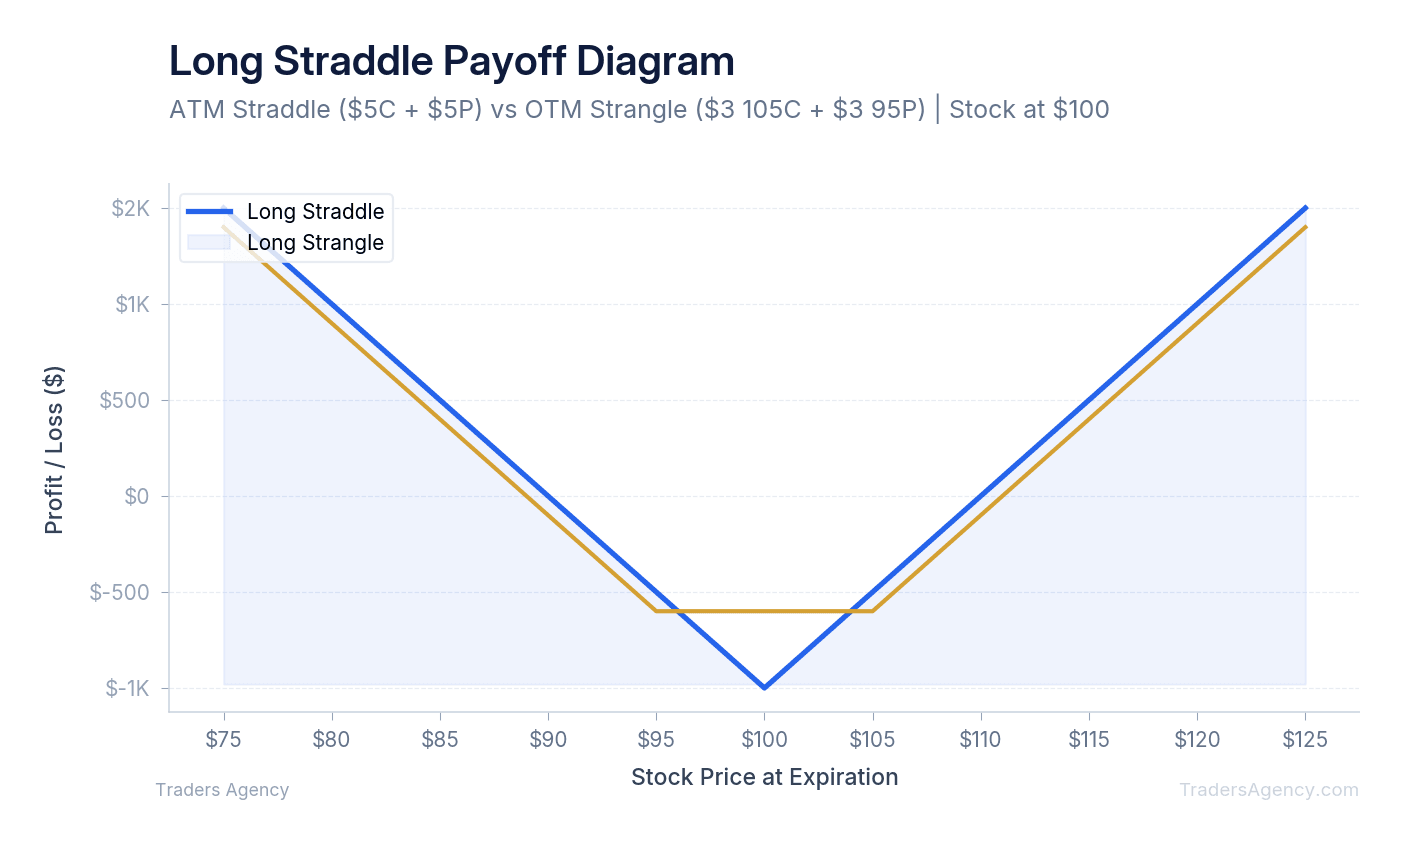
A long strangle costs less than a long straddle because it uses out-of-the-money options instead of expensive at-the-money options. While the strangle requires less upfront capital to execute, the underlying stock must make a significantly larger percentage move to reach profitability and overcome the post-earnings volatility crush.
With a strangle, you buy a call above the current stock price and a put below the current stock price. Because these options have no intrinsic value at the time of purchase, their premiums are cheaper.
| Parameter | Long Straddle | Long Strangle |
|---|---|---|
| Stock Price | $100 | $100 |
| Strikes | $100 call / $100 put | $105 call / $95 put |
| Total Cost | $10.00 | $4.00 |
| Upside Breakeven | $110 | $109 |
| Downside Breakeven | $90 | $91 |
| Max Loss | $1,000 | $400 |
The lower cost means your maximum potential loss is smaller. However, the stock now has to move past $109 or drop below $91 just to break even. We teach our members that cheaper options do not automatically mean better odds of success. The breakeven range on a strangle can be deceptively wide.
Want expert trading insights delivered daily?
Join thousands of traders who rely on Traders Agency for market analysis and trade ideas.
Join Traders AgencyDo Buyers or Sellers of Volatility Win More Often at Earnings?
Many intermediate traders eventually realize that buying a straddle before earnings is an uphill battle. The math heavily favors the option sellers during binary events.
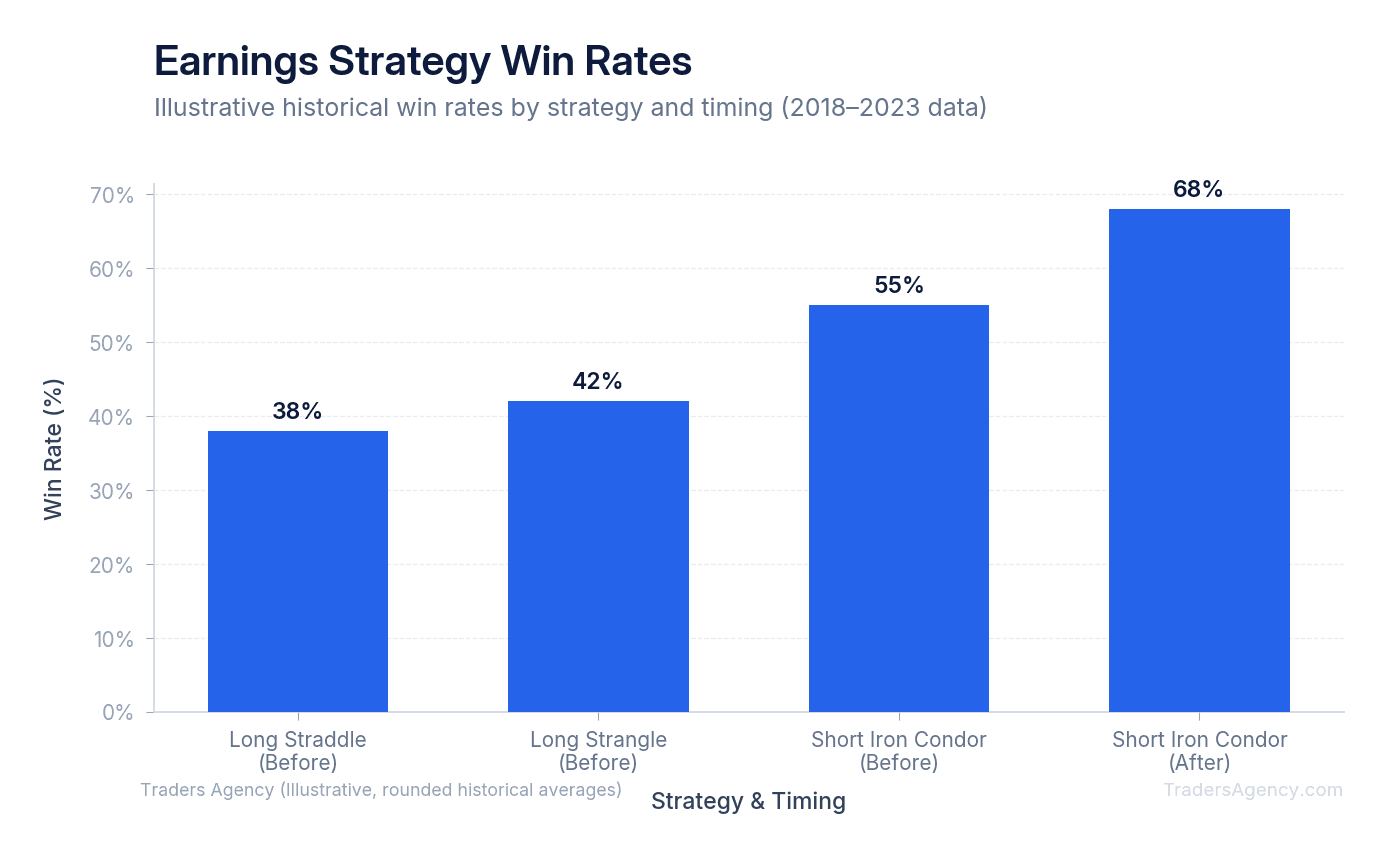
When you buy a straddle or a strangle, you are buying volatility. You need the stock to exceed the expected move. Historical data shows that stocks stay within their expected earnings move roughly 70% to 75% of the time.
This means that buying volatility strategies mathematically carry a lower win rate. The market makers intentionally price the options wide enough to account for the average historical earnings surprise. To win consistently as a buyer, you must possess an edge in predicting outlier moves.
Selling volatility flips the math in your favor. Strategies like the short iron condor or short strangle profit when the stock stays inside the expected move. Because IV crush destroys option values the morning after earnings, sellers can buy back their short contracts for pennies on the dollar.
When Should You Sell an Iron Condor Into Earnings?
You should sell an iron condor into earnings when implied volatility is exceptionally high and you expect the stock to stay within its expected move. This short volatility strategy profits directly from IV crush by collecting premium from out-of-the-money options that expire worthless after the earnings announcement.
An iron condor consists of selling an out-of-the-money call spread and an out-of-the-money put spread simultaneously. It is a defined-risk strategy, meaning you know your exact maximum loss before you enter the trade.
Step-by-Step: Setting Up and Managing an Iron Condor
- Identify the Setup: Assume ticker DEF is trading at $200. You calculate the expected move and find it is $15. This gives you an expected range of $185 to $215. To capture IV crush, you place your short strikes just outside this expected range.
- Execute the Trade: Sell the $215 call and buy the $220 call for protection. On the downside, sell the $185 put and buy the $180 put for protection. You collect a total credit of $1.50 (or $150 per contract) to open this four-leg position. The width of your spreads is $5.00. Your maximum risk is the width of the spread minus the credit received: $3.50 (or $350).
- Evaluate the Post-Earnings Outcome: The next morning, DEF announces earnings and the stock opens at $205. The stock stayed well within the expected move. Because the binary event has passed, implied volatility drops instantly. All four of your options lose nearly all their value. You can let them expire worthless on Friday and keep the entire $150 credit as profit.
| Parameter | Value |
|---|---|
| Underlying | DEF at $200 |
| Expected Move | $15 (range: $185 to $215) |
| Call Spread Sold | $215/$220 call spread |
| Put Spread Sold | $185/$180 put spread |
| Credit Collected | $1.50 ($150 per contract) |
| Max Risk | $3.50 ($350 per contract) |
| Max Profit | $1.50 ($150 per contract) |
Watch Out: If the stock had blown past $220 or dropped below $180, your losses would be capped at $350 per contract. Defined risk protects you from catastrophic outcomes, but the loss is still more than double the premium collected.
How Do You Choose the Right Earnings Strategy Based on IV Percentile?
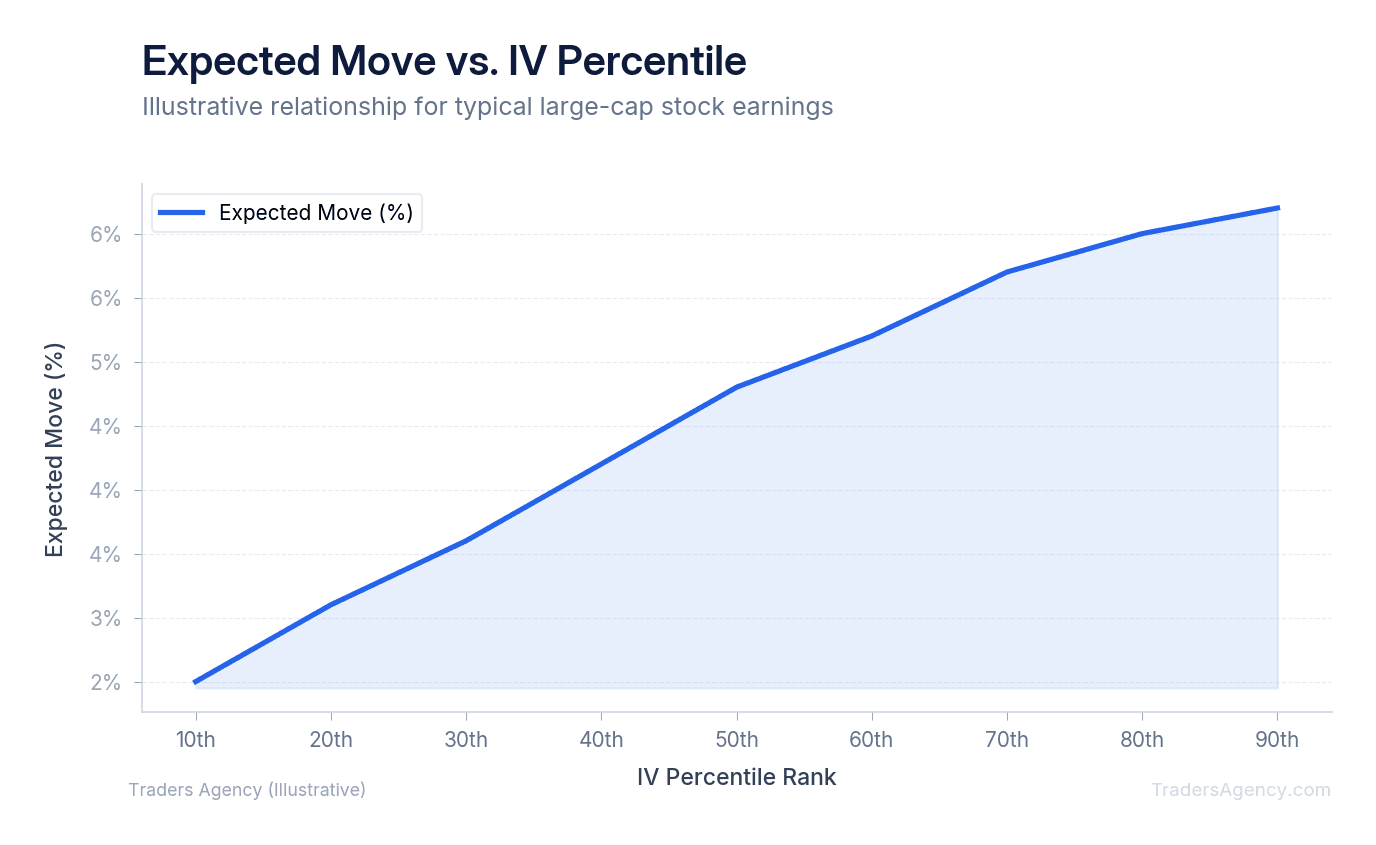
Our team recommends using a metric called IV Percentile (IVP) or IV Rank (IVR) to decide which strategy to deploy. These metrics compare a stock's current implied volatility to its own historical volatility over the past year.
An IV Percentile of 90 means the current volatility is higher than it has been 90% of the time over the last 52 weeks. An IV Percentile of 10 means volatility is exceptionally low.
Strategy Selection Rules
We prefer to follow a strict, rules-based approach when trading earnings. Here is what we teach our members:
- IV Percentile below 30: Consider buying a straddle or strangle. Options are relatively cheap, and the risk of a massive IV crush is lower.
- IV Percentile between 30 and 70: Avoid earnings trades entirely, or use directional debit spreads. The risk-to-reward ratio for pure volatility plays is poor in this middle zone.
- IV Percentile above 70: Consider selling an iron condor. Options are historically expensive, making it the perfect environment to profit from a severe IV crush.
Key Concept: IV Percentile is your decision filter. Low IVP favors buying volatility. High IVP favors selling volatility. The middle zone is a no-trade zone for pure volatility strategies.
Risk Management and Position Sizing
Trading earnings is inherently risky because stocks can gap up or down overnight. Stop losses are completely ineffective during overnight gaps. If a stock closes at $100 and opens at $70 the next morning, your $90 stop loss will execute at $70, resulting in maximum pain.
Because stop losses cannot protect you during earnings announcements, position sizing is your only true defense. We strongly advise allocating no more than 1% to 2% of your total account capital to any single earnings trade.
If you buy a straddle before earnings, assume the entire premium paid could go to zero. If you sell an iron condor, assume you could take the maximum defined loss. By keeping your position sizes small, you can survive the inevitable outlier moves and trade another day.
Risk Warning: Earnings gaps can be extreme and unpredictable. No stop loss will save you from an overnight gap. Size every earnings trade as if the maximum loss will happen, because eventually it will.
The Traders Agency education team publishes new strategy guides and market analysis every week. If you want to sharpen your options trading skills and get access to live training with our team, we would love to have you in the community.
Want expert trading insights delivered daily?
Join thousands of traders who rely on Traders Agency for market analysis and trade ideas.
Join Traders AgencyKey Takeaways
- IV crush drains extrinsic value from options immediately after earnings, meaning a stock can move 10% and straddle buyers can still lose money if the move was already priced into the premium.
- Pre-earnings IV expansion inflates both call and put premiums as uncertainty builds in the weeks before a report, making timing of entry critical for buyers.
- Calculating the expected move before placing a straddle tells you exactly how far the stock needs to travel for the trade to profit, a step many intermediate traders skip.
- IV percentile is a key filter for strategy selection: high IV percentile environments tend to favor selling volatility structures like iron condors, while low IV percentile environments favor buying straddles or strangles.
- Position sizing is the last line of defense on earnings trades. Because overnight gaps cannot be stopped out, every earnings position should be sized as if the maximum loss is the guaranteed outcome.
DISCLAIMER: Traders Agency does not offer financial advice. The information provided is for educational purposes only and should not be considered financial advice. Traders Agency is not responsible for any financial losses or consequences resulting from the use of the information provided. Trading carries inherent risks and may not be suitable for all individuals. You are advised to conduct your own research and seek personalized advice before making any investment decisions, recognizing the potential risks and rewards involved.
See more from Traders Agency on Google
Make us a preferred source and our market analysis will appear more prominently in your Google Search, Top Stories, and AI results.
Add to Preferred Sources