
You've probably seen this happen. You spot a perfect technical breakout on a daily chart, enter the trade, and watch price immediately reverse and chop sideways for hours. Traditional volume bars at the bottom of your screen only tell you when trading happened, not where the actual liquidity sits. Volume profile analysis is an advanced charting technique that displays trading activity at specific price levels, revealing exactly where institutions are accumulating positions and where price will likely experience rapid expansion. In this guide, our education team will show you how to apply a professional volume profile trading strategy to your daily routine. By the end, you'll know how to identify hidden support and resistance, manage risk around low volume nodes, and execute trades with institutional-grade precision.
What Is Volume Profile Analysis?
Bottom Line: Volume profile analysis gives traders a structural edge that standard time-based volume bars cannot provide: a precise view of where institutions have built positions and where price is likely to accelerate or stall. The practical application comes down to identifying HVNs as high-conviction support and resistance zones, treating LVNs as fast-move corridors, and always validating Session Profile signals against the Composite Profile. Traders who internalize these structures stop chasing breakouts and start trading the levels that actually matter to institutional participants.
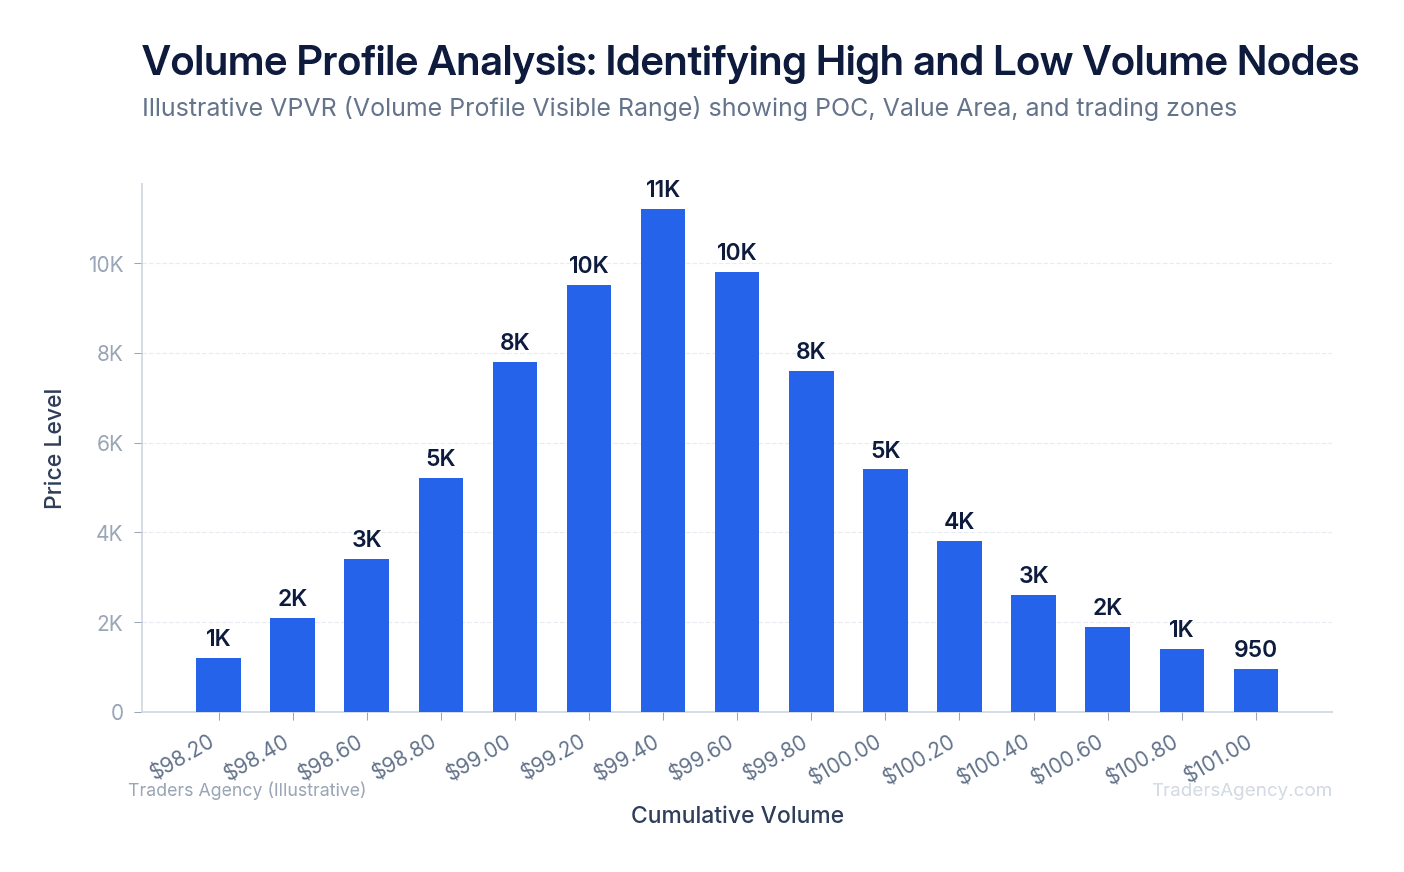
Volume profile analysis is a technical methodology that measures the total volume traded at every individual price level rather than during a specific time interval. This creates a horizontal histogram on your chart, allowing you to instantly identify the exact price zones where the most significant market participation occurred.
We teach our members that traditional volume is like a clock, while volume profile is like a map. A standard volume bar tells you 10,000 contracts traded at 10:00 AM. A volume profile tells you 10,000 contracts traded exactly at $4,150.25.
This distinction matters heavily for experienced traders. Institutions build positions at specific prices, not at specific times. When you use a volume profile analysis chart, you stop guessing where the big players are defending their positions. You can clearly see the exact price levels where heavy accumulation or distribution took place.
Key Concept: Volume profile plots traded volume on the vertical (price) axis instead of the horizontal (time) axis. This horizontal histogram reveals where institutional money is positioned, giving you a structural edge that traditional volume bars simply cannot provide.
You can find basic versions of this tool on most modern charting platforms. If you're looking for a free setup, platforms like TradingView offer basic visible range profiles to get you started.
Key Components of Volume Profile
The core components include the Point of Control (POC), the Value Area, and Volume Nodes. Understanding these components is mandatory for any advanced trader.
The Point of Control (POC) represents the single price level with the highest traded volume. It acts like a gravitational pull for price action. If price moves away from the POC on low volume, it frequently snaps back to this high-liquidity anchor.
The Value Area highlights the price range where 70% of the total trading volume took place during the specified period. This mirrors one standard deviation in a normal distribution. We define the top of this range as the Value Area High (VAH) and the bottom as the Value Area Low (VAL).
When price is accepted inside the Value Area, we expect it to rotate back and forth between the VAH and VAL. When price breaks and holds outside the Value Area, it signals a potential trend day.
How to Read a Volume Profile Chart
Reading this chart requires a shift in perspective. Instead of looking left to right for time, you look up and down for liquidity. Here are the specific steps our team uses to read the profile daily:
- Locate the POC: Find the single longest horizontal line. This is your baseline fair value for the session.
- Identify the Value Area: Look for the shaded region containing 70% of the volume. Mark the VAH and VAL on your chart.
- Spot the Edges: Find where the thick volume nodes sharply drop off into thin volume nodes. These edges are your primary breakout triggers.
- Determine Market Context: If the current price is above the Value Area, buyers are in control. If it is below, sellers are in control.
What Is the Difference Between High Volume Nodes and Low Volume Nodes?
We categorize the horizontal histogram peaks and valleys into two distinct types. High Volume Nodes (HVNs) are the peaks where significant trading occurred. Low Volume Nodes (LVNs) are the valleys where price moved quickly with minimal participation.
HVNs represent areas of fair value. Buyers and sellers agreed to transact heavily at these prices. Because of this heavy positioning, HVNs act as massive speed bumps for price action. We use them as our primary support and resistance targets.
LVNs represent areas of unfair value or aggressive price discovery. Since very few shares or contracts changed hands here, there is no liquidity to stop price from moving.
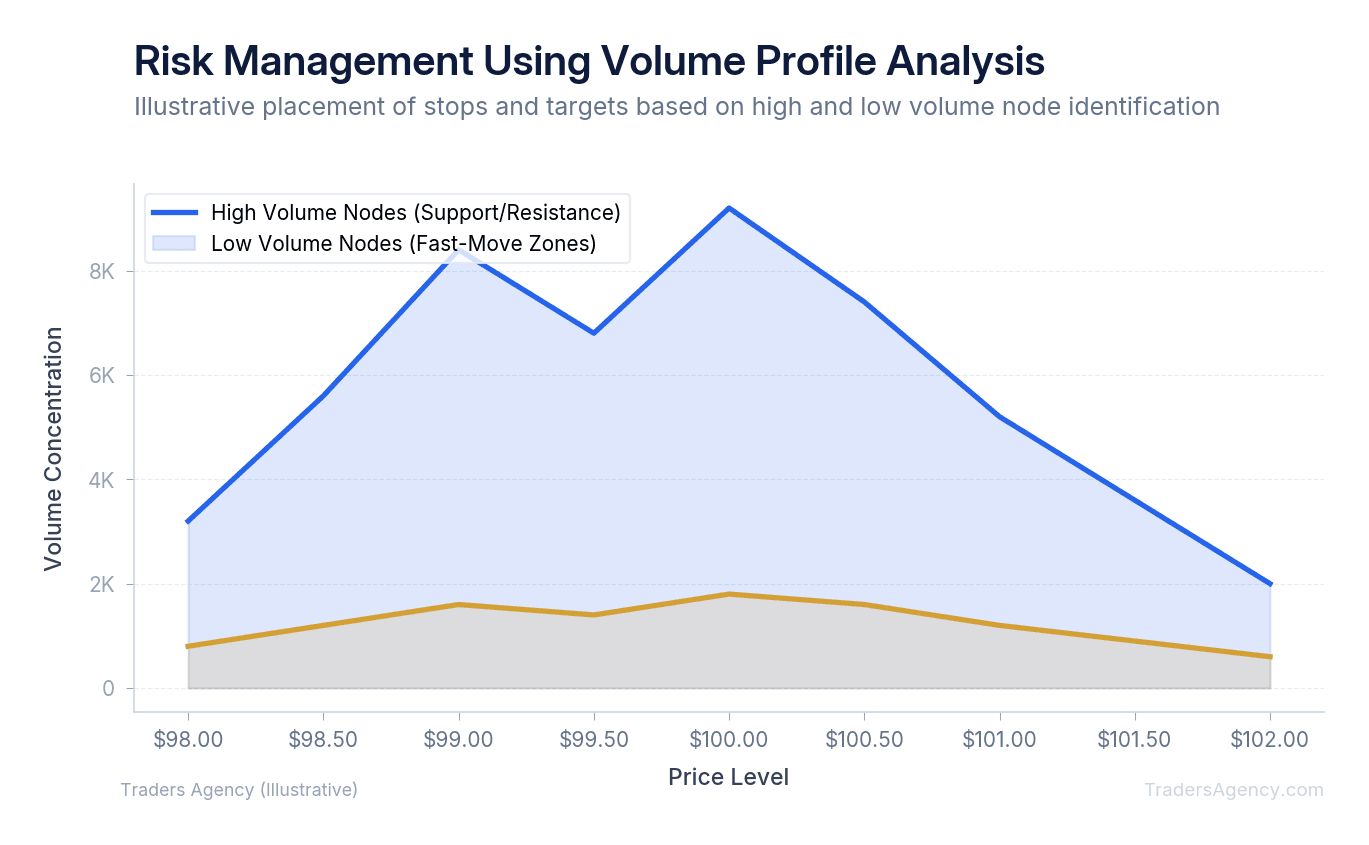
When price enters an LVN, it typically accelerates rapidly through the zone until it finds the next HVN. We teach our traders to use LVNs as fast-move zones for breakout trades. You'll often see LVNs referred to as liquidity voids or air pockets in professional trading literature.
Key Concept: Think of HVNs as walls and LVNs as hallways. Price slows down and reverses at walls (HVNs), but sprints through hallways (LVNs). Knowing which zone price is entering gives you a massive edge on trade management.
When Should You Use a Session Profile vs. a Composite Profile?
Advanced traders must distinguish between micro and macro volume structures. A Session Profile measures volume for a single trading day. A Composite Profile aggregates volume across multiple days, weeks, or months.
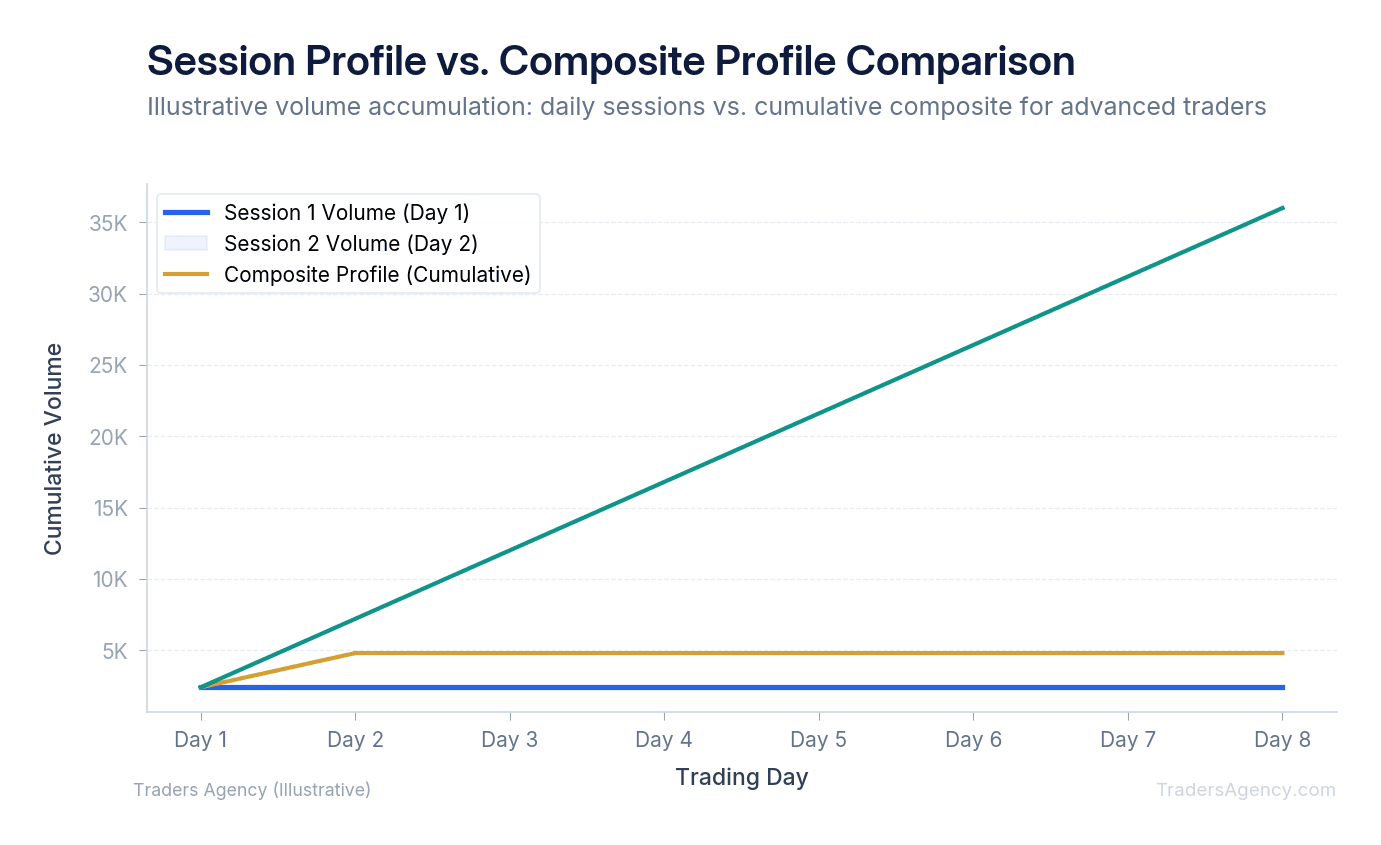
We prefer to use the Session Profile for intraday mean reversion trades. For example, if the S&P 500 futures open out of balance, we look at the previous day's Session Profile to find immediate intraday targets.
We use the Composite Profile for swing trading and macro context. A 30-day Composite Profile reveals the larger institutional accumulation zones. If you're building a volume profile strategy playbook, you must include both timeframes.
Watch Out: A common mistake is trading a Session Profile breakout right into a massive Composite Profile HVN. The higher timeframe volume structure will almost always overpower the lower timeframe signal. Always check the macro context before pulling the trigger.
Want expert trading insights delivered daily?
Join thousands of traders who rely on Traders Agency for market analysis and trade ideas.
Join Traders AgencyHow Do You Execute a Trade Using Volume Profile Analysis?
We'll walk through a specific, multi-step example using the SPDR S&P 500 ETF Trust (SPY). Assume the 10-day Composite Profile shows a massive HVN and POC at $510.50. The market opens at $508.00 and begins to rally.
- Identify the Setup and Conditions: We look for price to approach the $510.50 POC from below. The volume profile shows a thin LVN between $508.50 and $510.00. This tells us price should move quickly up to the $510.50 magnet.
- Execute the Entry: We do not buy the rally through the LVN. Instead, we wait for price to hit the $510.50 POC and show signs of exhaustion on the order flow tape. We enter a short position at $510.40, anticipating a rejection at this heavy resistance node.
- Manage Risk and Targets: We place our stop loss just above the HVN at $511.10. If price accepts above the HVN, our thesis is wrong. We set our primary profit target back at the Value Area Low of $508.50.
| Parameter | Value |
|---|---|
| Instrument | SPY |
| Entry (Short) | $510.40 |
| Stop Loss | $511.10 (above HVN) |
| Profit Target | $508.50 (Value Area Low) |
| Risk per Share | $0.70 |
| Reward per Share | $1.90 |
| Risk-to-Reward Ratio | 1 : 2.71 |
This provides a highly asymmetric risk-to-reward ratio. We risk $0.70 to make $1.90. This type of granular risk management is consistent with the institutional-grade frameworks taught by organizations like the CME Group.
Combining Volume Profile with Other Indicators
Volume profile should not exist in a vacuum. We combine it with other tools to filter out false signals and build higher conviction setups.
Our preferred combination pairs the Visible Range Volume Profile (VRVP) with VWAP (Volume Weighted Average Price). When a daily VWAP aligns perfectly with a Composite POC, that price level becomes an institutional fortress.
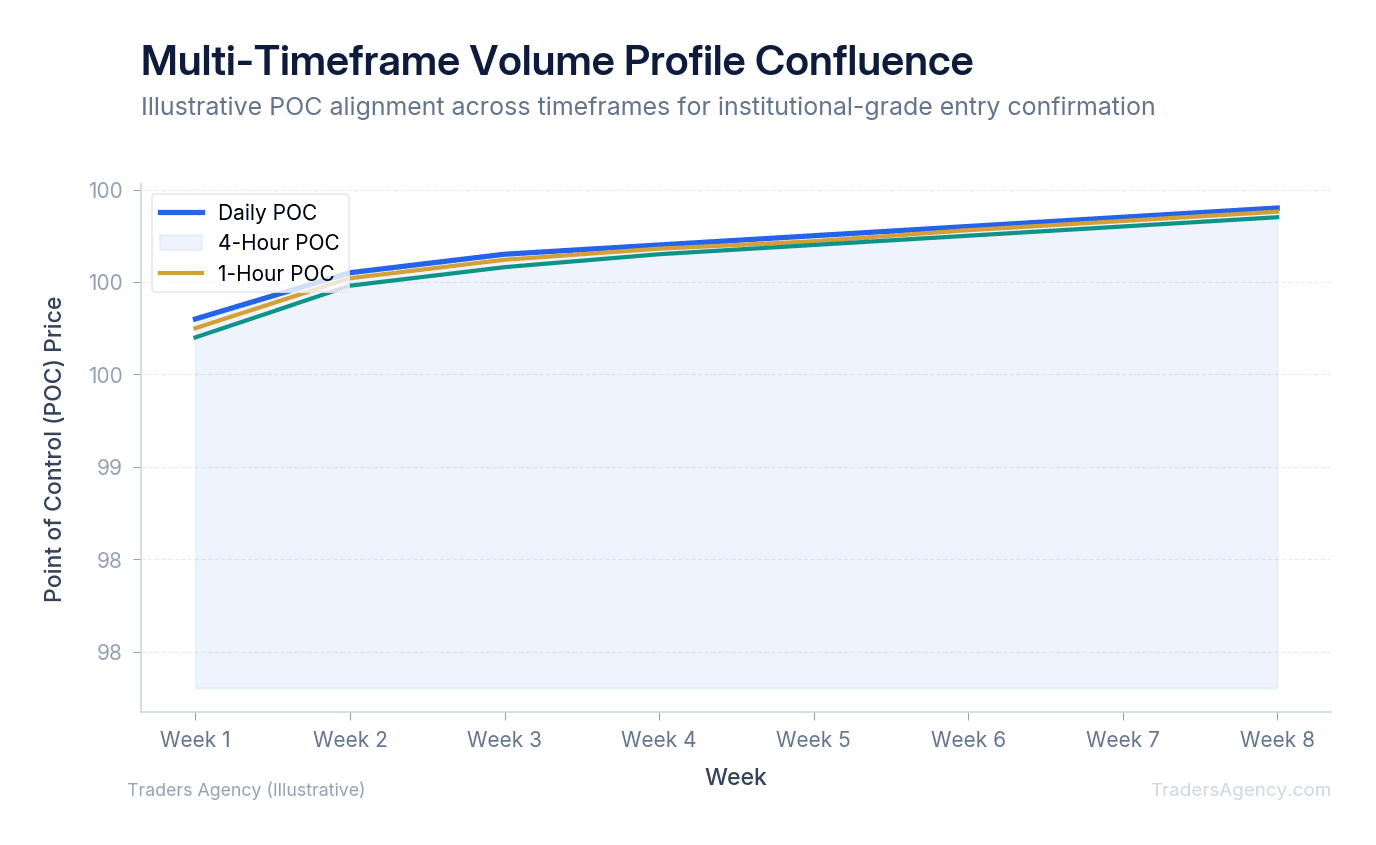
We also use multi-timeframe confluence. If the 1-hour chart shows an LVN breakout, but the daily chart shows price running directly into a massive 90-day POC, we skip the trade. The higher timeframe volume structure will almost always overpower the lower timeframe signal.
Applying Volume Profile to Options Strategies
When our team trades options, we use volume profile to define our strike prices with mathematical precision. Here's an example using a short put spread on Apple (AAPL).
Assume AAPL is trading at $175.00. The 30-day Composite Profile shows a massive HVN acting as support at $170.00. Below $170.00, there is a large LVN dropping straight down to $165.00. We want to sell a credit spread below that $170.00 liquidity wall.
| Parameter | Value |
|---|---|
| Strategy | Bull Put Spread |
| Sell Strike | $167.50 Put (inside the LVN, below HVN support) |
| Buy Strike | $165.00 Put (protective leg) |
| Expiration | 30 days out |
| Premium Collected | $0.65 per contract ($65 total) |
| Max Gain | $65 (if AAPL stays above $167.50) |
| Max Loss | $185 (if AAPL falls below $165.00) |
| Breakeven | $166.85 |
Because the $170.00 HVN requires massive selling pressure to break, our $167.50 short strike is highly protected. If price does break $170.00, the LVN means price will likely slice straight down to $165.00. This fast-move zone is exactly why we buy the protective put at $165.00 to cap our risk.
Market Profile vs. Volume Profile: What's the Difference?
Many traders confuse these two concepts. Market profile measures time spent at a price level using Time Price Opportunity (TPO) letters, while volume profile measures the actual number of shares or contracts traded at that price. Market profile tracks time distribution. Volume profile tracks actual liquidity and transaction volume.
Market profile prints a new letter on the chart for every 30-minute period price spends at a specific level. If price sits at $150.00 for three hours on very low volume, market profile will show a massive peak because of the time spent there. Volume profile will show a tiny node because very few shares actually traded.
We strongly prefer volume profile for modern markets. In today's algorithmic trading environment, actual volume traded is a much more reliable metric than time spent. If you're downloading educational resources from trading forums, make sure they explicitly cover volume data, not just TPO charts.
Watch Out: A TPO-heavy price level with low actual volume is a trap. It looks like strong support or resistance on a market profile chart, but volume profile reveals there's no real institutional commitment there. Always confirm with actual volume data.
Putting It All Together
Mastering these concepts takes screen time and patience. Here's how we recommend you start building volume profile into your daily workflow:
- Map out the Value Area and POC on your favorite daily charts each morning.
- Watch how price reacts when it transitions from an LVN into an HVN.
- Layer in VWAP and check for multi-timeframe confluence before entering any trade.
- Always check the Composite Profile before acting on a Session Profile signal.
- Once you trust the mechanics, begin sizing up your positions around these high-probability liquidity zones.
The Traders Agency education team publishes new strategy guides and market analysis every week. Volume profile analysis is one of the most powerful tools in a professional trader's toolkit, and the more time you spend studying these structures, the more clearly you'll see the institutional footprint on your charts.
Want expert trading insights delivered daily?
Join thousands of traders who rely on Traders Agency for market analysis and trade ideas.
Join Traders AgencyKey Takeaways
- Volume profile displays total volume traded at specific price levels (e.g., $4,150.25) rather than during time intervals, giving traders a map of where liquidity actually sits instead of when it moved.
- High Volume Nodes (HVNs) act as price magnets and support/resistance zones because institutions accumulated positions there, making them reliable areas to anticipate slowing or reversing price action.
- Low Volume Nodes (LVNs) signal price inefficiency: when price enters these thin zones, it tends to move rapidly through them, which creates both breakout opportunities and elevated stop-loss risk.
- Session Profiles should always be cross-referenced against the Composite Profile before acting on a signal, since a level that looks significant intraday may carry little weight in the broader market structure.
- Layering VWAP and multi-timeframe confluence on top of volume profile levels improves trade quality by confirming that a high-probability liquidity zone aligns with broader institutional positioning.
DISCLAIMER: Traders Agency does not offer financial advice. The information provided is for educational purposes only and should not be considered financial advice. Traders Agency is not responsible for any financial losses or consequences resulting from the use of the information provided. Trading carries inherent risks and may not be suitable for all individuals. You are advised to conduct your own research and seek personalized advice before making any investment decisions, recognizing the potential risks and rewards involved.
See more from Traders Agency on Google
Make us a preferred source and our market analysis will appear more prominently in your Google Search, Top Stories, and AI results.
Add to Preferred Sources