
A gap trading strategy identifies price discontinuities between one session's close and the next session's open, then positions for either continuation or reversal of that move. Gaps form when overnight news, earnings surprises, or order-flow imbalances push the opening price away from where the previous session settled, leaving a visible "hole" on the chart. We teach gaps as one of the cleanest structural signals in daily and intraday trading, because they represent a real supply-demand shift rather than a lagging indicator smoothing out old data.
You've probably watched a stock open 4% higher on earnings, only to see it bleed back to unchanged by 10:30 AM. Or you've seen the opposite: a stock gaps up, holds every dip, and closes near the highs. The difference between those two outcomes is not random, and traders who understand the types of gaps in trading can usually tell which scenario they're looking at within the first fifteen minutes of the session.
This guide is built for traders who already know how to read a chart and place a trade. We're going past the basic definition and into the mechanics: how to classify a gap correctly, how to read pre-market volume for confirmation, and how to size and structure positions the way a professional desk would. By the end, you'll have a repeatable framework for deciding whether to fade a gap, ride it, or leave it alone entirely.
What Is Gap Trading?
Bottom Line: A gap trading strategy works because gaps reflect a real shift in supply and demand, not a lagging signal. Classifying the gap type correctly and confirming with pre-market volume determines whether to fade, ride, or skip the trade, and disciplined risk sizing is what separates professional execution from guesswork.
Gap trading is the practice of entering positions based on the size, type, and context of a price gap between sessions, rather than waiting for a moving average cross or a lagging oscillator signal. It works because gaps often mark a genuine shift in supply and demand that other indicators only detect after the fact.
The logic is straightforward once you strip away the noise. A gap means every buyer and seller who wanted to transact at the old price is now locked out, and the market has to find a new equilibrium in real time. That repricing creates directional momentum in the first few minutes of trading, and how that momentum behaves tells you what kind of gap you're dealing with.
Retail traders often treat all gaps the same way, which is the single biggest mistake we see. A gap trading strategy for beginners usually starts and ends with "buy the gap up, sell the gap down." At an advanced level, the real skill is classification: knowing whether the gap in front of you is a low-conviction noise event or a structural break that institutions are actively building positions around.
Key Concept: A gap is not a signal by itself. The tradable information lives in the combination of gap type, volume, and trend context. Classify first, then trade.
Why This Matters More at the Open Than Anywhere Else
The opening range is where the most information gets priced in with the least liquidity, which is exactly why gaps are tradable. Market makers are still finding a clearing price, retail order flow is dumping in at the bell, and institutional algorithms are working large orders against a thin book. That combination creates the exploitable edge, and it's also what makes gap trading unusually risky if you're not reading volume and context correctly.
How Does Gap Trading Work at an Advanced Level?
At an advanced level, gap trading works by layering three filters on top of the raw price gap: gap classification, pre-market volume confirmation, and relative strength against the sector or index. Skip any one of these filters and you're trading a coin flip with extra steps.
- Filter 1: Classification. Decide which of the four gap types you're looking at before you think about direction. We cover the full breakdown in the next section.
- Filter 2: Volume confirmation. A gap on 150% of average pre-market volume carries far more information than the identical gap on 40% of average volume.
- Filter 3: Relative strength. If a single name gaps up 3% but its entire sector is also up 3%, that's a market-wide move, not an idiosyncratic signal, and it should be traded differently or skipped as a standalone gap play.
We also watch the first 15-minute range as a decision point. If price holds above the gap-up open through the first candle close on a 15-minute chart, continuation odds improve meaningfully. If price immediately fills back through the open, that's often the market rejecting the initial move, which is a fade signal. This is the nuance that separates a mechanical gap trading strategy example from a genuinely adaptive process.
What Are the Types of Gaps in Trading?
There are four primary types of gaps, and each one implies a different probability of follow-through: common gaps, breakaway gaps, runaway (measuring) gaps, and exhaustion gaps. Knowing which one you're looking at before you place a trade is the highest-leverage skill in this entire strategy.
1. Common Gaps
Common gaps happen inside an existing trading range with no major news driver. They usually fill within one to three sessions because there's no fundamental reason for the new price level to hold. We treat these as low-priority setups unless volume confirms something unusual.
2. Breakaway Gaps
Breakaway gaps occur when price gaps out of a well-defined consolidation range, typically on a news event or earnings surprise. These mark the start of a new trend and tend to have the lowest gap-fill rate of the four types because they represent a genuine repricing event. Volume on a true breakaway gap is almost always well above average.
3. Runaway (Measuring) Gaps
Runaway gaps, also called measuring gaps, appear in the middle of an established trend and signal that the move still has room to run. Technicians measure the distance from the start of the trend to the runaway gap, then project that same distance from the gap itself for a rough target. These hold better than common gaps but not as well as breakaways.
4. Exhaustion Gaps
Exhaustion gaps show up after an extended trend, often on a final volume spike, and mark the last gasp of buying or selling pressure before a reversal. These are the gaps most likely to fill quickly, and they're the setups we watch most closely for fade opportunities.
| Gap Type | Where It Appears | Volume Signature | Short-Term Fill Odds | Preferred Play |
|---|---|---|---|---|
| Common | Inside a range | Average or below | High | Fade or skip |
| Breakaway | Out of consolidation | Well above average | Low | Gap and go |
| Runaway | Mid-trend | Above average | Moderate | Gap and go |
| Exhaustion | End of extended trend | Spike, then dries up | Very high | Fade |
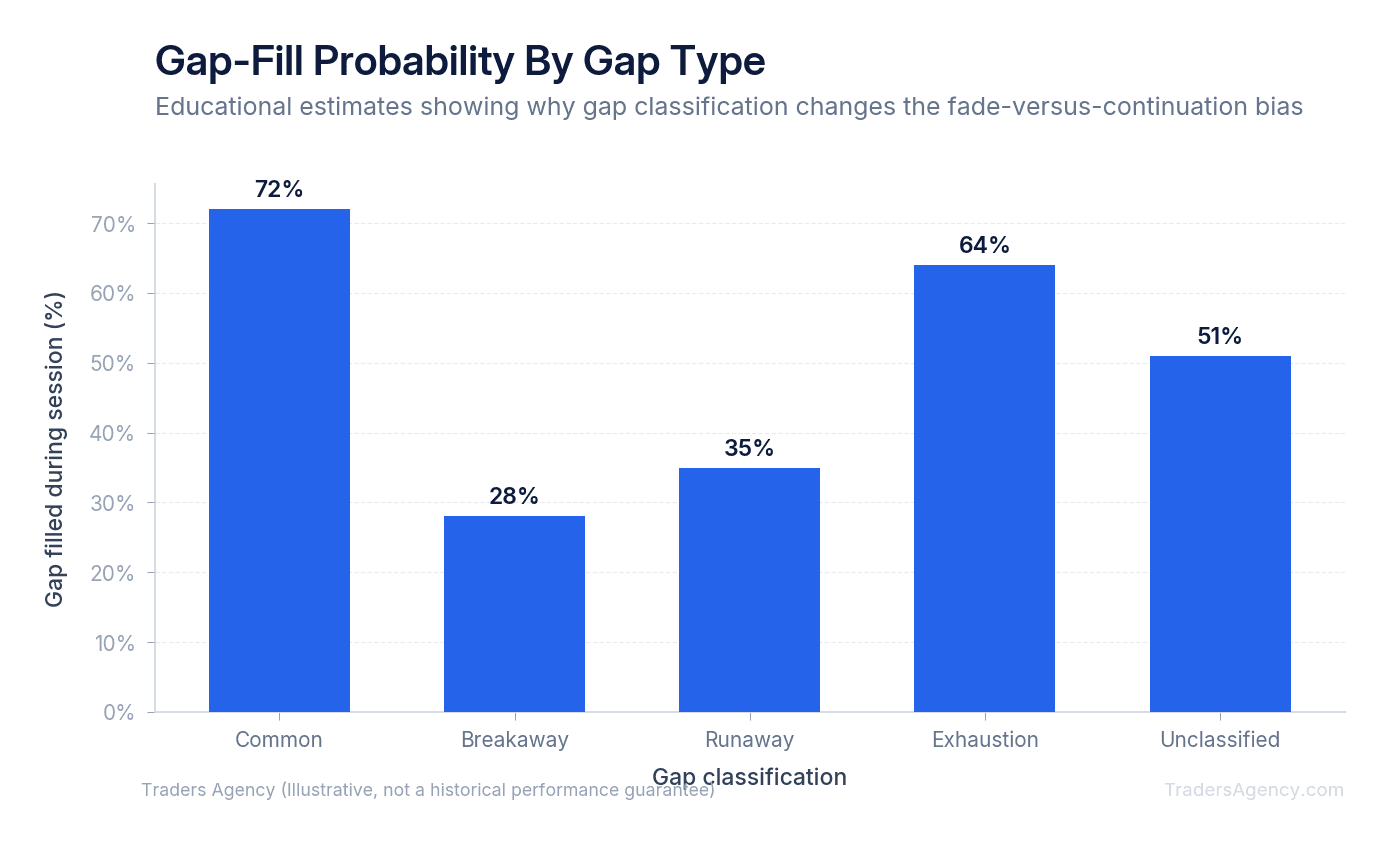
What Is the Gap Fill Probability by Gap Type?
Gap fill probability is the likelihood that price retraces all the way back to the pre-gap closing price within a defined window, typically the same session or the next few sessions. Common gaps fill most often, breakaway gaps fill least often, and runaway and exhaustion gaps land in between depending on the strength of the underlying trend.
This is one of the most misunderstood questions in the space: is gap trading profitable if most gaps eventually fill? The honest answer is that profitability depends entirely on which type of gap you're trading and what timeframe you use to measure "fill." A breakaway gap that finally fills six months later after a full trend cycle is not the same trade as a common gap filling in the next 90 minutes.
In our own gap logs, the pattern is consistent: gaps accompanied by real news and above-average volume fill far less often in the short term than gaps with no clear driver. If you're building your own gap trading strategy pdf or reference sheet, organize it around this exact hierarchy: news-driver strength, volume confirmation, and trend context, in that order.
Want expert trading insights delivered daily?
Join thousands of traders who rely on Traders Agency for market analysis and trade ideas.
Join Traders AgencyFade the Gap vs. Gap and Go: Which Strategy Wins?
There's no single winner between fading a gap and trading a gap and go, because each approach is designed for a different gap type and a different volume signature. Fading works best on exhaustion gaps and low-volume common gaps. Gap and go works best on breakaway and confirmed runaway gaps.
Step-by-Step: Gap and Go Setup Example
- Step 1: Identify the setup. Stock closes at $48.00 and opens the next session at $51.60, a 7.5% breakaway gap on an earnings beat, with pre-market volume already at 210% of the 20-day average by 9:20 AM.
- Step 2: Wait for confirmation. Let the first 5-minute candle close above the opening price with volume confirming, not fading on the first tick.
- Step 3: Execute the entry. Buy the break of that first candle's high at $51.90, with a stop just below the opening print at $51.50.
- Step 4: Manage the position. Track relative volume on each 5-minute bar. If volume dries up while price stalls, tighten the stop or take partial profits.
| Scenario | Session Outcome | Result Per Share |
|---|---|---|
| Best case | Grinds higher, closes near $54.00 | +$2.10 against $0.40 risk (better than 5:1) |
| Most likely case | Holds the gap, midday consolidation, closes $52.50 to $53.00 | +$0.60 to +$1.10 |
| Worst case | Move fails immediately, stop hit at $51.50 | -$0.40 |
Step-by-Step: Fade the Gap Setup Example
- Step 1: Identify the setup. Same stock gaps up 9% on a smaller, less convincing news item, on only 60% of average pre-market volume, after a five-day run-up of 22% into the print.
- Step 2: Wait for rejection. Let the open print, then wait for the first 5-minute candle to close back below the opening price.
- Step 3: Execute the entry. Short the break of that candle's low with a stop above the pre-market high.
- Step 4: Define the exit. Target the prior session's close as the full-fill objective, with a partial exit at the halfway retracement.
| Scenario | Session Outcome | Result |
|---|---|---|
| Best case | Full gap fill back to the prior close | Complete retracement captured |
| Most likely case | Partial fill, roughly half the gap, then stabilizes | Partial target hit |
| Worst case | Gap holds and extends higher | Defined, pre-planned loss at the stop |
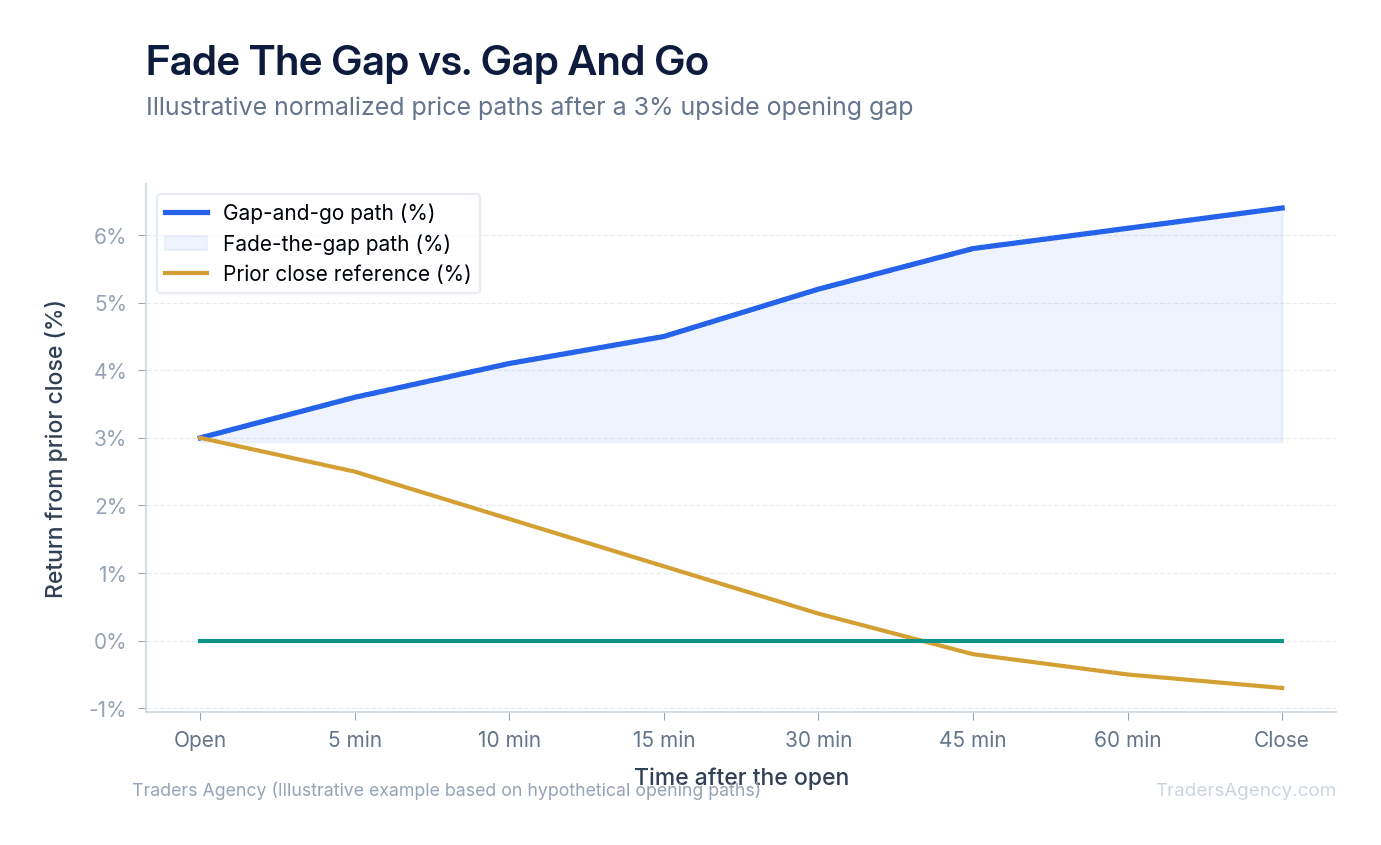
Watch Out: Forum threads love to reduce this decision to "always fade" or "always go." Neither rule survives contact with real markets. Volume and news context decide which side of the trade you belong on, every single time.
Pre-Market Assessment and Volume Confirmation
Pre-market assessment is the process of evaluating gap size, news strength, and relative volume before the opening bell to decide whether a gap is likely to continue or reverse. This step is what separates a disciplined gap trading strategy from guesswork dressed up as technical analysis.
Our Pre-Market Checklist
- Identify the news driver. Earnings, guidance, an analyst action, macro data, or unexplained order flow. No identifiable driver usually means a common gap, which lowers continuation odds.
- Measure gap size against average true range (ATR). A gap smaller than the stock's typical daily ATR is far less meaningful than one that exceeds it.
- Check pre-market volume against the 20-day average. Anything under 50% of average volume by 9:15 AM should lower your conviction on a continuation trade.
- Compare to sector and index futures. If the whole tape is moving the same direction, discount the idiosyncratic signal.
- Note the prior trend context. A gap in the direction of an existing trend behaves very differently than a gap against it.
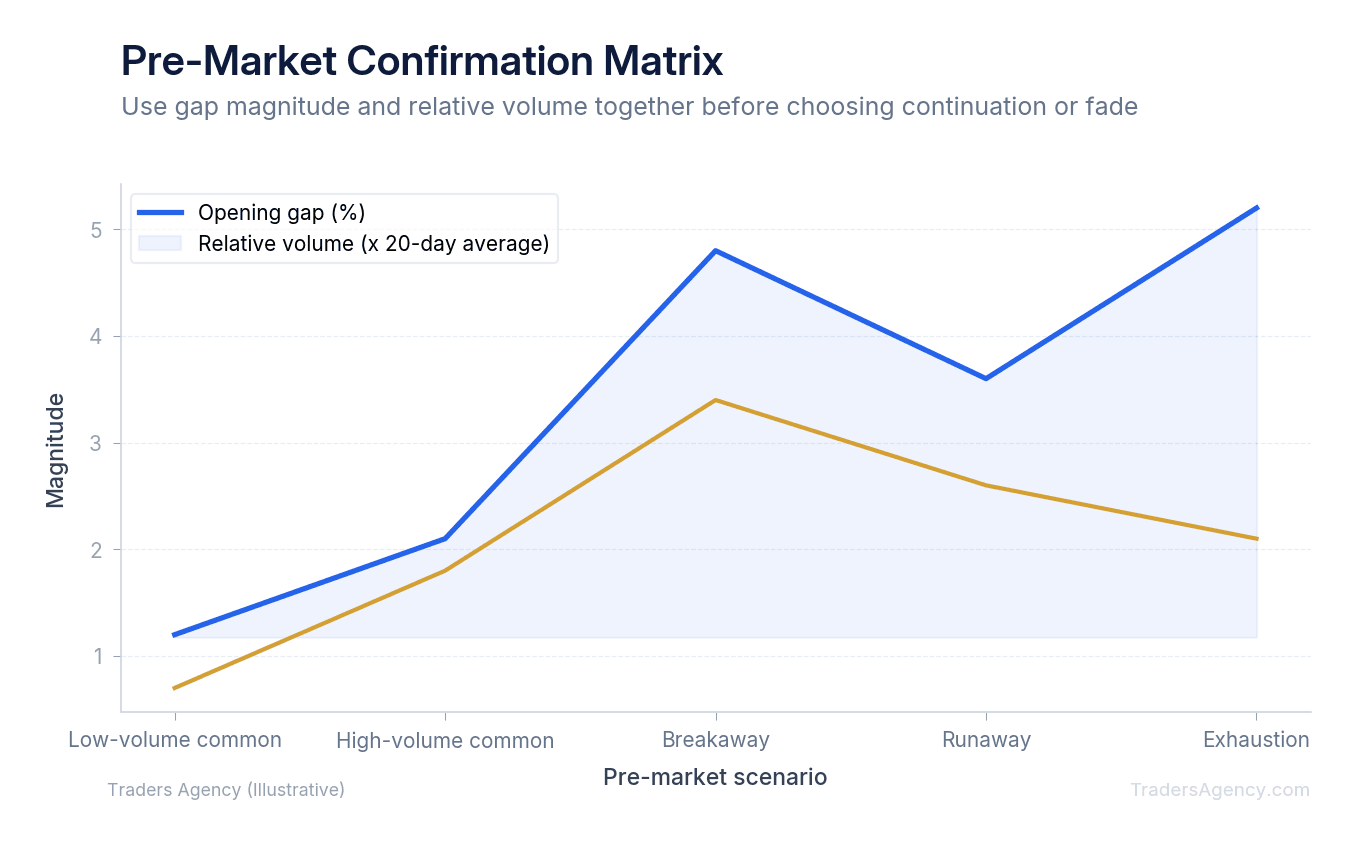
Volume confirmation doesn't stop at the open. We keep tracking relative volume on each 5-minute bar through the first hour. A continuation trade that starts strong but sees volume dry up by 10:00 AM is telling you conviction is fading, even if price hasn't reversed yet.
Advanced Risk Management for Gap Trades
Risk management on gap trades has to account for one structural problem: gaps happen when markets are thin, which means slippage on stops is worse than on a normal intraday setup. We size gap trades smaller than standard swing positions specifically because of that execution risk.
Multi-Leg Execution Example
Consider a trader running a $50,000 account who wants exposure to a breakaway gap without full directional risk. Instead of a straight long position, they structure it as a risk-defined vertical spread, using contracts listed on exchanges like the Cboe:
| Parameter | Value |
|---|---|
| Long leg | Buy the $52 call, roughly 14 days to expiration |
| Short leg | Sell the $56 call, same expiration |
| Net debit | $1.80 per spread |
| Max loss | $180 per contract, if the stock closes at or below $52 at expiration |
| Max gain | $220 per contract, if the stock closes at or above $56 at expiration |
| Breakeven | $53.80 |
This structure caps downside on a position that's inherently higher-risk because of the gap's volatility, while still capturing the bulk of a continuation move. Desks use spreads like this on gap days because the elevated implied volatility priced into options right after a large gap makes an outright long call expensive, and selling the higher strike offsets part of that premium.
Position Sizing Rules We Follow
- Risk no more than 1% of account equity on any single gap trade.
- Widen stops slightly versus a normal setup to absorb opening volatility, then reduce share size to compensate.
- Never average into a losing gap fade. If the thesis is wrong, it's wrong immediately, not after three add-ons.
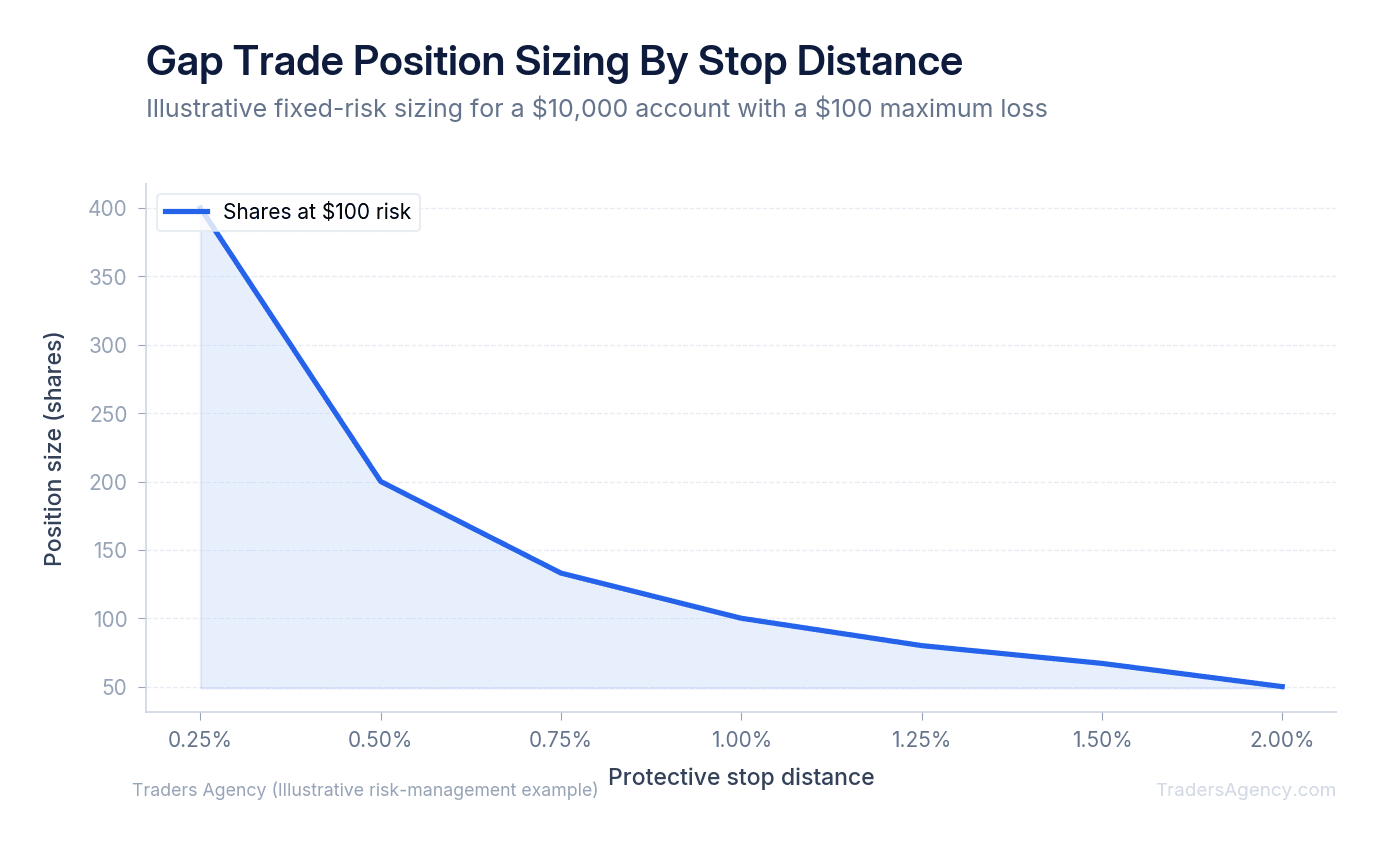
Risk Warning: Opening-bell liquidity is thin, and stop orders can fill well past your intended price. Assume slippage on every gap trade and size the position so a bad fill still leaves you inside your 1% risk limit.
What Is the 3-5-7 Rule in Trading?
The 3-5-7 rule is a portfolio-level risk guideline: cap risk on any single trade at 3%, total risk across all open positions at 5%, and portfolio-wide drawdown or exposure at 7%. It isn't gap-specific, but it maps cleanly onto gap trading because gap setups cluster around earnings season, when several opportunities show up at once.
Applied to gap trading, it means you shouldn't hold more than a handful of open gap positions simultaneously, even during a heavy earnings week that produces setup after setup. The rule exists to prevent correlated losses when multiple gap trades move against you at the same time, which happens more often than traders expect since many gaps trace back to the same macro releases from sources like the Federal Reserve.
Is Gap Trading Profitable?
Gap trading can be profitable, but only for traders who apply consistent classification and volume filters instead of trading every gap they see. The profit comes from selectivity: trading breakaway and confirmed runaway gaps for continuation, and reserving fades for exhaustion setups with weak volume.
Traders usually ask this alongside a related question: can you make $100 a day day trading? Daily dollar targets are the wrong measuring stick for this strategy. A $100,000 account and a $5,000 account can catch the identical gap setup, but the dollar outcome scales with account size and position sizing, not with the strategy itself. Consistent process, not a fixed daily number, determines whether gap trading works for you over a full year.
Is a Gap Up Bullish or Bearish?
A gap up is directionally bullish in the immediate term, since it reflects buyers willing to pay more than the prior close. Whether it holds depends entirely on gap type and volume. A breakaway gap up on strong volume is a genuinely bullish signal. A gap up on thin volume after an extended run is often a bearish exhaustion signal in disguise.
This is exactly why classification outranks direction. Two gap-ups that look identical on a daily chart can resolve in completely opposite directions once you factor in volume and trend context.
Practical Application: When to Use This Strategy
Gap trading works best in liquid, high-volume names with active options markets, clear news drivers, and enough average daily range to justify the added execution risk. It works poorly on illiquid small caps where the bid-ask spread alone erases any edge from correct gap classification.
When to Avoid Gap Trading
- Low-float, thinly traded names where slippage on stops can exceed your planned risk.
- Gaps with no identifiable news driver on average or below-average volume, which sit closest to random noise.
- Broad market gap days such as Fed decisions and CPI releases, where every stock gaps together and idiosyncratic edge disappears.
- Days you can't watch the first 30 minutes closely, since gap trades demand active management right at the open.
Common Mistakes We See
- Trading the gap direction without checking pre-market volume at all.
- Treating every gap as a breakaway gap because the trader wants a trend story.
- Sizing gap trades the same as normal swing trades, ignoring the added slippage risk.
- Holding a faded gap position through a full reversal instead of respecting the stop.
Remember This: Whether you build a checklist, a one-page reference, or a full trading plan, organize it around the same four-part hierarchy we use internally: classify the gap, confirm with volume, check relative strength, then size the position for opening volatility.
Frequently Asked Questions
Is gap trading profitable for retail traders?
Yes, but only with disciplined classification and volume confirmation. Trading every gap without filters tends to produce inconsistent results once commissions and opening slippage are factored in.
What's the difference between a common gap and a breakaway gap?
A common gap occurs inside an established trading range with no news driver and fills quickly. A breakaway gap occurs on genuine news and marks the start of a new trend, with a much lower fill rate.
How much pre-market volume confirms a gap continuation trade?
We look for at least 100% of the 20-day average pre-market volume by roughly 9:15 AM as a baseline, with higher conviction above 150%.
Can beginners use a gap trading strategy?
A gap trading strategy for beginners should start with paper trading gap classification only, without live capital, until you can consistently identify gap type and volume context in real time.
Do gaps always fill eventually?
Not always, and never on a fixed timeline. Breakaway and strong runaway gaps can go unfilled for months or longer if the underlying trend continues.
What timeframe works best for gap trading?
Daily charts for classification and context, with 5-minute and 15-minute charts for entry timing and confirmation during the opening session.
Want expert trading insights delivered daily?
Join thousands of traders who rely on Traders Agency for market analysis and trade ideas.
Join Traders AgencyDISCLAIMER: Traders Agency does not offer financial advice. The information provided is for educational purposes only and should not be considered financial advice. Traders Agency is not responsible for any financial losses or consequences resulting from the use of the information provided. Trading carries inherent risks and may not be suitable for all individuals. You are advised to conduct your own research and seek personalized advice before making any investment decisions, recognizing the potential risks and rewards involved.
See more from Traders Agency on Google
Make us a preferred source and our market analysis will appear more prominently in your Google Search, Top Stories, and AI results.
Add to Preferred Sources