

The smart money biotech rotation is officially underway. While the broader indexes pull back, institutional capital is aggressively rotating out of semiconductors and into biotechnology. This massive shift is built entirely on the backbone of rapidly changing AI developments that are boosting this specific group of stocks.
This is the area of the market outperforming every other sector right now.
You do not want to fight this trend. When big institutions start moving dollars away from last quarter's winners and into a new theme, that is where you want to hunt for the best opportunities.
The Smart Money Biotech Rotation Is Real
Bottom Line: The core thesis is straightforward: institutions are pulling capital out of semiconductors and redeploying it into biotech, and the IBB breakout confirms this is a sector-wide move, not a one-off. IOVA and KYMR are the specific setups worth watching, both showing high tight flag patterns that historically precede sharp moves. The trade is to align with the rotation, define your risk below the flag base, and let sector momentum drive the position.
The NASDAQ is currently down over a percent. The S&P, Dow, Russell, and equal-weight indexes are all pulling back.
Contrast that with biotechnology.
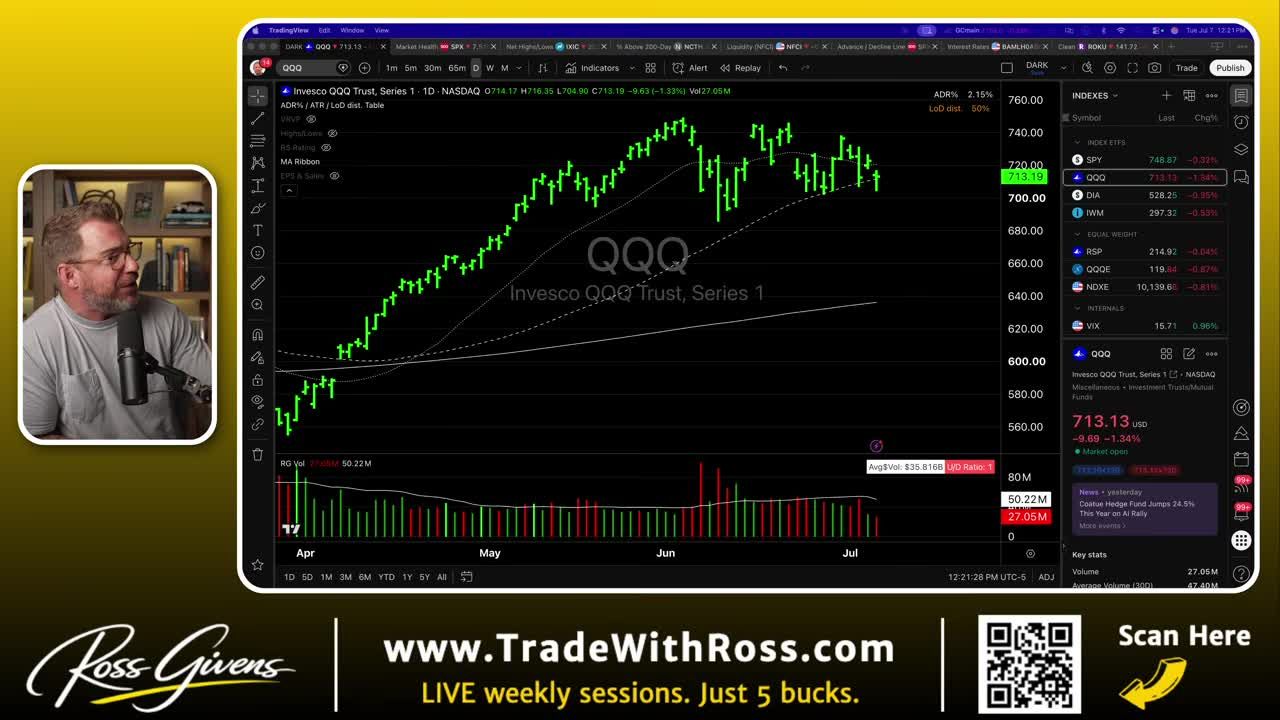
The IBB, the biotech ETF, is absolutely soaring, up another 1.5% on the day. That performance is not coming from one individual stock. It represents the entire group of all 700-something stocks moving as a whole.
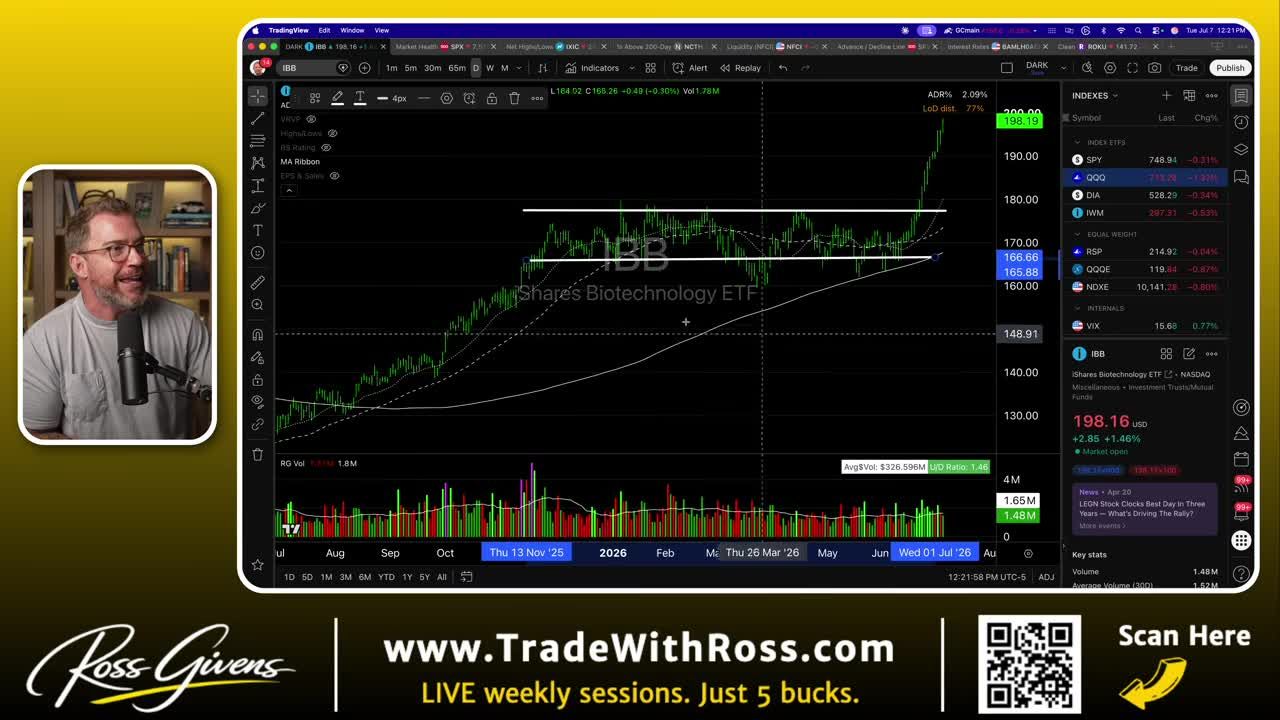
This sector is in full acceleration mode. It made a big run-up in late 2025 on hopes of AI developments, then went through a big six to seven-month consolidation phase. Now it is pushing higher and leading every other group in the market.
Where Are Institutions Putting Their Dollars Right Now?
The Industry Strength Indicator tracks which areas of the market are leading. It tracks 40 different sectors and subsectors and measures which ones are up the most over the last one, two, and three periods.
Right now, biotechnology is dominating.
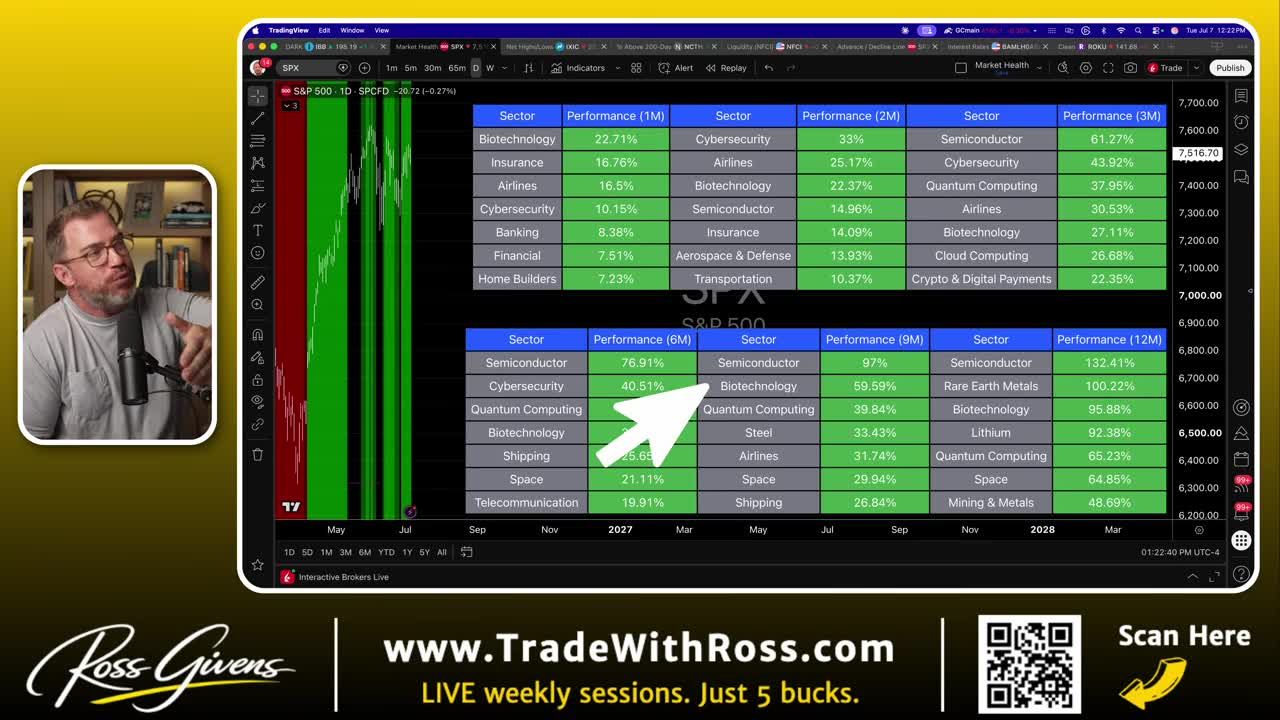
This indicator shows you the theme of the market. It reveals exactly where big institutions are putting their dollars. Institutions are the ones driving prices. If they are betting big on semis, nuclear, or biotech, that is the area that will do best. That is where the proverbial wind is at your back, and that is where you want to hunt for the best opportunities.
We are currently seeing a textbook sector rotation play out. The money is leaving the semiconductor space and flooding directly into biotech.
How Do You Track Smart Money Moves in Real Time?
You follow smart money by tracking supply absorption and tightening pullbacks on the charts. When dips get progressively smaller, it indicates institutions are quietly building long-term positions and sucking up available supply before a major breakout occurs.
When institutions and big investors learn about the hype surrounding a stock, the price runs up. Then it comes in and begins to absorb supply.
You want to see tightening pullbacks. You want to see the dips getting smaller.
Over a period of three or four months, institutions build up positions and suck up the available supply. This creates a situation where there are not many shares out there available because so many people have bought them for long-term positions. When demand continues or even better rises, that demand is chasing a very small number of shares.
That is exactly what causes a stock to run higher. You get big moves when everybody wants something and there is not a lot of it.
Which Biotech Stocks Are Worth Watching During This Rotation?
The biotech space is one of the deepest sectors of the market. Several names are doing extremely well right now.
Natera recently came through a nice consolidation but is now extended. KRYS had a beautiful textbook breakout at 315 but started at 375. Immunovant is currently coming out of a textbook high tight flag pattern.
But two specific stocks are buyable right now.
Get an entire year of live weekly mentoring sessions, my newsletter, indicators, bonus reports, tons more. Click the link and I'll see you in the next live session.
Join my Black Ops Trading ClubIovance Biotherapeutics (IOVA)
The first stock is Iovance Biotherapeutics, ticker IOVA. This company has a lot of things going for it. They have the first approved TIL cell therapy for solid tumors. Q1 revenue came in with 38% year-over-year growth.
Unlike a lot of biotechs, IOVA has tons of cash on the balance sheet. Their runway stretches all the way out through 2028 before any new money needs to come in. Improving margins. A strong pipeline.
The best part is the analysts consensus target. Of all the analysts studying this stock, their average price target is $9.50 a share. The stock is currently trading at four and a quarter. That represents 130% to 140% upside from current levels, assuming the analysts are right.
The IOVA Trade Setup
The technical picture for IOVA is perfectly aligned with the smart money biotech rotation.
The chart shows an upward channel. The peaks are getting a little bit higher, and the lows are also drifting upwards. It is currently in a consolidation period, absorbing supply with tightening pullbacks.
You do not have to wait for a perfect technical breakout. You can buy in early right here.
You have the tailwind of the biotechnology sector leading the market, even on down days. If you get this trade right, you could see 30%, 50%, or even 100% plus on the upside.
Kymera Therapeutics (KYMR)
The second stock is Kymera Therapeutics, ticker KYMR. Another big mover with more near-term momentum.
Their lead asset is a drug code-named KT-621, which is apparently a first-in-class oral STAT6 degrader. I just trade stocks, so I do not claim to understand the deep science. But the financial projections are staggering.
Trading the KYMR High Tight Flag
KYMR went through a multi-month consolidation period. The pullbacks began to shallow out. It got a little squirrelly for a moment, but then it came ripping right back up the right side.
It just put in an absolute textbook high tight flag.
This is one of the most powerful patterns for fast-moving stocks that run 50%, 80%, or 100%. The stock makes a big run, flags out into a tightening consolidation wedge for a couple of days or a couple of weeks, and then breaks to the upside. That is exactly where you want to buy.
KYMR is a bit extended, but it just went through a six or seven-day consolidation and is breaking through this high tight flag.
The Average Daily Range (ADR), which measures how much a stock typically moves from low to high on a given day, is almost 7%. Compare that to a typical blue-chip stock, which moves about 2% to 2.5% a day. With KYMR, if you get two, three, or four good days, a 20% or 30% move in a single week is very possible. And it has been happening.
Riding the Smart Money Biotech Rotation
The smart money biotech rotation is not a prediction. It is a measurable reality happening in the market right now.
Institutions are rotating capital out of semiconductors and into biotechnology. The IBB breakout proves this is a broad, sector-wide move driven by AI developments.
By targeting strong stocks like IOVA and KYMR, you align your capital with the areas where institutions are putting their dollars. You secure tight risk parameters while exposing yourself to massive upside potential. Keep your stops disciplined, watch the high tight flags, and let the sector momentum do the heavy lifting.
Get an entire year of live weekly mentoring sessions, my newsletter, indicators, bonus reports, tons more. Click the link and I'll see you in the next live session.
Key Takeaways
- The IBB biotech ETF is up 1.5% on a day when the NASDAQ is down over 1%, with the S&P, Dow, Russell, and equal-weight indexes all pulling back simultaneously.
- The biotech sector ran hard in late 2025 on AI-driven optimism, consolidated for six to seven months, and is now breaking out and leading every other market sector.
- IOVA (Iovance Biotherapeutics) is flagged as a high tight flag setup, a pattern historically associated with explosive moves, with a specific stop-loss level defined below the flag base.
- KYMR is the second institutional target identified, selected because it shows the same high tight flag structure that signals concentrated smart money accumulation.
- The IBB move is not a single-stock story. It represents broad participation across all 700-plus stocks in the biotech index, which confirms institutional rotation rather than speculative retail activity.
DISCLAIMER: Traders Agency does not offer financial advice. The information provided is for educational purposes only and should not be considered financial advice. Traders Agency is not responsible for any financial losses or consequences resulting from the use of the information provided. Trading carries inherent risks and may not be suitable for all individuals. You are advised to conduct your own research and seek personalized advice before making any investment decisions, recognizing the potential risks and rewards involved.
See more from Traders Agency on Google
Make us a preferred source and our market analysis will appear more prominently in your Google Search, Top Stories, and AI results.
Add to Preferred Sources