
You've probably seen this happen. You buy a stock right as it breaks above a major resistance level. You expect a massive run based on your chart analysis. Instead, the price instantly reverses. Your stop loss gets hit within minutes. What went wrong? The answer is often hidden in the order book.
Using Level 2 market data is a specific trading technique that reveals the actual supply and demand behind price movements. Standard charts only show you past transactions. The order book shows you the pending transactions waiting to execute.
We'll walk you through exactly how to read this data. You'll learn how to spot hidden support and resistance levels and how to time your entries with precision using real market mechanics. By the end of this guide, you'll know how to identify real buying pressure and avoid fake orders designed to trap retail traders.
What Is Level 1 and Level 2 Market Data?
Bottom Line: Level 2 market data gives traders a real-time view of supply and demand that standard charts cannot show, but it requires skepticism. Spoofed orders and vanishing walls are common traps, so the most reliable approach treats the order book as confirmation of a chart-based thesis, not a standalone signal. Used correctly, this two-step process filters out a meaningful number of bad entries before they cost you.
Level 1 market data provides the current highest bid price, lowest ask price, and last traded price for a security. Level 2 market data goes deeper by showing the full order book, displaying multiple price levels of resting limit orders waiting to be filled on both the buy and sell sides.
Most standard brokerage accounts provide Level 1 data by default. This gives you a basic snapshot of where a stock is trading right now. It's enough information to execute a simple market order. However, it completely hides the underlying liquidity of the asset.
Key Concept: When comparing Level 1 vs. Level 2 vs. Level 3 market data, the difference comes down to market visibility. Level 1 shows the best bid and ask. Level 2 shows the full depth of the order book. Level 3 allows registered market makers to enter and modify quotes directly in the system.
Level 2 reveals exactly how many shares are waiting at $150.05, $150.10, and beyond. This allows you to see where the heavy volume is sitting before the price even gets there.
Level 3 data is reserved for licensed professionals working for registered broker-dealers. If you're wondering how to get Level 3 market data, you generally need to be affiliated with a registered broker-dealer acting as a market maker. For independent traders, Level 2 is the highest tier of visibility available. The SEC's investor education resources highlight that order book visibility helps investors understand market liquidity and execution risks.
How Are Traders Using Level 2 Market Data for Better Entries?
Using Level 2 market data for better entries involves analyzing the order book to find large concentrations of limit orders. Traders look for massive buy orders to act as support for long entries, or large sell orders to act as resistance for short entries.
We teach our members to view the order book as an X-ray of the market. A standard stock chart shows you what happened in the past. The Level 2 screen shows you what is positioned to happen in the future.
Think of it like looking at traffic through a GPS app. A regular chart tells you a road is clear right now. Level 2 tells you there's a massive roadblock sitting exactly one mile ahead. By seeing that roadblock early, you can adjust your trading plan before you get trapped in a bad position.
How to Read the Order Book: Bids, Asks, and Market Depth
The Level 2 screen is split into two distinct columns. The left side displays the bids (buy orders). The right side displays the asks (sell orders).
Each row on the screen shows three pieces of information: a specific price level, the market maker or exchange routing the order, and the size of the order. The prices are ordered from best to worst. The highest bid sits at the top left, and the lowest ask sits at the top right.
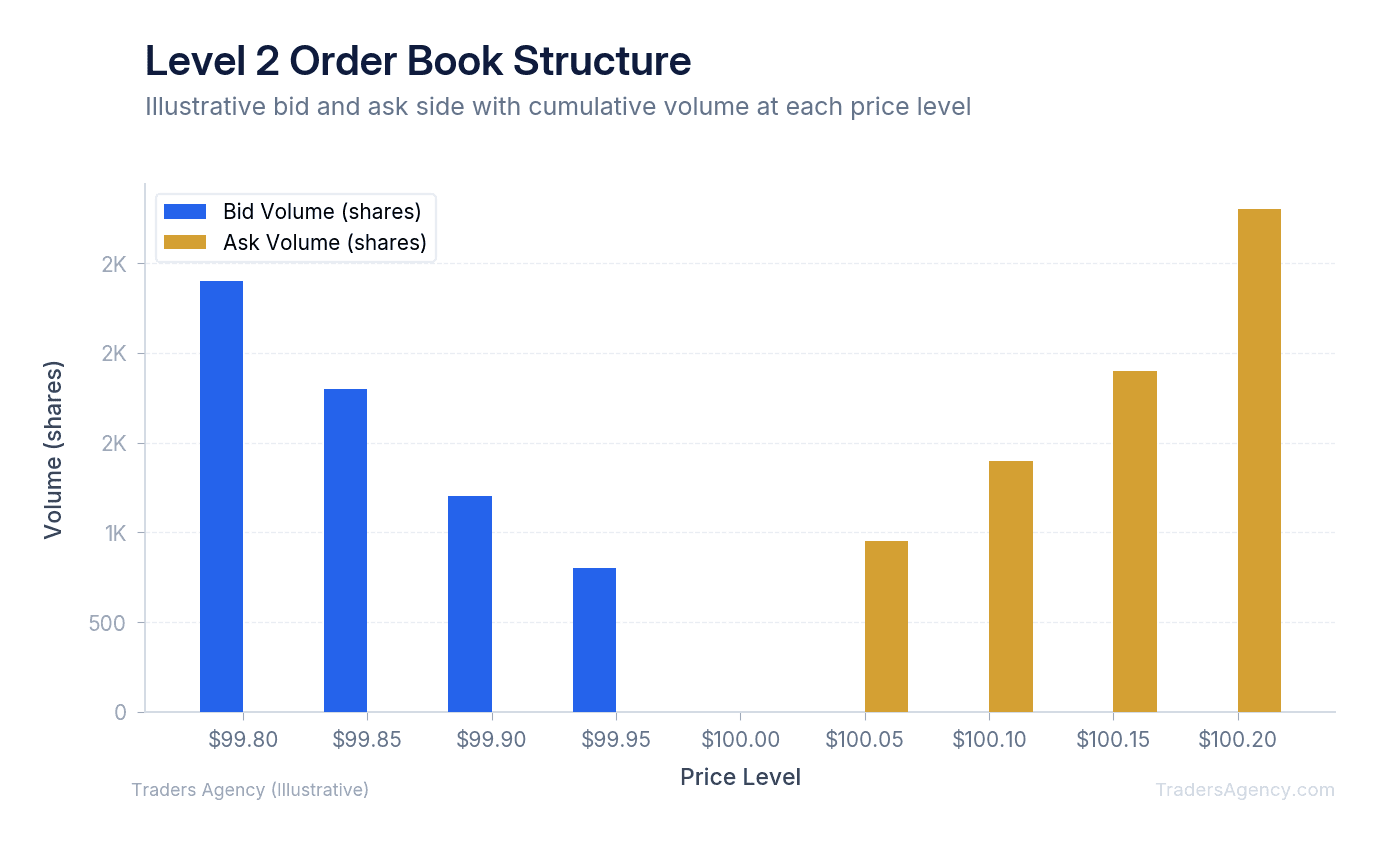
Order sizes are typically displayed in lots of 100 shares. If you see a size of "50" next to a price, that means there's an order for 5,000 shares waiting to be filled. If you see a size of "10", that represents 1,000 shares.
Most platforms use colors to distinguish bid and ask sides or to group price levels together. All orders at $150.05 might be highlighted in green, while orders at $150.04 are highlighted in yellow. This visual grouping helps your eyes quickly process the market depth. When entries on the screen update rapidly, it indicates high transaction volume and fast-moving price action.
Our team recommends focusing primarily on the price and size columns. The specific market maker routing the order matters less for most retail day trading strategies. Your primary goal is to identify where the largest clusters of shares are located. These clusters create the market depth that dictates short-term price action.
How Do You Spot Buying vs. Selling Pressure Using Level 2 Data?
To spot true buying pressure, you need to look at how quickly orders are being absorbed. When a stock is highly bullish, you'll see the ask prices disappear rapidly. Aggressive market buyers will chew through the resting limit sell orders without hesitation.
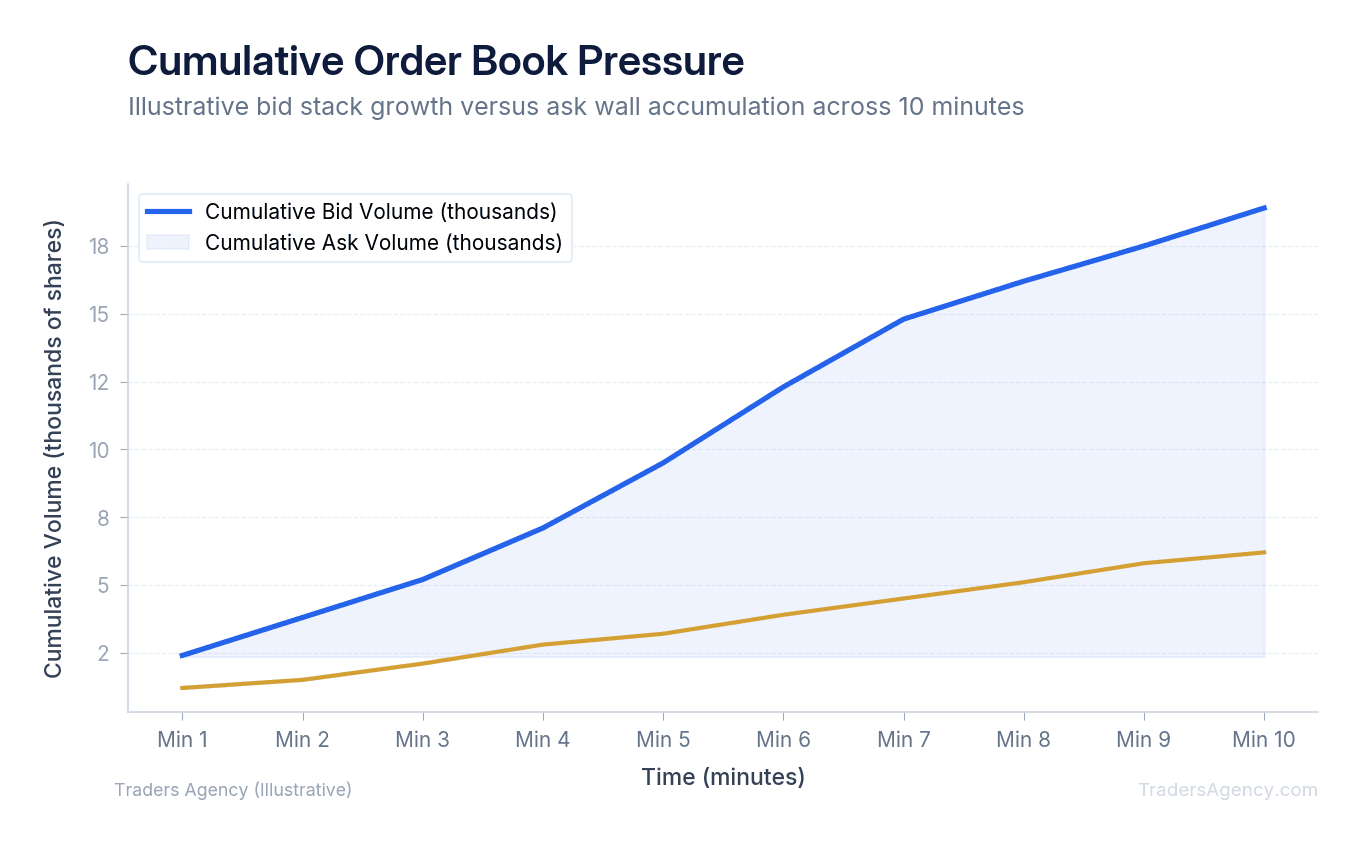
You'll also notice the bid side constantly replenishing. As soon as one price level is cleared, new buyers step up and place limit orders at higher prices. This action pushes the stock upward. The spread between the bid and ask will often tighten during strong buying pressure.
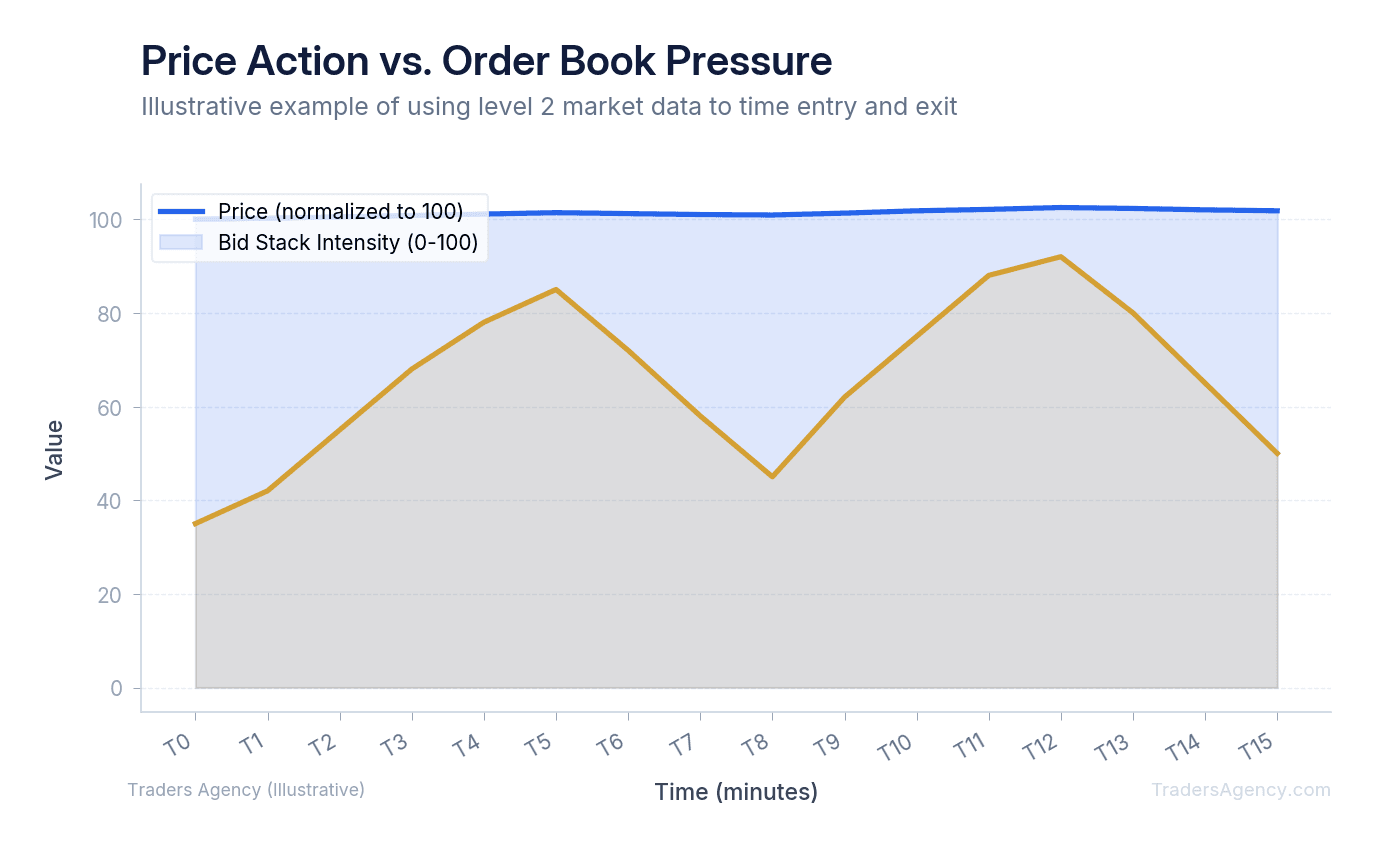
Conversely, selling pressure is obvious when the bid prices vanish quickly. If a stock is sitting at $50.00 and you see massive sell orders constantly reloading on the ask side, the stock will struggle to move higher. We prefer to enter long positions only when the bid side is heavily stacked and the ask side looks thin.
Key Concept: Bid stacking means large buy orders are piling up at or near the current price, signaling strong demand. An ask wall is a massive sell order at a specific price level that acts as a ceiling the stock must break through to move higher.
Want expert trading insights delivered daily?
Join thousands of traders who rely on Traders Agency for market analysis and trade ideas.
Join Traders AgencyBid Stacking and Ask Walls: What They Signal and How to Trade Them
Here's a concrete example of how to trade an ask wall. An ask wall occurs when a massive sell order sits at a specific price level. This order acts as a heavy ceiling that the stock struggles to break through.
Imagine you're trading AAPL (Apple Inc.) and the stock is pushing up toward $185.00. You want to take a short position, but you need a precise entry point.
Step-by-Step: Trading an Ask Wall Rejection
- Identify the Setup: You look at your Level 2 screen and see an order size of 1,000 (representing 100,000 shares) sitting exactly at $185.00. The normal order sizes around it are only 10 to 50 (1,000 to 5,000 shares). This massive order is a clear ask wall. It tells you a very large seller is defending that price.
- Execute the Trade: We prefer to wait for the price to test this wall. If the buyers cannot chew through those 100,000 shares, the price will reject. You enter a short position at $184.90 and place your stop loss just above the wall at $185.05.
- Manage the Outcome: If the price rejects hard off the $185.00 wall, it drops back toward your target. If aggressive buyers absorb the wall instead, your stop loss at $185.05 executes immediately, keeping your loss controlled.
| Scenario | Entry | Exit | Result per Share |
|---|---|---|---|
| Best Case (Wall Holds) | $184.90 short | $183.00 target | +$1.90 profit |
| Worst Case (Wall Breaks) | $184.90 short | $185.05 stop loss | -$0.15 loss |
You can also trade the breakout of an ask wall. If you see aggressive buyers attacking that 100,000-share order at $185.00, watch the size column closely. If the size drops from 1,000 down to 800, then 400, then 100, the wall is crumbling. Once it hits zero, the stock will often experience a violent surge upward. Breakout traders buy exactly at the moment the wall breaks, riding the momentum for a quick profit.
What Is Spoofing and How Can It Mislead You in the Order Book?
You cannot trust every large order you see on the screen. Institutional traders sometimes use a manipulative tactic called spoofing. This involves placing a massive fake order with no intention of actually executing it. The goal is to trick retail traders into buying or selling.
For example, a large player might place a fake bid for 500,000 shares at $20.00. Retail traders see this massive support on their Level 2 screen. They assume the stock will go up, so they start buying aggressively at $20.05. The institutional player then sells their real position into this retail buying pressure.
Right before the price drops to $20.00, the institution cancels the 500,000-share fake order. The support vanishes instantly. The retail traders are now trapped in a losing position as the stock plummets to $19.50.
Watch Out: To avoid spoofing traps, watch how a large order behaves as the current price approaches it. If a massive order constantly cancels and moves further away as the price gets closer, it is likely a spoof. Real institutional buyers will leave their orders in place to get filled. We teach our members to never blindly trust a large order until the price actually tests it.
Which Platforms Offer Level 2 Data and What Do They Cost?
Finding where to get Level 2 market data depends on your broker and your trading style. Many platforms now offer this data, but the depth, speed, and pricing can vary significantly.
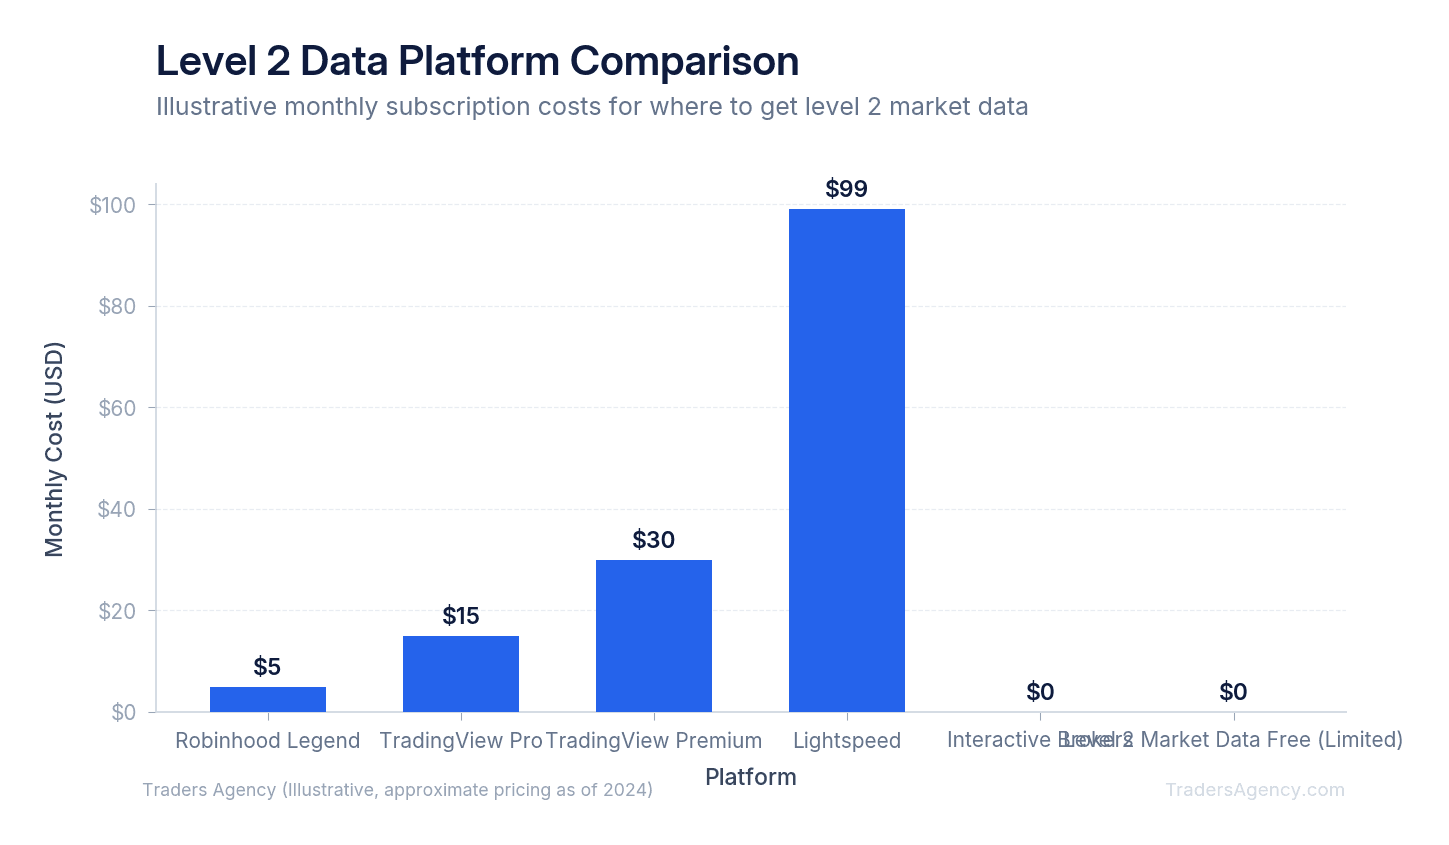
If you're a beginner, you might be looking for Level 2 market data free of charge. Webull offers complimentary Level 2 data for new users, usually as a promotional trial. Thinkorswim by Charles Schwab also provides free Level 2 data for funded accounts. These are excellent starting points for intermediate traders.
For those using TradingView for charting, Level 2 data on TradingView requires a paid subscription plus an additional monthly exchange fee. It's a great option if you already rely on their advanced charting tools. The visual layout is clean and easy to customize.
If you trade on Robinhood, you need a premium subscription to access the order book. Learning how to read Level 2 market data on Robinhood is straightforward because their interface is highly simplified. They recently introduced the Robinhood Legend platform upgrade, which gives active traders a more traditional, desktop-style order book view that competes with legacy brokers.
| Platform | Level 2 Access | Approximate Cost | Best For |
|---|---|---|---|
| Webull | Included (promo trial) | Free trial, then varies | Beginners |
| Thinkorswim | Included with funded account | Free | Intermediate traders |
| TradingView | Paid subscription + exchange fee | ~$15-30/month | Chart-focused traders |
| Robinhood Gold | Premium subscription required | $5/month | Casual active traders |
| Lightspeed / Cobra | Direct-access data feeds | $25-100+/month | Professional day traders |
Professional day traders often prefer direct-access brokers like Lightspeed or Cobra. These platforms charge monthly fees for data feeds, but they offer the fastest, most unfiltered order books available.
When Should You Not Rely on Level 2 Market Data?
Using Level 2 market data is incredibly effective for day trading and scalping. However, it is completely useless for long-term investing. If you're buying a stock to hold for five years, the limit orders sitting on the book today don't matter. The daily noise won't impact your long-term thesis.
You should also avoid relying on this data during highly volatile news events. When the Federal Reserve announces interest rate changes, the order book moves too fast for a human to read. When a company releases a surprise earnings report, market makers will pull their liquidity. This causes the Level 2 screen to look completely empty right before massive price spikes. Trading during these moments is purely gambling.
Another common mistake is watching the order book on low-volume penny stocks. These illiquid assets can be easily manipulated by a single large trader. A massive buy order on a stock that only trades 50,000 shares a day is highly suspicious. The order book is most reliable on large-cap stocks and highly liquid ETFs like SPY or QQQ. These markets have too much volume for any single player to easily manipulate.
Risk Warning: Never take a trade based solely on an order book imbalance. Use your charts to find structural support and resistance zones first, then use the order book to confirm whether buyers or sellers are actually waiting at those levels. Always practice strict risk management. Even the strongest ask wall can break. Keep your position sizing consistent and always honor your stop loss.
Our team recommends combining Level 2 analysis with standard technical indicators. Find your levels on the chart first. Then open the order book to see if real liquidity confirms your thesis. This two-step confirmation process filters out a significant number of bad trades and keeps you on the right side of the market.
Want expert trading insights delivered daily?
Join thousands of traders who rely on Traders Agency for market analysis and trade ideas.
Join Traders AgencyKey Takeaways
- Level 2 data shows the full order book with multiple price levels of resting limit orders on both sides, while Level 1 only shows the current bid, ask, and last traded price.
- Large clusters of buy orders below price (bid stacking) can signal institutional support, but they can also be spoofed orders placed to create a false impression of demand.
- Ask walls, which are large sell orders sitting above the current price, often act as short-term resistance. A sudden disappearance of an ask wall before price reaches it is a red flag, not a green light.
- The recommended two-step process is to identify structural support and resistance on the chart first, then open the order book to confirm whether real liquidity exists at those levels.
- Level 2 data is least reliable during pre-market and after-hours sessions, in low-float stocks, and around major news events when order book conditions can shift faster than you can react.
DISCLAIMER: Traders Agency does not offer financial advice. The information provided is for educational purposes only and should not be considered financial advice. Traders Agency is not responsible for any financial losses or consequences resulting from the use of the information provided. Trading carries inherent risks and may not be suitable for all individuals. You are advised to conduct your own research and seek personalized advice before making any investment decisions, recognizing the potential risks and rewards involved.
See more from Traders Agency on Google
Make us a preferred source and our market analysis will appear more prominently in your Google Search, Top Stories, and AI results.
Add to Preferred Sources