A moving average is a technical indicator that smooths out price data by creating a constantly updated average price line on your chart. When comparing SMA vs EMA, you're looking at the two most popular ways to calculate this average. You open your charting platform and see a mess of jagged lines, red and green candles, and erratic price swings. Making sense of that noise is exactly why traders use moving averages.
We'll walk you through how to read these lines, when to use each type, and how to spot clear entry and exit signals. Our team relies on these indicators daily to identify trends and manage risk. By the end of this guide, you'll know exactly how to apply these tools to your own trading strategy.
What Is a Simple Moving Average (SMA)?
Bottom Line: The core difference between SMA and EMA comes down to speed versus stability. The EMA reacts faster and suits active traders, while the SMA filters more noise and suits trend confirmation. Using both together on the same chart gives you a more complete picture than relying on either one alone.
A Simple Moving Average (SMA) calculates the average price of an asset over a specific number of periods. It gives equal weight to every single closing price in that timeframe. If you're looking at a 10-day SMA, the calculation adds up the closing prices of the last 10 days and divides that total by 10.
This creates a smooth line that filters out daily market noise. We like to compare it to calculating a student's grade point average for a semester. A bad test score on the first day of class carries the exact same weight as a bad test score on the last day of class.
Key Concept: The SMA treats all price data equally. Every closing price in the lookback period has the same influence on the final number, regardless of how recent or old it is.
Traders use the SMA to identify long-term trends. Moving averages are widely recognized as fundamental tools for identifying market direction. Because the SMA treats all data equally, it reacts slowly to sudden price spikes. This slow reaction time helps you stay in a long-term trade without getting spooked by a temporary drop.
What Is an Exponential Moving Average (EMA)?
An Exponential Moving Average (EMA) also calculates an average price over a set period, but it applies more weight to the most recent price data. This makes it react faster to current market changes. Instead of treating price action from 50 days ago the same as price action from today, the EMA calculation forces the line to hug the current price much closer.
We teach our members that the EMA is designed for speed. When a stock suddenly reports excellent earnings and gaps up, the EMA will turn upward much faster than the SMA. The math behind the EMA places a multiplier on the most recent days.
This speed makes the EMA a favorite tool for short-term traders. If you're day trading or swing trading, you need to know what the market is doing right now. You cannot afford to wait for old data to cycle out of the calculation.
What Is the Difference Between SMA vs EMA?
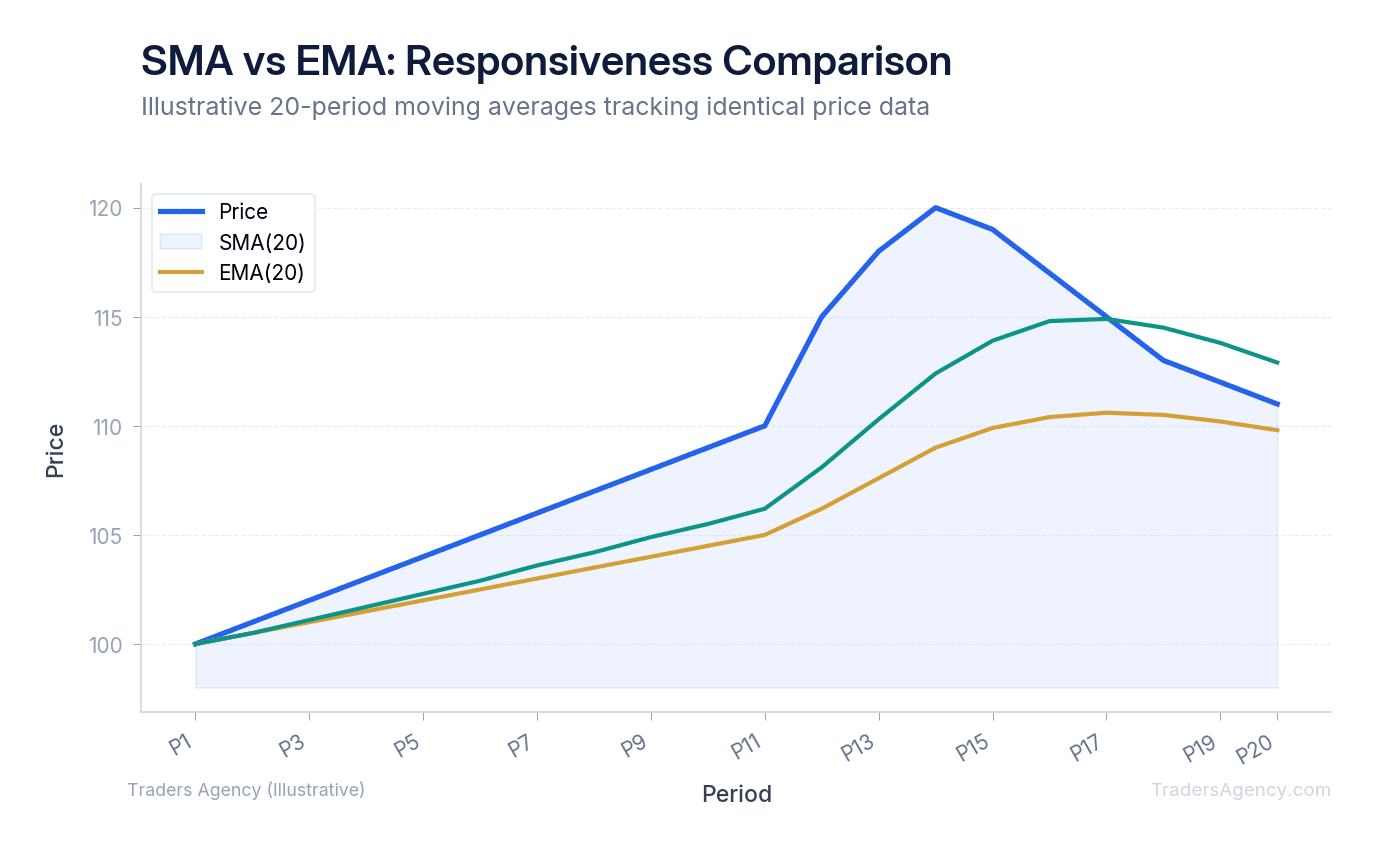
The main difference between SMA vs EMA is how they weight price data. The SMA treats all data points equally, creating a smoother line that reacts slowly to price changes. The EMA gives more weight to recent prices, creating a line that hugs current price action and reacts quickly.
When you put both lines on the same chart, the difference becomes obvious. During a fast market rally, the EMA will lead the way and stay closer to the candlesticks. The SMA will lag behind, slowly catching up to the new price levels.
Here's how our team compares them:
| Feature | SMA | EMA |
|---|---|---|
| Calculation Method | Simple average of all periods | Weighted multiplier favoring recent data |
| Reaction Time | Slow and smooth | Fast and responsive |
| Primary Use | Long-term trend identification | Short-term momentum and entry signals |
| Vulnerability | Can lag too much during fast reversals | Can produce false signals in choppy, sideways markets |
Understanding this difference dictates how you build your trading strategy. You don't have to choose just one. Many successful traders use both on the same chart to get a complete picture of the market.
How Do Moving Average Crossovers Generate Buy and Sell Signals?
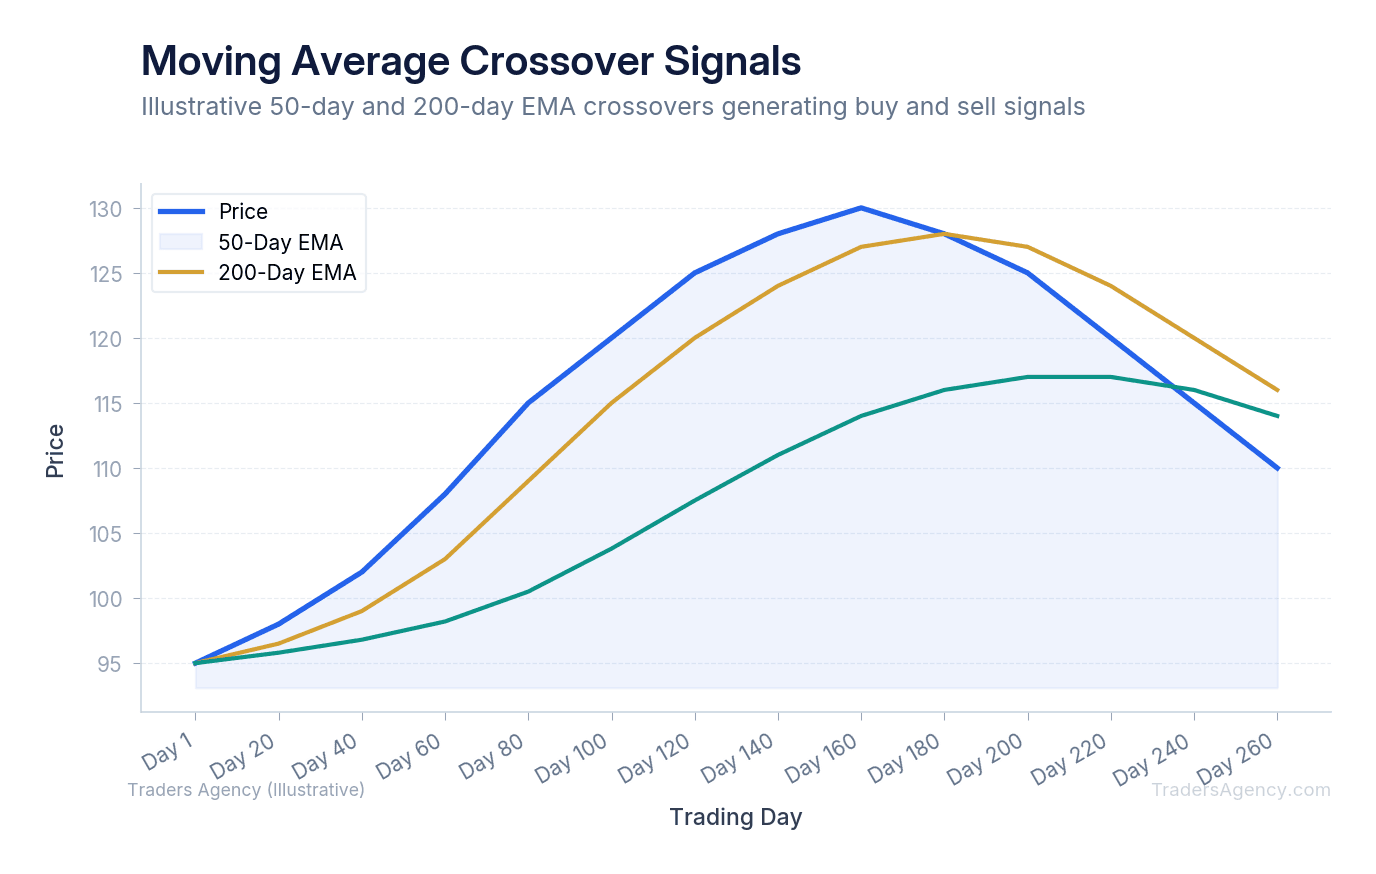
Moving average crossovers generate signals when a faster, short-term moving average crosses over or under a slower, long-term moving average. A bullish signal occurs when the short-term line crosses above the long-term line. A bearish signal occurs when the short-term line crosses below the long-term line.
The most famous crossover strategy involves the 50-day moving average and the 200-day moving average. When the 50-day crosses above the 200-day, it creates a pattern known as a Golden Cross. This tells traders that short-term momentum is now accelerating faster than long-term momentum. We view the Golden Cross as a strong signal that a new bull market or extended uptrend is beginning.
Conversely, when the 50-day crosses below the 200-day, it creates a Death Cross. This indicates that short-term prices are falling faster than the long-term average. Our team treats a Death Cross as a major warning sign to tighten stop losses or exit long positions.
Key Concept: A Golden Cross (50-day crossing above 200-day) signals bullish momentum. A Death Cross (50-day crossing below 200-day) signals bearish momentum. These are among the most widely watched signals in all of technical analysis.
Example Trade: Golden Cross Setup
Imagine stock XYZ has been trading at $100 for months. Suddenly, it starts climbing to $120.
| Parameter | Value |
|---|---|
| Stock | XYZ at $120 |
| 50-Day EMA | Rises to $115 |
| 200-Day EMA | Slowly rises to $105 |
| Signal | Golden Cross (50-day crosses above 200-day) |
| Entry | Buy at $120 |
| Stop Loss | $104 (just below the 200-day EMA) |
Want expert trading insights delivered daily?
Join thousands of traders who rely on Traders Agency for market analysis and trade ideas.
Join Traders AgencyWhich Moving Average Should You Use for Your Trading Style?
You should use an EMA for short-term trading styles like day trading and swing trading because it reacts quickly to sudden price changes. You should use an SMA for long-term investing and position trading because it smooths out temporary volatility and highlights major market trends.
Matching the right indicator to your specific timeframe is a required step for success. If you use a slow SMA on a 5-minute day trading chart, you'll get entry signals long after the move has already happened. If you use a fast EMA on a weekly investing chart, you'll get shaken out of great long-term holds by normal market pullbacks.
Here's what we teach our members regarding specific settings:
- Day Trading: We prefer the 9-period EMA and 20-period EMA on a 5-minute or 15-minute chart. These fast settings help you catch intraday momentum.
- Swing Trading: We use the 20-day EMA and 50-day SMA on a daily chart. The 20-day EMA helps time entries, while the 50-day SMA defines the broader trend.
- Long-Term Investing: We rely on the 50-day SMA and 200-day SMA on daily and weekly charts. These act as major boundaries for the overall health of the asset.
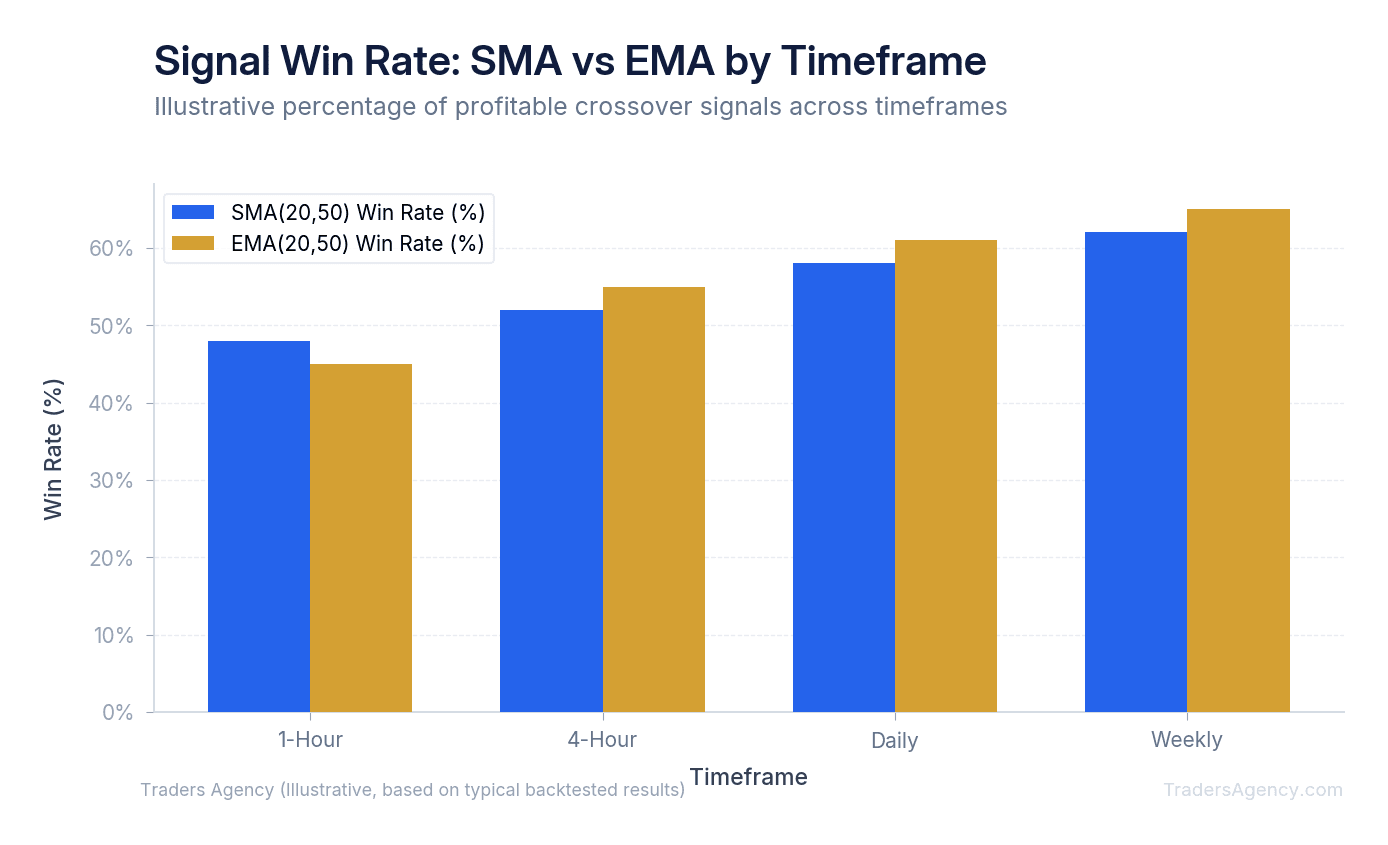
When testing SMA vs EMA across different asset classes, we find that both work well in equities, forex, and crypto. The key is adjusting the timeframe, not necessarily changing the indicator itself.
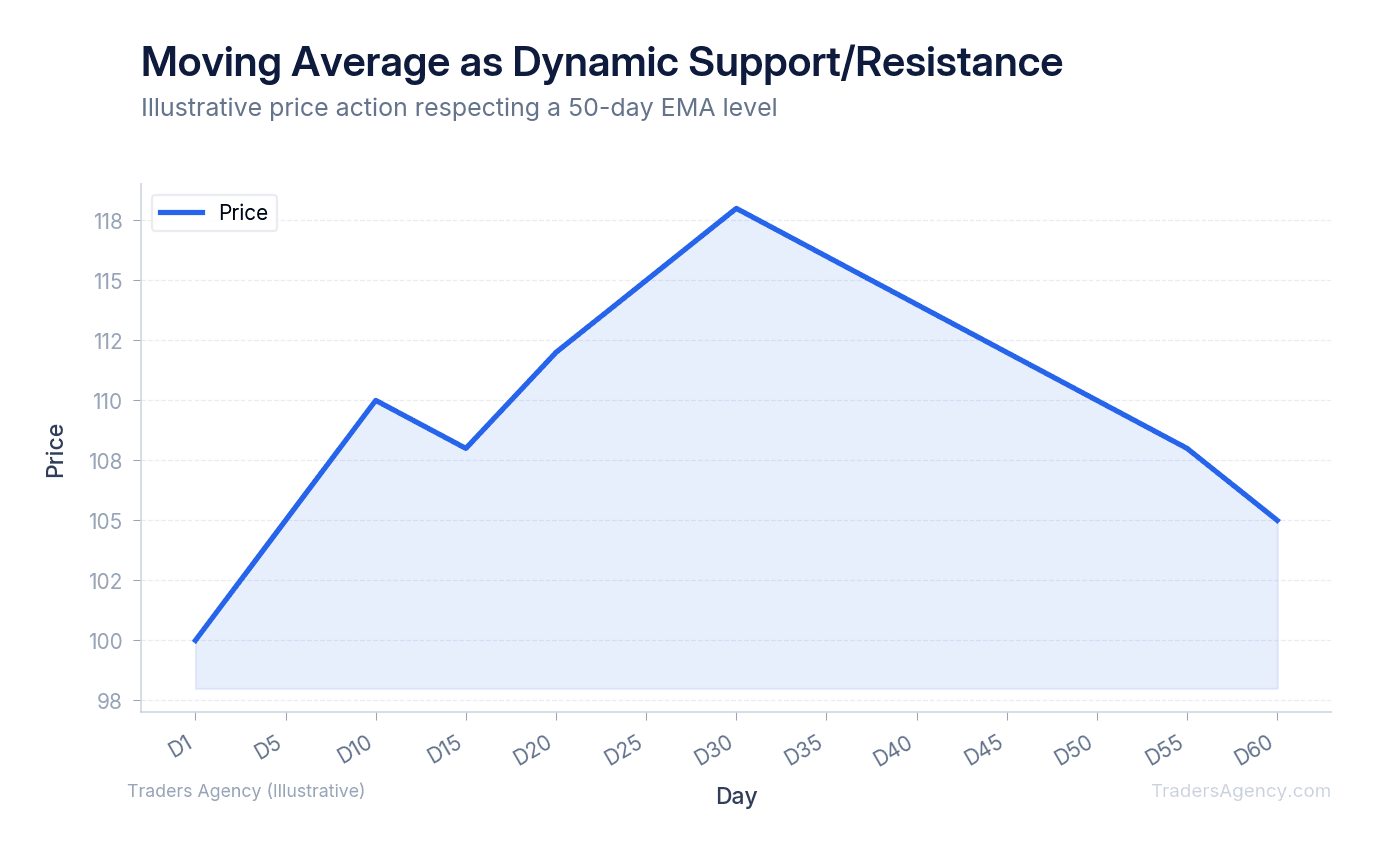
How Do You Use Moving Averages as Support and Resistance?
You use moving averages as support and resistance by watching how price reacts when it pulls back to the moving average line. In an uptrend, the moving average often acts as a floor where buyers step in. In a downtrend, it acts as a ceiling where sellers take over.
Institutional traders and algorithms heavily monitor major moving averages. Because so many market participants are watching the exact same lines, they often become self-fulfilling prophecies. When a strong stock drops down to touch its 50-day SMA, buyers frequently view that as a discount and start purchasing shares.
We look for very specific setups when trading these bounces. We want to see the price approach the moving average, touch it, and then form a bullish candlestick pattern (like a hammer) to confirm the bounce.
Example Trade: Moving Average Bounce
Imagine stock AAPL is in a strong uptrend, trading at $180.
| Parameter | Value |
|---|---|
| Stock | AAPL in uptrend at $180 |
| Pullback Low | $170 (minor market selloff) |
| 50-Day SMA | Sitting at $169.50 |
| Bounce Confirmation | Price touches $169.50, reverses to $172 |
| Entry | Buy at $172 |
| Stop Loss | $168 (just below moving average support) |
How Do You Set Up Moving Averages on Your Chart?
Now that you understand the mechanics behind SMA vs EMA, you need to know how to execute trades using them. Adding lines to a chart is easy. Filtering out bad signals and managing your risk requires discipline.
We recommend following a strict process before entering any trade based on a moving average signal.
- Define Your Timeframe and Select Your Indicators. First, decide if you are day trading, swing trading, or investing. Open your charting platform and add the appropriate moving averages. If you're swing trading, add the 20-day EMA and the 50-day SMA. Color code them so you never confuse the fast line with the slow line. We typically make our fast EMA a bright color like blue, and our slow SMA a heavy color like red.
- Wait for the Setup. Do not anticipate a crossover or a bounce. Wait for it to actually happen. A common mistake beginners make is buying a stock because it looks like the moving averages are about to cross. Market conditions can change instantly, causing the lines to repel each other instead of crossing. Wait for the daily candle to close to confirm the signal is real.
- Confirm with Trading Volume. Moving averages are lagging indicators, meaning they only tell you what has already happened. To increase your win rate, you must combine moving averages with volume confirmation. If a Golden Cross happens on very low trading volume, we ignore it. Low volume means large institutions are not participating in the move. If a crossover happens on volume that is 20% to 50% higher than average, we take the signal seriously.
- Implement Strict Risk Management. No technical indicator works 100% of the time. You will experience false signals, especially in choppy, sideways markets where moving averages tangle together. This is why risk management is a mandatory part of our trading system.
Watch Out: If the moving averages are flat and moving horizontally, do not trade crossover signals. Moving averages are trend-following tools. They only work when the market is actually trending up or down. Trading crossovers in a sideways market is one of the fastest ways to drain your account.
Risk Management Rules We Follow
- Position Sizing: Never risk more than 1% to 2% of your total account equity on a single moving average trade.
- Stop Losses: Always place a hard stop loss on your order. If you buy a bounce off the 50-day SMA, your stop loss should sit slightly below that moving average. If the price breaks below the line, the support has failed, and you must exit the trade immediately.
- Avoid Choppy Markets: When price is chopping back and forth across your moving averages with no clear direction, step aside and wait for a clean trend to develop.
By combining the speed of the EMA with the stability of the SMA, you can build a highly effective system for timing the market. Start by pulling up a chart of your favorite stock, add a 20-day EMA and a 50-day SMA, and simply study how the price has reacted to those lines over the past year. That observation alone will teach you more than any textbook.
Our education team publishes new strategy guides and market analysis every week. Put these moving average techniques into practice and watch how quickly your chart reading improves.
Want expert trading insights delivered daily?
Join thousands of traders who rely on Traders Agency for market analysis and trade ideas.
Join Traders AgencyKey Takeaways
- The SMA calculates a straight average of closing prices over a set period, giving equal weight to every data point. A 10-day SMA adds the last 10 closing prices and divides by 10.
- The EMA responds faster to recent price changes because it assigns more weight to newer data, making it more useful for short-term traders who need quicker signals.
- Combining a 20-day EMA with a 50-day SMA on the same chart gives you both speed and stability, helping you time entries while filtering out false signals.
- When the faster EMA crosses above the slower SMA, it can signal a developing uptrend. When it crosses below, it may indicate a trend reversal or weakening momentum.
- Studying how price has reacted to a 20-day EMA and 50-day SMA over the past year on a single chart is a practical, low-cost way to build real pattern recognition.
DISCLAIMER: Traders Agency does not offer financial advice. The information provided is for educational purposes only and should not be considered financial advice. Traders Agency is not responsible for any financial losses or consequences resulting from the use of the information provided. Trading carries inherent risks and may not be suitable for all individuals. You are advised to conduct your own research and seek personalized advice before making any investment decisions, recognizing the potential risks and rewards involved.
See more from Traders Agency on Google
Make us a preferred source and our market analysis will appear more prominently in your Google Search, Top Stories, and AI results.
Add to Preferred Sources