
Earnings per share, explained simply, is a company's total net income divided by its outstanding shares. This metric shows exactly how much money a business generates for each share of stock you own. We use it to measure profitability and compare companies within the same industry, and we consider it one of the most important numbers any trader should understand.
You've probably seen financial news headlines screaming about a company beating or missing earnings. These reports cause massive swings in stock prices, leaving many new traders confused about what actually happened. If you own stock, you own a piece of a business, and businesses exist to make money. Understanding how much money your specific piece of the business makes is the foundation of fundamental analysis.
Our team recommends mastering this concept before buying any individual stock. By the time you finish reading, you'll know how to calculate this metric, where to find it in official SEC filings, and how to use it to evaluate your next trade.
What Is Earnings Per Share and How Does It Work?
Bottom Line: EPS is the starting point for evaluating whether a company is actually making money for its shareholders, but the number only becomes useful when you put it in context with stock price, analyst expectations, and the P/E ratio. A stock beating earnings estimates can still be overpriced, and a modest EPS figure can represent excellent value depending on what you paid. Master this metric first, then layer in the other tools.
Think of a publicly traded company like a giant pizza. The total profit the company makes is the entire pizza. The outstanding shares are the individual slices. Earnings per share tells you exactly how much pepperoni is on your specific slice.
When you buy a share of stock, you're buying a claim on the company's future profits. If the company grows its total profits but also issues millions of new shares, your individual slice might actually lose value. This is why looking at total net income is never enough. You need to know the per-share value to understand if your investment is actually growing.
Key Concept: Earnings per share (EPS) measures how much profit a company generates for each individual share of stock. It's calculated by dividing total net income by the number of outstanding shares. Think of it as the company's report card for shareholders.
We teach our members to view EPS as a company's report card. A business can have great marketing and popular products, but if the earnings per share is negative or shrinking, the underlying business is struggling. Stock prices ultimately follow earnings over the long term.
How Is Earnings Per Share Calculated?
You calculate earnings per share by taking a company's total net income and dividing it by the total number of outstanding shares. If a company makes one million dollars and has one million shares, the earnings per share is exactly one dollar.
Here's a concrete example using specific numbers. Imagine Company A reports a net income of $500 million for the year. The company currently has 100 million shares outstanding in the open market.
To find the EPS, we divide the $500 million net income by the 100 million shares. This gives us an EPS of $5.00.
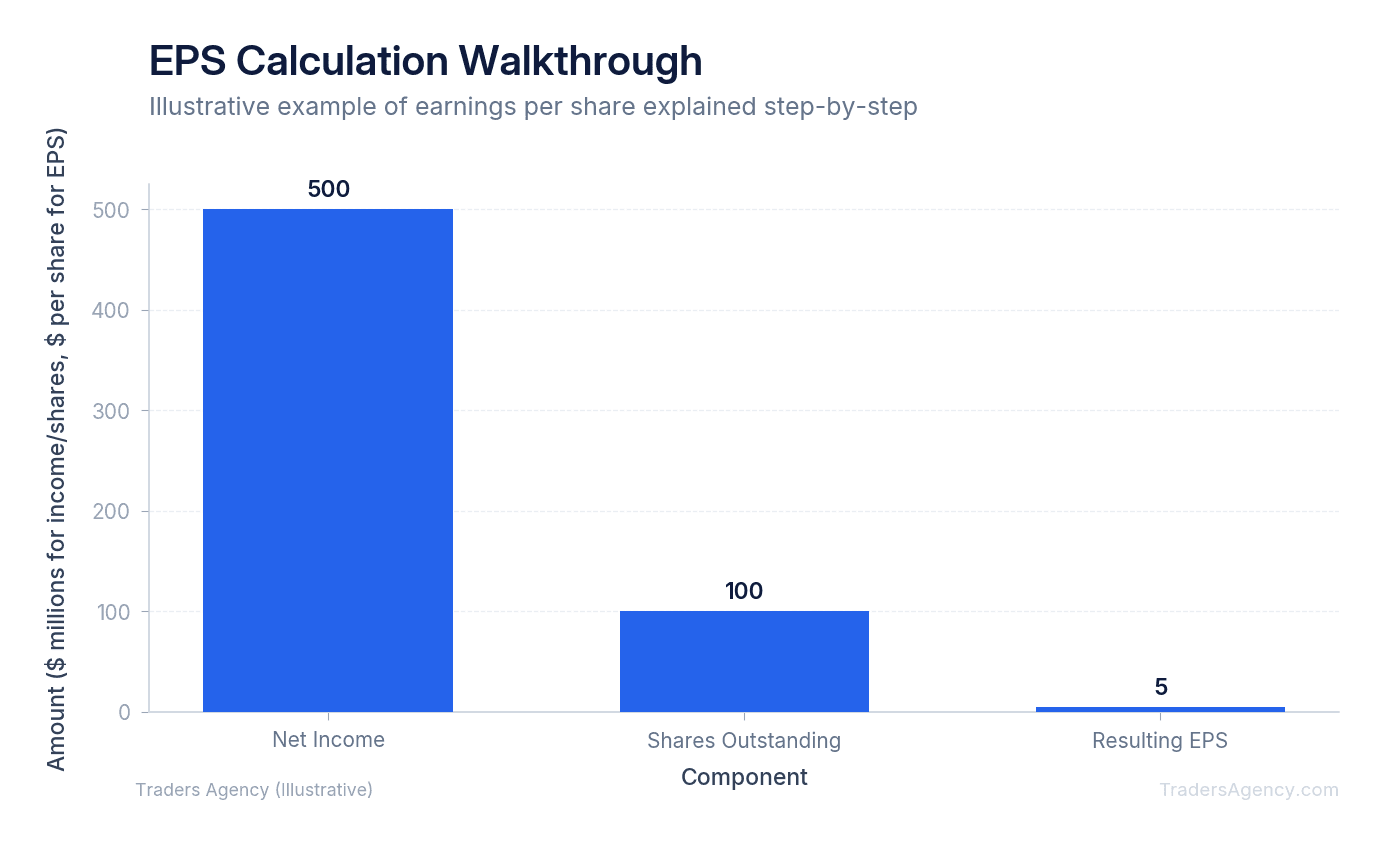
| Component | Value |
|---|---|
| Net Income | $500 million |
| Shares Outstanding | 100 million |
| EPS (Net Income ÷ Shares) | $5.00 |
This means that for every share you own, the company generated five dollars in profit. The company can choose to pay some of that five dollars out to you as a dividend, or they can reinvest it back into the business to fuel future growth.
Basic vs. Diluted EPS: What Is the Difference?
Basic EPS only counts the shares currently available in the open market. Diluted EPS includes all potential shares that could exist if employees exercise stock options or convert bonds into stock. We always look at diluted EPS because it shows the true, worst-case scenario for your ownership stake.
Many modern companies compensate their executives and employees with stock options. These options give employees the right to buy shares at a set price in the future. When those options are exercised, new shares are created out of thin air. This increases the total number of shares outstanding.
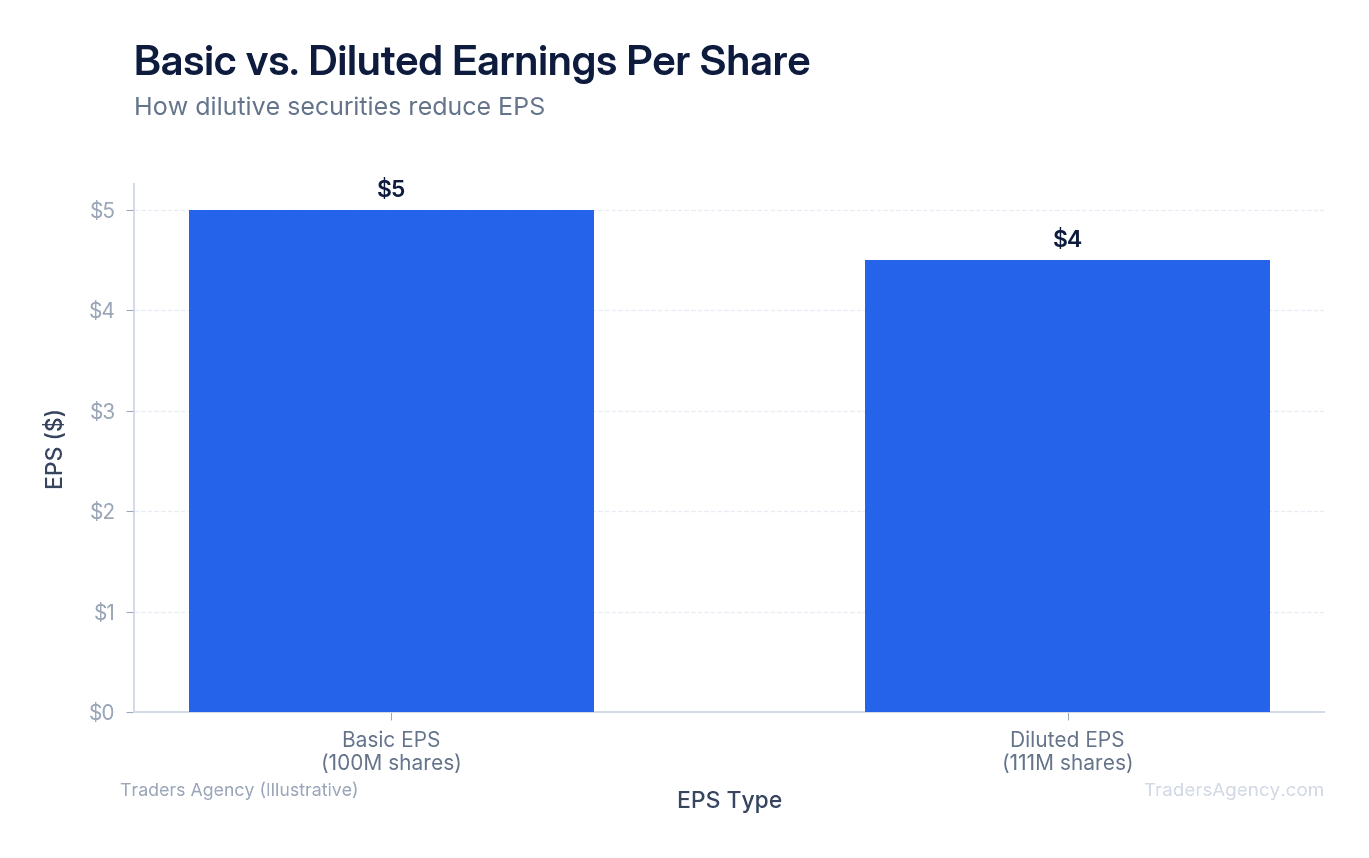
Let's return to Company A. They had 100 million basic shares and an EPS of $5.00. However, imagine they also have 11 million stock options waiting to be exercised by employees. If all those options are exercised, the new share count becomes 111 million.
| EPS Type | Net Income | Shares | EPS |
|---|---|---|---|
| Basic | $500M | 100M | $5.00 |
| Diluted | $500M | 111M | $4.50 |
When we divide the same $500 million net income by the new 111 million diluted shares, the diluted EPS drops to $4.50. Your slice of the pie just got smaller. This is why our team prefers to strictly use the diluted figure when evaluating a trade.
Watch Out: A company can show growing basic EPS while diluted EPS stays flat or even declines. Always check the diluted number. Heavy stock-based compensation can quietly erode your ownership stake over time.
Want expert trading insights delivered daily?
Join thousands of traders who rely on Traders Agency for market analysis and trade ideas.
Join Traders AgencyHow Do Stock Buybacks Affect Earnings Per Share?
Stock buybacks affect earnings per share by reducing the total number of outstanding shares. When a company buys its own stock, the denominator in the EPS formula shrinks. This artificially increases the earnings per share, even if the company's actual net income did not grow at all.
Companies often use their excess cash to buy their own shares on the open market and retire them. This is the exact opposite of dilution. By reducing the number of slices, each remaining slice represents a larger percentage of the total pie.
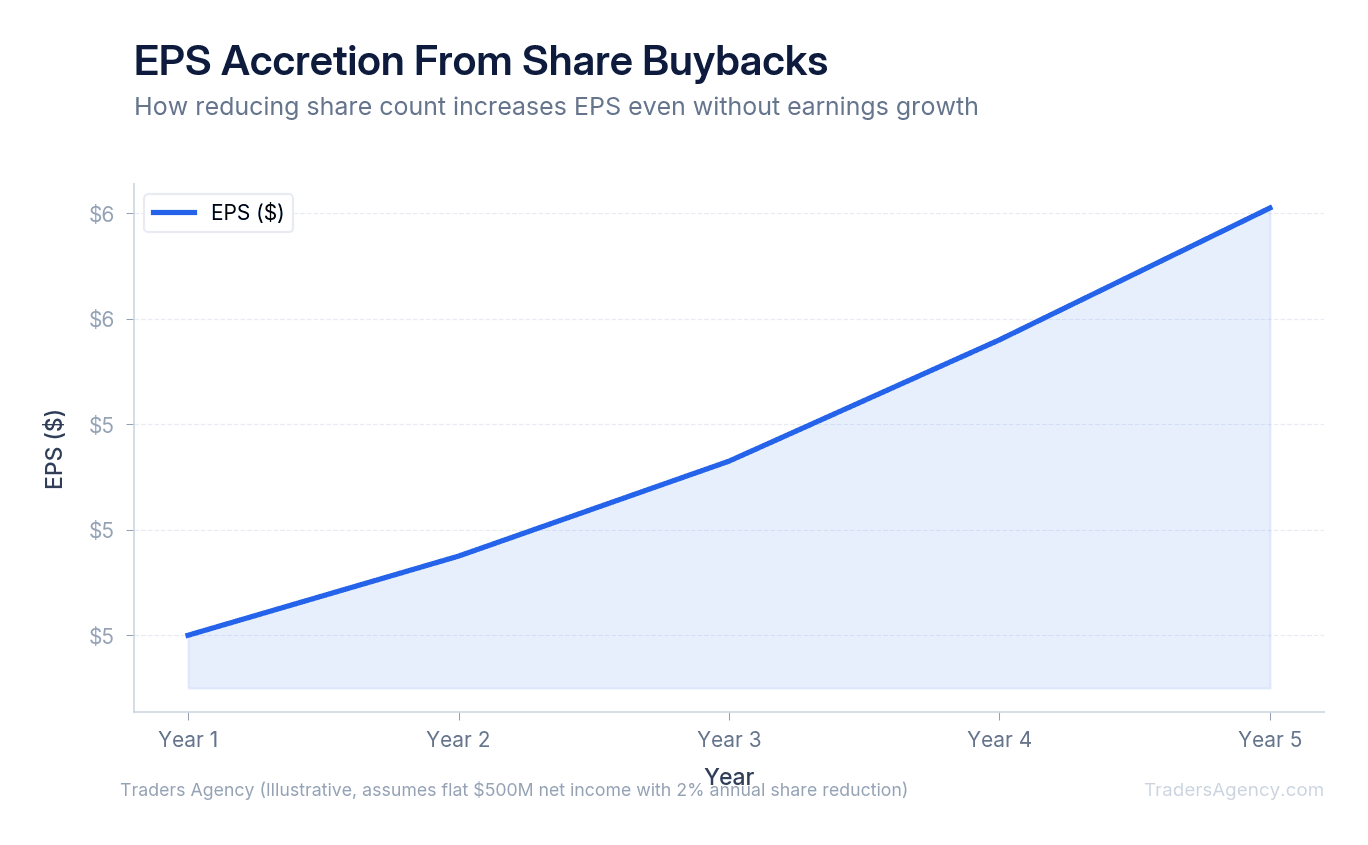
Imagine Company A still makes $500 million in net income. Instead of issuing new shares, management uses company cash to buy back 10 million shares. The share count drops from 100 million down to 90 million.
| Scenario | Net Income | Shares | EPS |
|---|---|---|---|
| Before Buyback | $500M | 100M | $5.00 |
| After Buyback | $500M | 90M | $5.56 |
The company did not actually sell more products or increase its total profit, but the EPS looks better on paper. We teach traders to watch out for companies that use heavy buybacks to hide a stagnant business. Always check whether EPS growth is coming from real revenue gains or just financial engineering.
Is a P/E Ratio of 40 Good or Bad?
A price-to-earnings ratio of 40 means you are paying forty dollars for every one dollar of earnings. This is generally considered expensive, but it can be justified if the company is growing its earnings per share rapidly year over year.
The Price-to-Earnings ratio (P/E) is directly built on top of EPS. You calculate it by taking the current stock price and dividing it by the EPS. If a stock trades at $200 per share and has an EPS of $5.00, the P/E ratio is 40.
Different sectors have different average P/E ratios. A utility company might trade at a P/E of 15 because its earnings are stable but slow-growing. A high-growth technology company might easily trade at a P/E of 40 or higher. Investors are willing to pay a premium today because they expect the EPS to double or triple in the coming years.
Key Concept: The P/E ratio tells you how much investors are willing to pay per dollar of earnings. A high P/E signals high growth expectations. A low P/E can mean the stock is undervalued or that the market expects earnings to decline. Always compare P/E ratios within the same sector for a meaningful comparison.
How to Interpret Analyst Estimates and Earnings Beats
Wall Street analysts spend their days predicting what a company's EPS will be in the next quarter. These predictions are averaged together to create the "consensus estimate." When a company reports its official numbers, the market reacts based on how the actual EPS compares to these estimates.
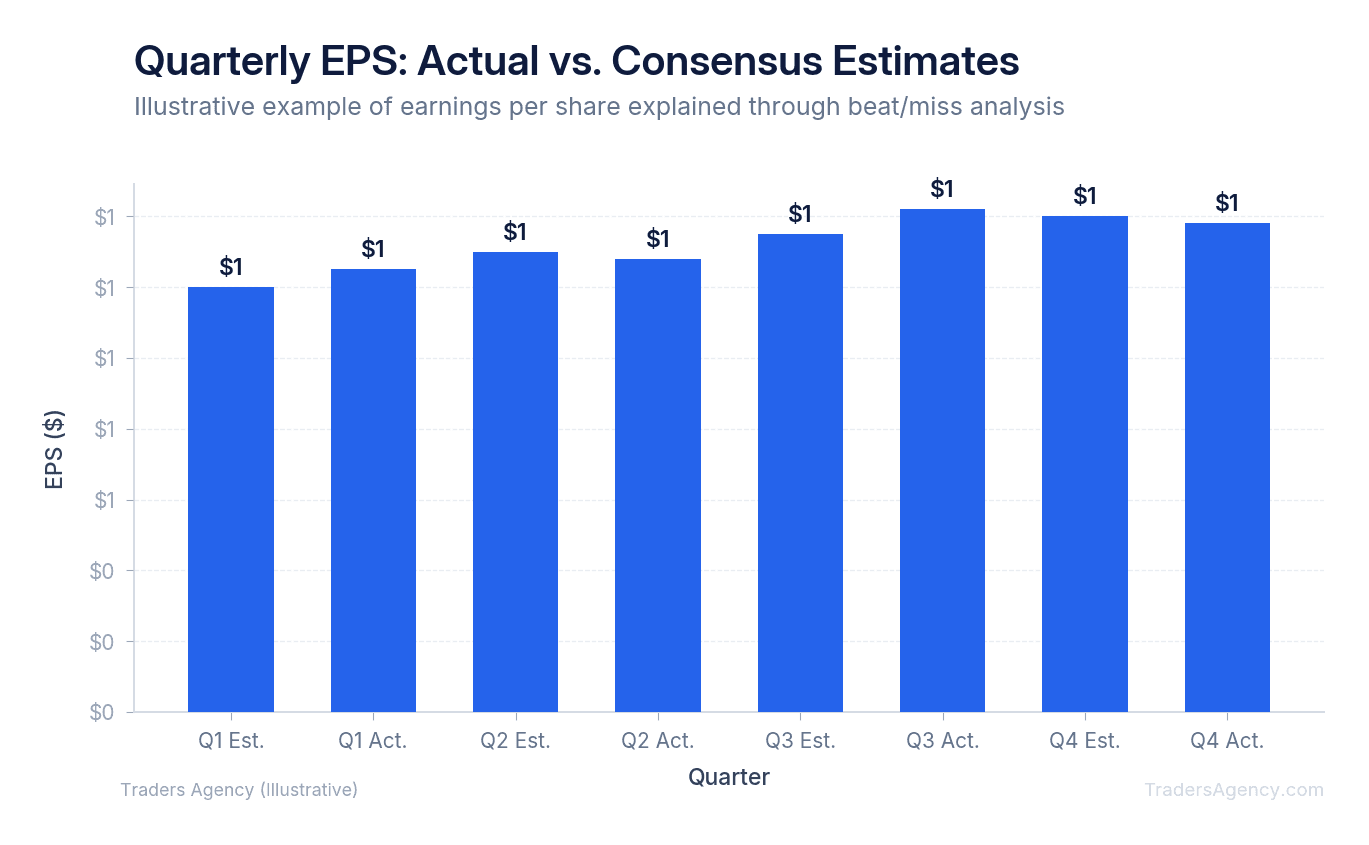
If the consensus estimate is $1.10 per share and the company reports $1.15, that is an earnings beat. If they report $1.05, that is an earnings miss.
However, we often see a stock drop even after beating EPS estimates. This happens because the market is forward-looking. If a company beats the current quarter's estimate but warns that next quarter's EPS will be lower than expected, traders will sell the stock immediately. The future guidance is often more impactful than the past quarter's performance.
Watch Out: Never assume an earnings beat means the stock will go up. Pay close attention to the company's forward guidance during the earnings call. A beat on this quarter's numbers paired with a weak outlook for next quarter can send shares tumbling.
Where Can You Find EPS Data for Any Stock?
You don't need to do the math yourself. Financial data is publicly available and strictly regulated. Having earnings per share explained is only helpful if you know where to pull the numbers. Here are the two best sources we recommend:
1. Read Official SEC Filings
The most accurate source for financial data is the Securities and Exchange Commission (SEC). Publicly traded companies must file quarterly reports (10-Q) and annual reports (10-K). You can search the SEC EDGAR database online for free. Open a company's income statement, scroll to the bottom, and you'll see the exact basic and diluted EPS figures reported by their accountants.
2. Check Free Financial Screeners
For quicker access, you can use financial portals provided by major exchanges or brokerages. When you pull up a stock quote on your trading platform, you'll usually see a data point labeled "EPS (TTM)." The letters TTM stand for Trailing Twelve Months. This adds up the earnings per share from the last four consecutive quarters to give you a full-year picture.
How Do You Use EPS to Make an Investment Decision?
Now that you understand the mechanics, you need to know how to apply this to your trading routine. We use EPS as a filtering tool to separate healthy businesses from struggling ones. Here are the specific steps we follow when evaluating a stock:
- Check the trend: We look at the EPS over the last five years. Is it growing steadily, staying flat, or shrinking? We prefer to buy companies with a clear history of consistent EPS growth.
- Compare within the sector: We never compare the EPS of a software company to the EPS of a bank. The business models are too different. Always compare a stock's EPS and P/E ratio to its direct competitors.
- Verify the source of growth: If EPS is growing, we check the share count. If net income is flat but the share count is dropping rapidly due to buybacks, we treat that growth with caution.
- Identify negative earnings: If a company has a negative EPS, they are losing money. This is common for early-stage biotech or tech startups, but it carries significantly higher risk. We adjust our position sizing down when trading unprofitable companies.
A common mistake new traders make is buying a stock simply because it has a high EPS number. A stock with an EPS of $10.00 is not automatically better than a stock with an EPS of $2.00. The stock price dictates the value. If the $10.00 EPS stock costs $1,000 per share, and the $2.00 EPS stock costs $20 per share, the second stock is actually offering you more earnings for your investment dollar.
| Stock | Price | EPS | P/E Ratio |
|---|---|---|---|
| Stock A | $1,000 | $10.00 | 100 |
| Stock B | $20 | $2.00 | 10 |
Risk management is a core part of our methodology. We never base a trade entirely on one metric. EPS is a powerful tool for understanding profitability, but it must be combined with price action analysis, volume tracking, and strict stop losses to protect your capital.
Want expert trading insights delivered daily?
Join thousands of traders who rely on Traders Agency for market analysis and trade ideas.
Join Traders AgencyKey Takeaways
- EPS is calculated by dividing a company's total net income by its outstanding shares, giving you a per-share profit figure you can compare across companies in the same industry.
- A higher EPS number does not automatically mean a better investment. A stock with $10.00 EPS priced at $1,000 per share has a P/E ratio of 100, while a $2.00 EPS stock priced at $20 delivers far more earnings per dollar invested.
- When a company issues new shares, your slice of the profit pie shrinks even if total profits grow. Tracking diluted EPS helps you catch this.
- Analyst estimates matter as much as the EPS number itself. A company can report strong earnings and still see its stock drop if it missed Wall Street's expectations.
- EPS should never be used in isolation. Pair it with price action analysis, volume tracking, and stop losses before making any trade decision.
DISCLAIMER: Traders Agency does not offer financial advice. The information provided is for educational purposes only and should not be considered financial advice. Traders Agency is not responsible for any financial losses or consequences resulting from the use of the information provided. Trading carries inherent risks and may not be suitable for all individuals. You are advised to conduct your own research and seek personalized advice before making any investment decisions, recognizing the potential risks and rewards involved.
See more from Traders Agency on Google
Make us a preferred source and our market analysis will appear more prominently in your Google Search, Top Stories, and AI results.
Add to Preferred Sources