
You've probably seen this happen during earnings season. A company reports record profits, but the stock immediately drops 10%. Understanding the dynamic of earnings guidance vs estimates is the key to figuring out why this happens. In short, it's a comparison between what a company expects to earn in the future (guidance) and what Wall Street analysts predict the company will earn (estimates). We'll walk you through exactly how these two numbers drive stock prices and how you can use them to find better trading setups.
Many new traders focus entirely on past performance. They look at last quarter's revenue and assume the stock will rise if the number is positive. The stock market does not work this way. The market is a forward-looking machine that prices in future expectations. Our team recommends focusing on forward-looking data rather than past performance to find better trading setups. By the end of this guide, you'll know how to read these metrics, spot hidden opportunities, and manage your risk around earnings announcements. You'll learn to think like a professional trader when evaluating fundamental data.
What Is the Difference Between Earnings Guidance vs Estimates?
Bottom Line: The core lesson is that stock prices reflect future expectations, not past results. Traders who learn to compare company guidance against analyst estimates, and who monitor how those estimates shift over time, gain a meaningful edge in identifying setups before the market moves. Pair that fundamental edge with strict position sizing and a pre-defined exit plan, and earnings season becomes a source of opportunity rather than a source of surprise losses.
The difference between earnings guidance vs estimates comes down to the source of the prediction. Earnings guidance is the official financial forecast provided by a company's management team. Analyst estimates are the financial predictions calculated by independent Wall Street professionals who study the stock.
When you look up a stock on a financial platform, you usually see the analyst consensus estimates. This consensus is simply the average of all the individual analyst predictions. If 20 analysts cover a stock, the consensus is the mathematical average of their 20 different forecasts. Analysts publish these numbers to give investors a benchmark for success.
Company guidance usually comes directly from the executive team during quarterly earnings calls. Management will project their expected revenue, profit margins, and earnings per share (EPS) for the upcoming quarter or full year. They base these numbers on internal sales data, supply chain costs, and market trends. Guidance is the company telling the public exactly what they expect to achieve.
Key Concept: The tension between guidance and estimates creates massive trading opportunities. If a company issues guidance below the analyst consensus, the stock typically drops. If guidance comes in above estimates, it usually triggers a rally. The market prices stocks based on future expectations, not past results.
How Are Analyst Consensus Estimates Built?
To understand earnings guidance vs estimates, you need to know how analysts build their models. Wall Street analysts spend their days building complex financial models for specific companies. They pull historical data from official SEC filings (10-K and 10-Q reports) to establish a baseline of past performance.
Analysts then adjust these models based on macroeconomic trends, interest rates, and consumer spending habits. They project future cash flows and apply valuation multiples to arrive at their individual EPS estimates. Financial data providers then aggregate these numbers to create the official consensus estimate that you see on your trading screen.
The Role of Whisper Numbers
Sometimes the official consensus does not tell the whole story. This brings us to whisper numbers. A whisper number is the unofficial, unpublished earnings expectation that professional traders actually believe the company will report. It represents the true sentiment of the smart money.
Whisper numbers circulate among institutional investors and trading desks. If the official consensus estimate for a stock is $1.50 per share, the whisper number might be $1.65 per share. If the company reports $1.55, they technically beat the official estimate. However, the stock might still fall because they missed the higher whisper number.
Retail traders can find whisper numbers on specialized financial websites or by tracking options market pricing. Options premiums often inflate before an earnings report. By studying the implied volatility of these options, you can calculate the expected percentage move and deduce what the market really expects.
Why Do Companies Sandbag Their Own Guidance?
Companies sandbag their own guidance to intentionally lower Wall Street expectations so they can easily beat them later. Management teams issue conservative forecasts, knowing that beating estimates in the next quarter will trigger a positive stock reaction. This practice is a common strategy to manage investor psychology.
We see this happen in the market every single quarter. A CEO will warn about macroeconomic headwinds or supply chain constraints during an earnings call. They'll lower their official guidance for the next quarter to $2.00 per share, even though internal data suggests they'll easily hit $2.20. They are setting a low bar on purpose.
Wall Street analysts then lower their consensus estimates to match the new, gloomy guidance. Three months later, the company reports $2.15 per share. They easily beat the lowered estimates, the financial media reports a massive earnings beat, and the stock price rallies.
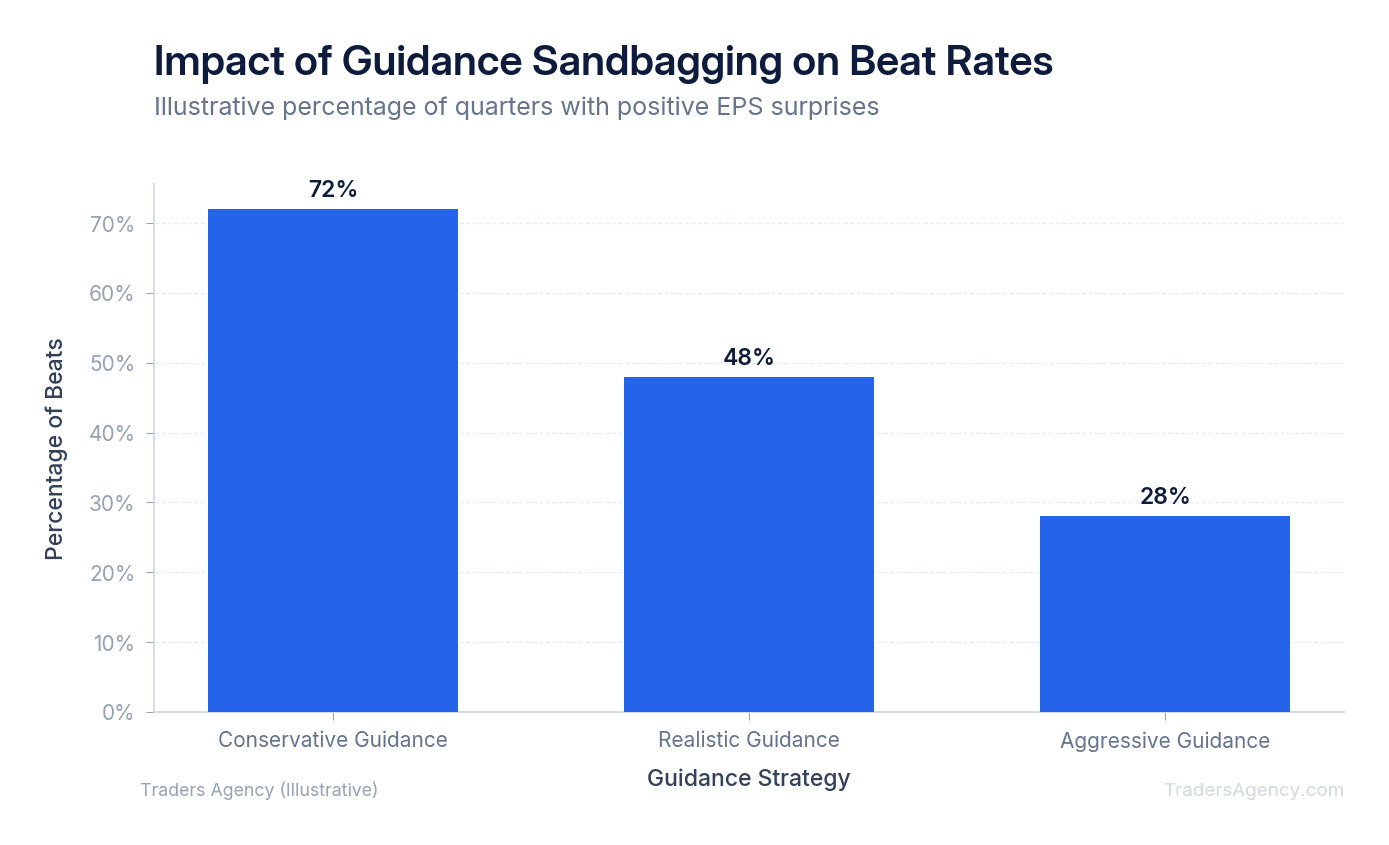
Our team teaches traders to look for signs of guidance sandbagging. If a company has a long history of lowering guidance and then miraculously beating estimates by 10% every quarter, they are likely sandbagging. You can use this historical pattern as a contrarian signal when planning your trades. Do not panic when a known sandbagger issues weak guidance.
Forward P/E vs Trailing P/E: Which Number Actually Matters?
Forward P/E matters much more than trailing P/E because the stock market is a forward-looking mechanism. Trailing P/E measures a stock's valuation based on the past 12 months of earnings. Forward P/E measures valuation based on projected earnings for the next 12 months.
Standard financial references always display the trailing P/E ratio by default. If a stock trades at $100 and earned $5.00 over the last year, its trailing P/E is 20. This tells you what happened in the past, but it tells you absolutely nothing about the future trajectory of the business.
The forward P/E ratio uses analyst consensus estimates to value the company. If analysts expect that same company to earn $10.00 next year, the forward P/E is only 10. The stock is actually much cheaper than the trailing P/E suggests. This is why high-growth stocks often look expensive on a trailing basis but cheap on a forward basis.
| Metric | Calculation | Value | What It Tells You |
|---|---|---|---|
| Stock Price | Current market price | $100 | What you pay today |
| Trailing EPS | Last 12 months earnings | $5.00 | Past performance |
| Trailing P/E | $100 / $5.00 | 20x | Looks expensive |
| Forward EPS | Next 12 months estimate | $10.00 | Future expectations |
| Forward P/E | $100 / $10.00 | 10x | Actually cheap |
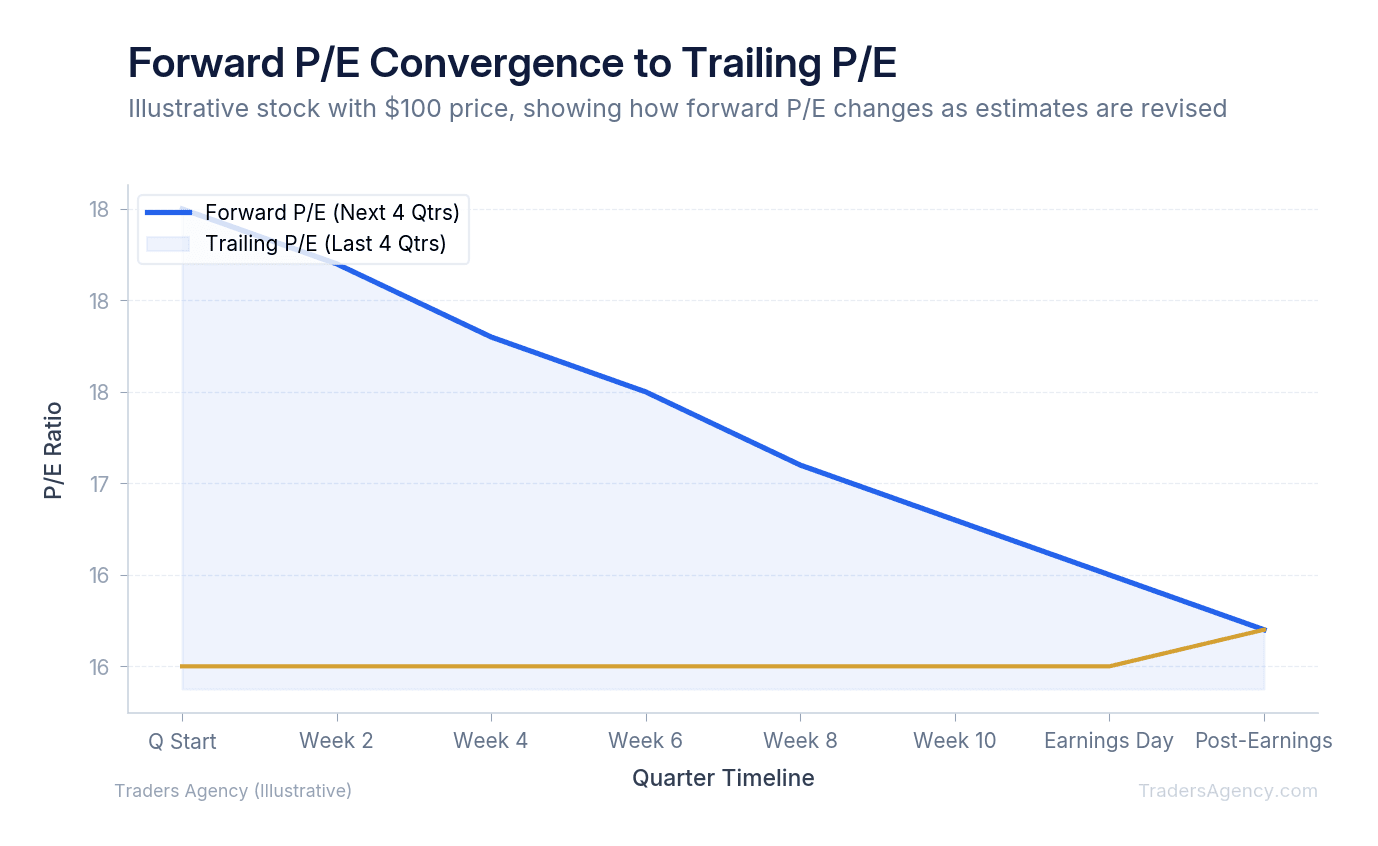
Relying on trailing earnings is a massive mistake for beginner traders. A stock might look expensive based on last year's numbers but could be a bargain based on next year's estimates. We prefer to evaluate every potential trade using forward earnings yield and projected growth rates.
Want expert trading insights delivered daily?
Join thousands of traders who rely on Traders Agency for market analysis and trade ideas.
Join Traders AgencyHow Do You Use Estimate Revisions as a Trading Signal?
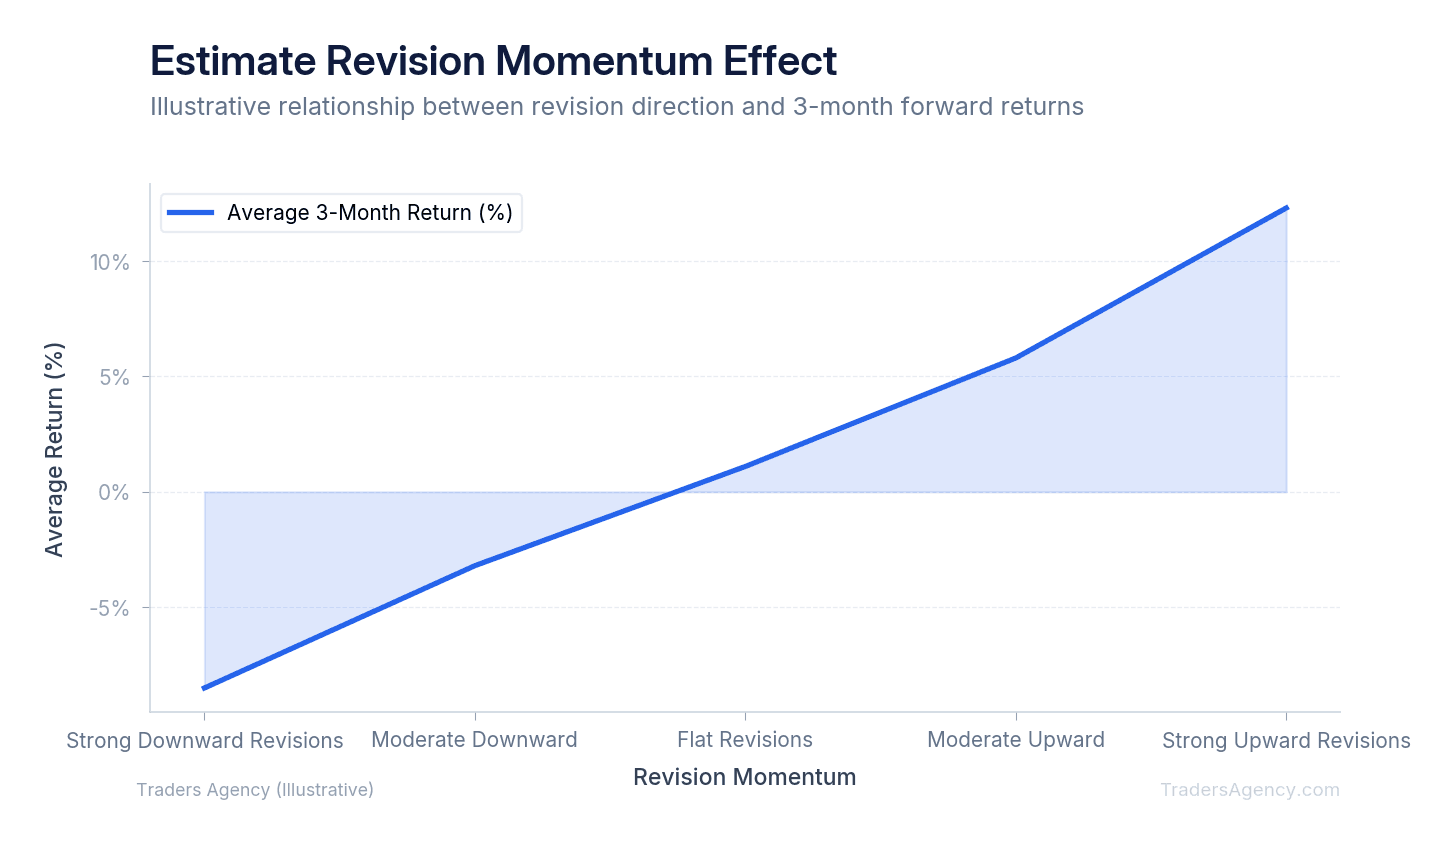
One of the most powerful ways to use earnings guidance vs estimates is by tracking estimate revision momentum. When analysts repeatedly raise their earnings estimates for a company, the stock tends to outperform the broader market. This is a fundamental trend that technical traders can use to confirm their chart setups.
Analysts do not raise estimates for no reason. They revise their models upward because they see improving business conditions, higher profit margins, or better-than-expected sales data. This upward revision cycle creates a strong fundamental tailwind for the stock price. Institutional buyers notice these revisions and start accumulating shares.
Step-by-Step: Trading Estimate Revision Momentum
Here's a concrete example of how you can trade this concept. Imagine you're researching a tech stock currently trading at $150 per share. You want to know if the fundamental trend supports a long position.
- Check the Current Consensus: Look at a financial screener and find the current consensus EPS estimate for the next quarter. In this case, it's $2.50.
- Review the 90-Day Trend: Check the history of this estimate. Ninety days ago, the consensus was only $2.10. Thirty days ago, it was $2.30.
- Identify the Momentum: Analysts have raised their estimates by nearly 20% over the last three months. This is strong positive revision momentum.
- Execute the Trade: Buy the stock at $150 with a stop loss at $140. You're aligning your trade with the upward trajectory of Wall Street expectations.
- Monitor the Outcome: If the company reports $2.60 and issues strong guidance, the stock rallies to $170. If they miss estimates, your stop loss protects your capital.
Key Concept: We use estimate revisions as a primary screening tool. Buy stocks where estimates are going up and avoid stocks where analysts are quietly slashing their forecasts. A stock with falling estimates is fighting an uphill battle regardless of what the chart looks like.
Practical Applications for Your Trading Strategy
Understanding earnings guidance vs estimates is only useful if you apply it correctly. You should use this data to time your entries and exits around earnings season. Market conditions heavily influence how stocks react to these numbers, so you must stay aware of the broader economic environment.
In a bull market, companies that beat estimates and raise guidance will see massive buying pressure. In a bear market, even a strong earnings beat might be ignored if the company issues cautious guidance for the future. You must always read the fundamental data through the lens of current market sentiment.
When to Use This Strategy
We recommend focusing on forward earnings and estimate revisions when building longer-term swing trades. If you plan to hold a stock for three to six months, the trajectory of analyst estimates will dictate your success. Short-term day traders might ignore this data, but swing traders rely on it.
You should also use this data when evaluating a stock that has recently crashed. If a stock drops 20% but analysts are actually raising their forward estimates, you might have found a severe mispricing. The market has temporarily disconnected from the fundamental reality of the company, creating a buying opportunity.
Common Mistakes to Avoid
Watch Out: Beginner traders often buy a stock solely because it has a low trailing P/E ratio. This is a classic value trap. A stock might have a trailing P/E of 8, but if analysts are cutting their forward estimates by 50%, the stock is actually expensive on a forward basis.
Another common mistake is holding a full position through an earnings announcement without a plan. Earnings events are highly volatile. Even if you correctly predict the earnings guidance vs estimates dynamic, a single negative comment from the CEO during the conference call can tank the stock.
How Should You Manage Risk Around Earnings Announcements?
You must protect your account when trading around earnings data. No matter how strong the estimate revision momentum looks, earnings reports are binary events. The stock will either gap up or gap down when the numbers hit the wire. You cannot control the outcome, but you can control your exposure.
Our team prefers to reduce position sizes heading into an earnings report. If your standard position size is $5,000, consider cutting it to $2,500 before the company reports. This limits your exposure to a catastrophic gap down if the company issues terrible guidance. You can always add the size back after the market digests the news.
Setting Proper Stop Losses
Always use hard stop losses when trading fundamental strategies. If you buy a stock based on strong forward estimates, you need an exit plan if the technical trend breaks. Fundamentals tell you what to buy, but technicals tell you when to sell.
- Place stops below major support: Set your stop loss 2% to 3% below a significant moving average or recent swing low.
- Respect the gap down: If a stock gaps below your stop loss after a bad earnings report, sell immediately at the market open. Do not hold and hope it recovers.
- Limit total allocation: Never risk more than 1% to 2% of your total account equity on a single trade.
Risk Warning: Earnings reports are binary events with unpredictable outcomes. Even the strongest fundamental setup can fail on a single disappointing comment during a conference call. Always reduce position size before earnings and have a defined exit plan before the numbers are released.
By combining the fundamental power of earnings guidance vs estimates with strict risk management, you can build a highly effective trading system. Focus on the future, track the revisions, and always protect your downside.
Want expert trading insights delivered daily?
Join thousands of traders who rely on Traders Agency for market analysis and trade ideas.
Join Traders AgencyKey Takeaways
- Earnings guidance comes from company management, while analyst estimates come from independent Wall Street professionals. These two numbers often diverge, and that gap is where trading opportunities hide.
- A stock can drop sharply after reporting record profits if the company's forward guidance disappoints. Past performance is irrelevant if future expectations fall short of what analysts had priced in.
- Tracking estimate revisions over time is a concrete trading signal. When analysts repeatedly revise estimates upward ahead of an earnings report, it often signals growing institutional conviction in the stock.
- Risk management around earnings requires reducing position size before the report is released. Even a strong fundamental setup can unravel on a single comment during a post-earnings conference call.
- Never risk more than 1% to 2% of total account equity on a single earnings trade. Earnings events are binary and unpredictable, so a defined exit plan must be in place before the numbers drop.
DISCLAIMER: Traders Agency does not offer financial advice. The information provided is for educational purposes only and should not be considered financial advice. Traders Agency is not responsible for any financial losses or consequences resulting from the use of the information provided. Trading carries inherent risks and may not be suitable for all individuals. You are advised to conduct your own research and seek personalized advice before making any investment decisions, recognizing the potential risks and rewards involved.
See more from Traders Agency on Google
Make us a preferred source and our market analysis will appear more prominently in your Google Search, Top Stories, and AI results.
Add to Preferred Sources