
You've probably seen a technology stock trading at 45 times its earnings while a bank stock trades at just 10 times its earnings. This massive gap confuses traders trying to figure out if a stock is a bargain or a trap. We're going to show you exactly how to read valuation multiples by sector so you can tell the difference, and by the end of this guide, you'll know how to apply these benchmarks to your own stock screening process, identify rotation opportunities, and avoid common valuation traps that cost traders money.
What Are Valuation Multiples by Sector and Why Do They Differ?
Bottom Line: Valuation multiples only mean something when measured against the right benchmark: the historical range for that specific sector, not the market average. A stock that looks expensive against the S&P 500 median can still be cheap relative to its own industry peers. Combine sector-specific multiple analysis with disciplined risk management and you shift from guessing to measuring.
Valuation multiples by sector are industry-specific benchmark ratios that measure how much investors are willing to pay for a company's earnings, sales, or assets. They differ because each sector has unique growth rates, profit margins, and capital requirements. Investors pay higher multiples for fast-growing industries and lower multiples for mature, capital-intensive businesses.
Think of it like real estate. A beachfront condo will always command a higher price per square foot than a warehouse in an industrial park. The same logic applies to the stock market.
A software company with 80% gross margins will naturally trade at a higher multiple than a grocery store with 2% gross margins. The software company can scale its product to millions of users with almost zero additional cost. The grocery store must build physical locations, hire staff, and manage perishable inventory to grow.
Key Concept: A "good" valuation multiple is always relative to the sector. A P/E of 15 can be expensive for a bank and dirt cheap for a software company. Always compare within the same industry.
You can find the raw data needed to calculate these multiples in quarterly 10-Q reports filed with the SEC. Our team relies on these official filings to ensure the data is accurate before running any relative comparisons.
What Are Normal P/E Ratios by Sector?
The Price-to-Earnings (P/E) ratio is the most common metric traders use. It divides the current stock price by the earnings per share. However, a "good" P/E ratio depends entirely on the sector. Our team looks at historical averages to establish a baseline. You cannot compare a utility company to a semiconductor manufacturer.
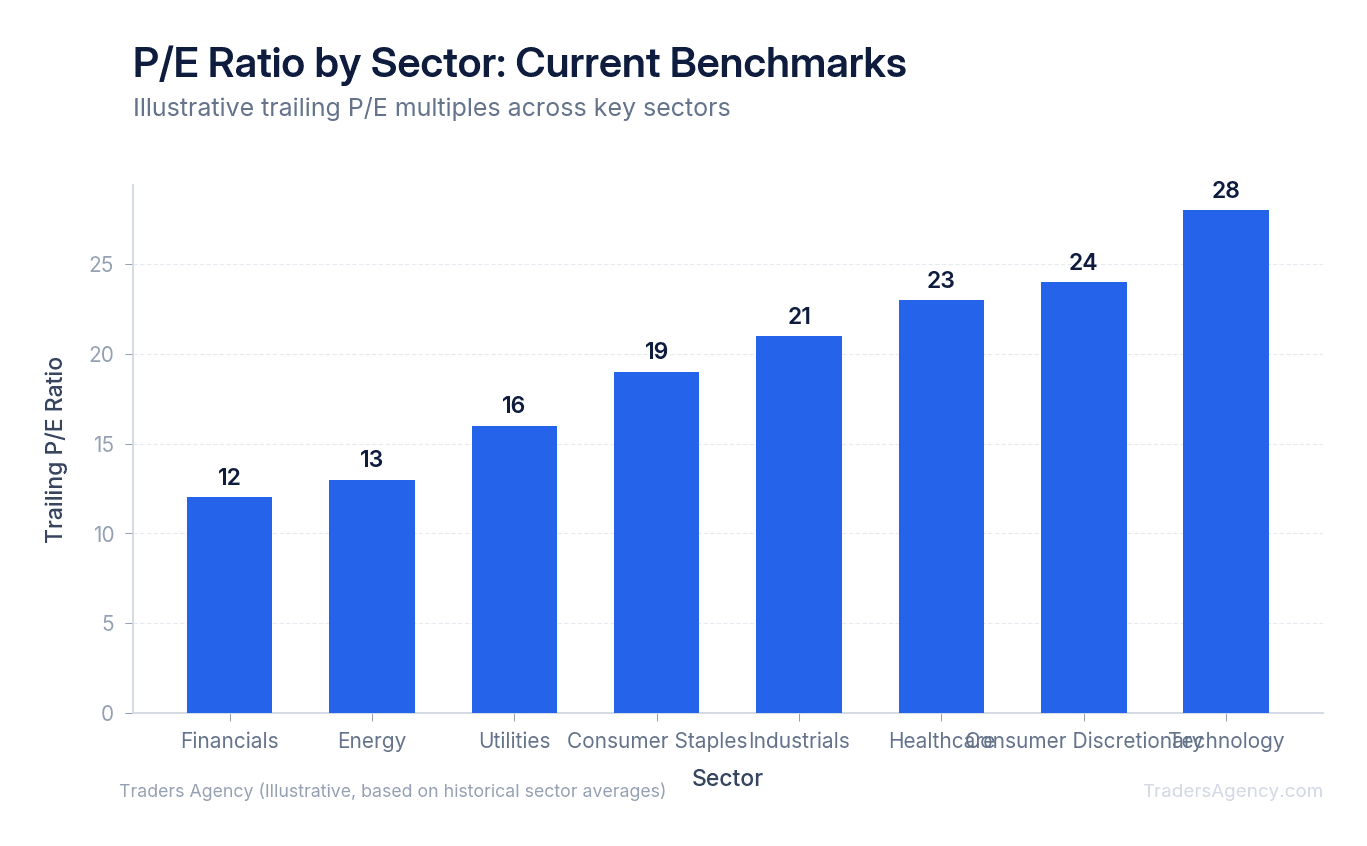
Here are typical historical P/E ranges for major sectors:
| Sector | Typical P/E Range |
|---|---|
| Financials | 10 to 14 |
| Energy | 12 to 15 |
| Industrials | 15 to 18 |
| Consumer Staples | 18 to 21 |
| Technology | 22 to 28 |
If you see a bank stock trading at a 15 P/E, it is actually expensive for its sector. If you see a software stock trading at a 15 P/E, it is significantly cheap. Understanding these baseline ranges prevents you from buying an overvalued bank just because its absolute P/E number looks low compared to the broader market.
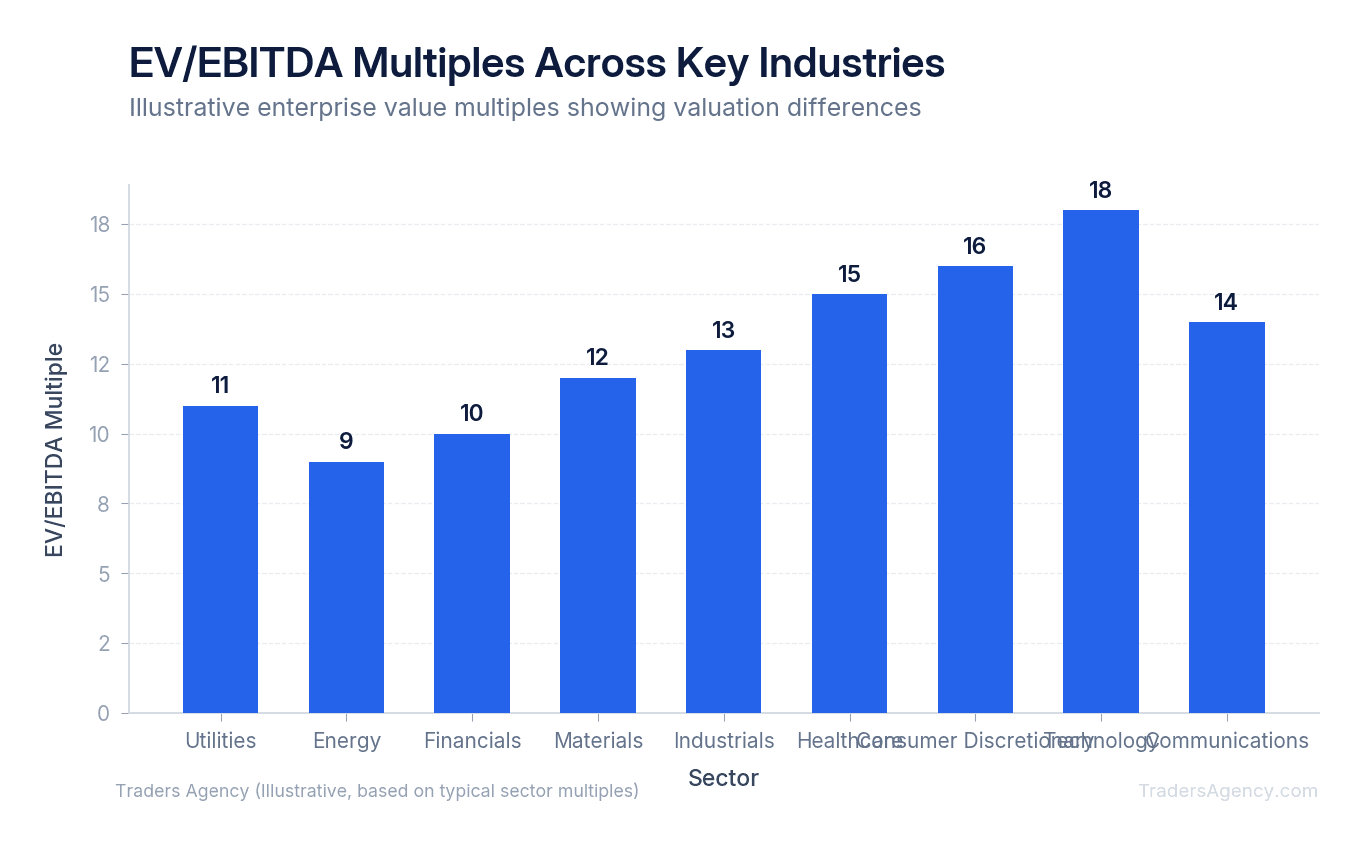
What Does EV/EBITDA Tell You About a Stock's Value Across Industries?
EV/EBITDA measures a company's total enterprise value relative to its core operational cash flow, ignoring debt and tax differences. This multiple provides an apples-to-apples comparison of companies with different capital structures. It is especially useful for evaluating capital-intensive or highly indebted sectors.
Enterprise Value (EV) includes the company's market cap plus its total debt, minus its cash. EBITDA stands for Earnings Before Interest, Taxes, Depreciation, and Amortization.
We prefer EV/EBITDA over P/E when looking at sectors like telecommunications, energy, or utilities. These companies carry massive debt loads to build infrastructure. Because the P/E ratio is heavily skewed by interest payments on that debt, it often paints an inaccurate picture of the company's actual cash-generating power.
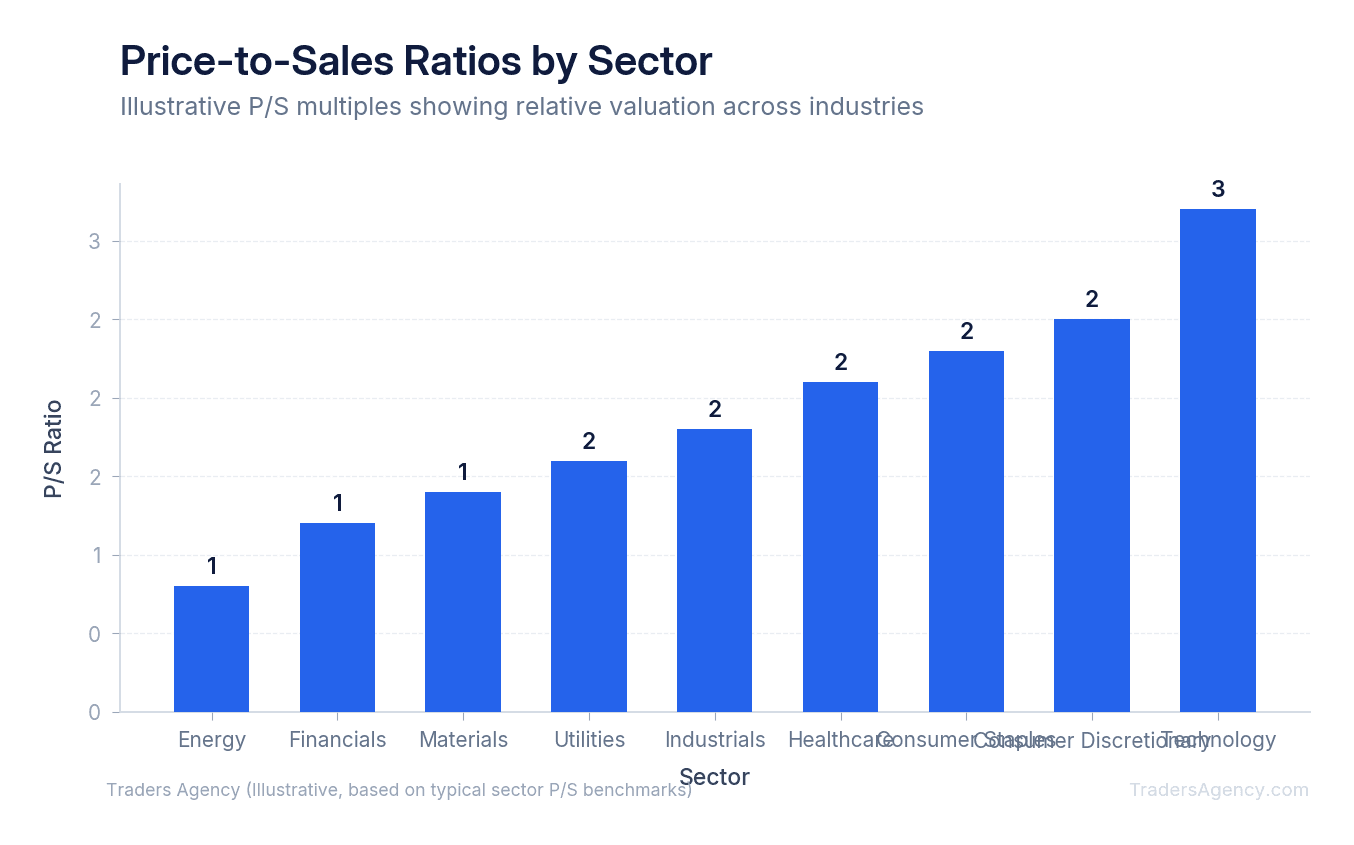
We also look at the Price-to-Sales (P/S) ratio for companies that do not yet have positive earnings. A typical P/S ratio for a mature retailer might be 0.5, meaning investors pay 50 cents for every dollar of sales. A high-growth cloud computing firm might trade at a 10 P/S, meaning investors pay ten dollars for every dollar of sales.
Why Do Cyclical and Defensive Sectors Trade at Different Valuations?
Understanding the economic cycle is required when evaluating valuation multiples by sector. Sectors fall into two main categories: cyclical and defensive.
Cyclical sectors, like consumer discretionary and industrials, see their earnings rise and fall with the broader economy. Think of an auto manufacturer. When the economy is strong, people buy new cars. When a recession hits, car sales plummet.
Defensive sectors, like healthcare and utilities, maintain stable earnings regardless of economic conditions. People still need heart medication and electricity during a recession.
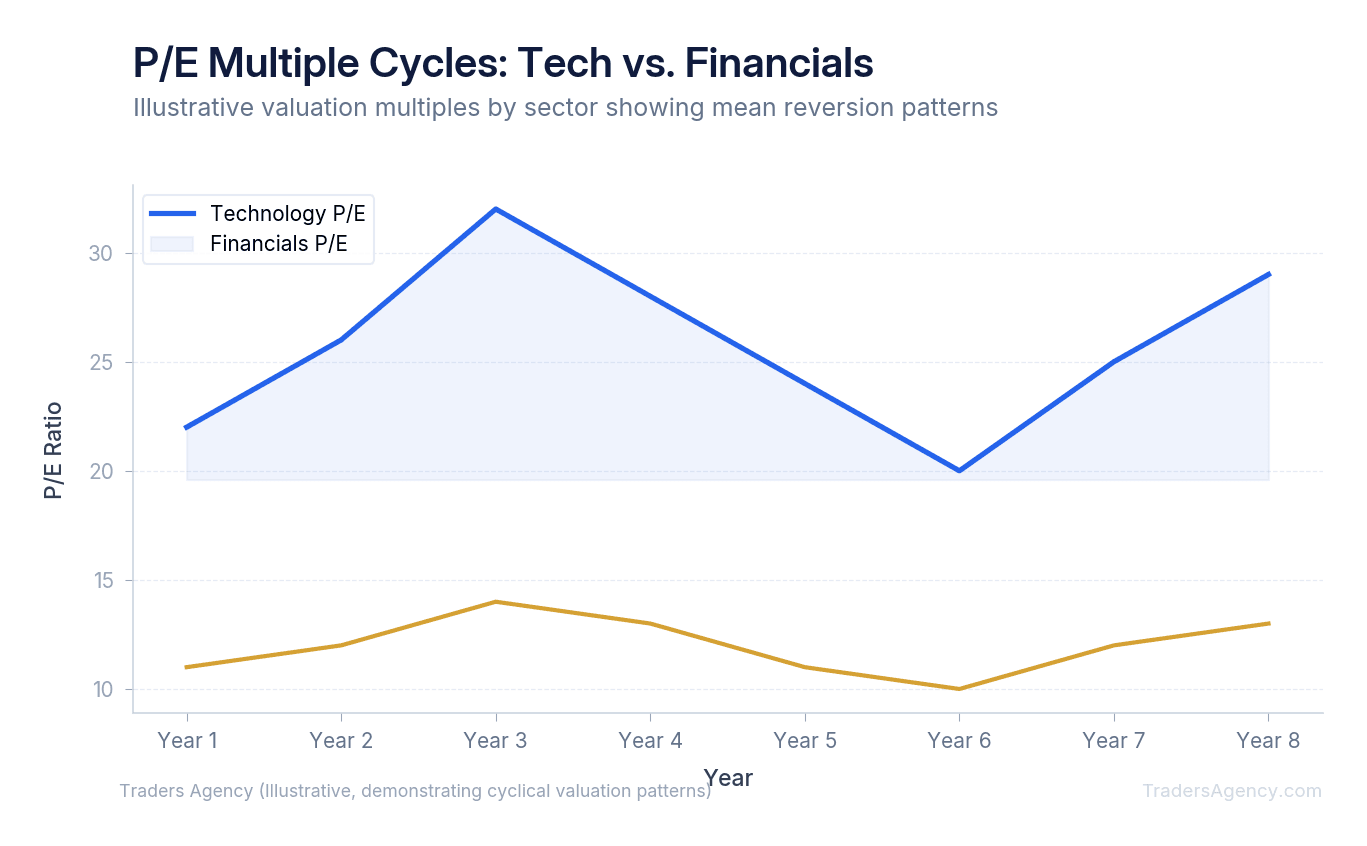
During a recession, cyclical stocks often show artificially high P/E ratios because their earnings have temporarily collapsed. Conversely, at the peak of an economic boom, cyclical stocks look incredibly cheap because their earnings are at a temporary maximum.
Key Concept: Our team teaches traders to look for mean reversion. When a sector's multiple stretches too far above or below its 10-year historical average, it usually snaps back. Buying a cyclical stock when its P/E looks unusually high during an economic trough is often a profitable long-term setup.
Want expert trading insights delivered daily?
Join thousands of traders who rely on Traders Agency for market analysis and trade ideas.
Join Traders AgencyHow Do You Identify Cheap Sectors Using Relative Multiple Analysis?
You identify cheap sectors using relative multiple analysis by comparing a sector's current valuation ratio to its own historical average and to the broader market index. If a sector historically trades at a 10% discount to the S&P 500 but is currently trading at a 30% discount, it is statistically undervalued.
This process helps traders spot rotation opportunities. Money constantly moves between sectors as large institutions hunt for bargains. When technology stocks become too expensive, fund managers rotate their capital into cheaper sectors like industrials or materials. Tracking valuation multiples by sector over time gives you a clear framework for anticipating these capital flows.
For example, if the broader market trades at a 20 P/E and the healthcare sector trades at a 15 P/E, you must ask if that gap is normal. If healthcare normally trades at an 18 P/E, the sector is currently offering a discount. We use standard financial reference platforms to track these historical spreads.
Step-by-Step Example: Comparing Two Stocks Using Sector Multiples
Here's a concrete example of how to apply this in an actual trading scenario. We'll compare two hypothetical companies to show how sector context changes everything.
- Identify the setup and gather data. First, you need the basic pricing and earnings data for the stocks you want to evaluate.
Parameter Company A (BKA) Company B (CYB) Sector Regional Banking Cybersecurity (Software) Stock Price $50 $100 Earnings Per Share $5.00 $4.00 P/E Ratio 10 25 - Compare against the specific sector benchmark. Next, pull the current valuation multiples by sector to establish your baselines. The regional banking sector currently averages an 8 P/E. The software sector currently averages a 35 P/E.
- Execute the analysis. Without sector context, Company A looks like the better value. However, relative to its peers, Company A is actually trading at a 25% premium (10 vs. 8). Company B looks expensive at first glance. Yet, relative to its software peers, it is trading at a massive discount (25 vs. 35).
- Determine the outcome. If Company B simply reverts to its sector average of 35, the stock price would need to rise from $100 to $140 (assuming earnings stay constant at $4.00). This presents a clear upside target for a swing trade. Meanwhile, Company A carries downside risk. If it reverts to its sector average of 8, the stock price would drop from $50 to $40.
| Stock | Current P/E | Sector Average P/E | Premium/Discount | Mean Reversion Target |
|---|---|---|---|---|
| BKA | 10 | 8 | +25% (Expensive) | $40 (downside risk) |
| CYB | 25 | 35 | -29% (Cheap) | $140 (upside opportunity) |
When Should You Use This Strategy (And When Should You Avoid It)?
You should use sector multiple analysis when building a medium to long-term swing trading portfolio, screening for undervalued stocks, or confirming a sector rotation trend. You should avoid this strategy for short-term day trading, as valuation metrics do not impact intraday price action or immediate momentum setups.
Valuation acts like gravity. It matters immensely over months and years, but it means almost nothing over hours and days. A stock can remain overvalued or undervalued for a long time before the market corrects the pricing.
Here's how our team recommends fitting this into your broader trading plan:
- Position Sizing: Never allocate your entire portfolio to a single "cheap" sector. We prefer capping sector exposure at 15% to 20% of total capital to protect against prolonged downturns.
- Technical Confirmation: Do not buy a stock just because it has a low multiple. Wait for the stock to break above a key moving average, like the 50-day SMA, to confirm buyers are actually stepping in.
- Avoiding Value Traps: A stock with a 4 P/E is usually cheap for a reason. Always check if the company is facing bankruptcy, massive lawsuits, or declining revenue before buying.
Watch Out: A cheap stock can always get cheaper. We teach our members to always use stop losses, placing them below recent structural support levels regardless of how attractive the valuation multiple looks. Risk management comes first, always.
By combining fundamental sector analysis with strict risk management, you give yourself a mathematical edge in the markets. You stop guessing if a stock is cheap and start measuring it against hard data.
Want expert trading insights delivered daily?
Join thousands of traders who rely on Traders Agency for market analysis and trade ideas.
Join Traders AgencyKey Takeaways
- A software company with 80% gross margins will naturally trade at a higher multiple than a grocery store with 2% gross margins because it can scale to millions of users with near-zero additional cost.
- Valuation multiples differ by sector because each industry has unique growth rates, profit margins, and capital requirements. Paying 45x earnings for a tech stock and 10x for a bank stock can both be rational depending on context.
- A stock with a 4x P/E is not automatically a bargain. Distressed valuations often signal bankruptcy risk, major litigation, or structural revenue decline.
- Sector rotation opportunities appear when one sector's multiples compress significantly below its own historical range, not just below another sector's current multiple.
- Stop losses placed below recent structural support levels should be used regardless of how attractive a valuation multiple looks. Cheap stocks can always get cheaper.
DISCLAIMER: Traders Agency does not offer financial advice. The information provided is for educational purposes only and should not be considered financial advice. Traders Agency is not responsible for any financial losses or consequences resulting from the use of the information provided. Trading carries inherent risks and may not be suitable for all individuals. You are advised to conduct your own research and seek personalized advice before making any investment decisions, recognizing the potential risks and rewards involved.
See more from Traders Agency on Google
Make us a preferred source and our market analysis will appear more prominently in your Google Search, Top Stories, and AI results.
Add to Preferred Sources