
You have probably seen this happen. A stock boasts an incredible 12% yield, so you buy shares expecting massive passive income. Six months later, the company slashes the dividend, the stock price plummets, and your principal investment is cut in half. Our team recommends a more calculated approach. Generating consistent income from the stock market requires more than just chasing the highest percentage payout. It requires understanding the underlying mechanics of corporate cash flow. By the end of this guide, you will know exactly how to evaluate payout sustainability, calculate yield on cost, and blend both strategies for long-term success.
Key Concept: Dividend yield vs dividend growth is a fundamental comparison between stocks that pay a high immediate cash return and stocks that pay a lower initial return but consistently increase their payouts over time. We teach both approaches so you can construct a reliable income portfolio tailored to your timeline.
What Is the Difference Between Dividend Yield and Dividend Growth?
Bottom Line: The core lesson here is that yield percentage alone is not a measure of income quality. Sustainable income portfolios require evaluating payout ratios, earnings trends, and debt levels alongside yield. Investors who understand both dividend yield and dividend growth can combine the two approaches to generate reliable cash flow now while protecting purchasing power for the future.
The difference between dividend yield and dividend growth comes down to timeline and total return. Dividend yield measures the current annual payout as a percentage of the stock price, offering immediate income. Dividend growth measures how fast a company increases its cash payout year over year, providing future inflation protection.
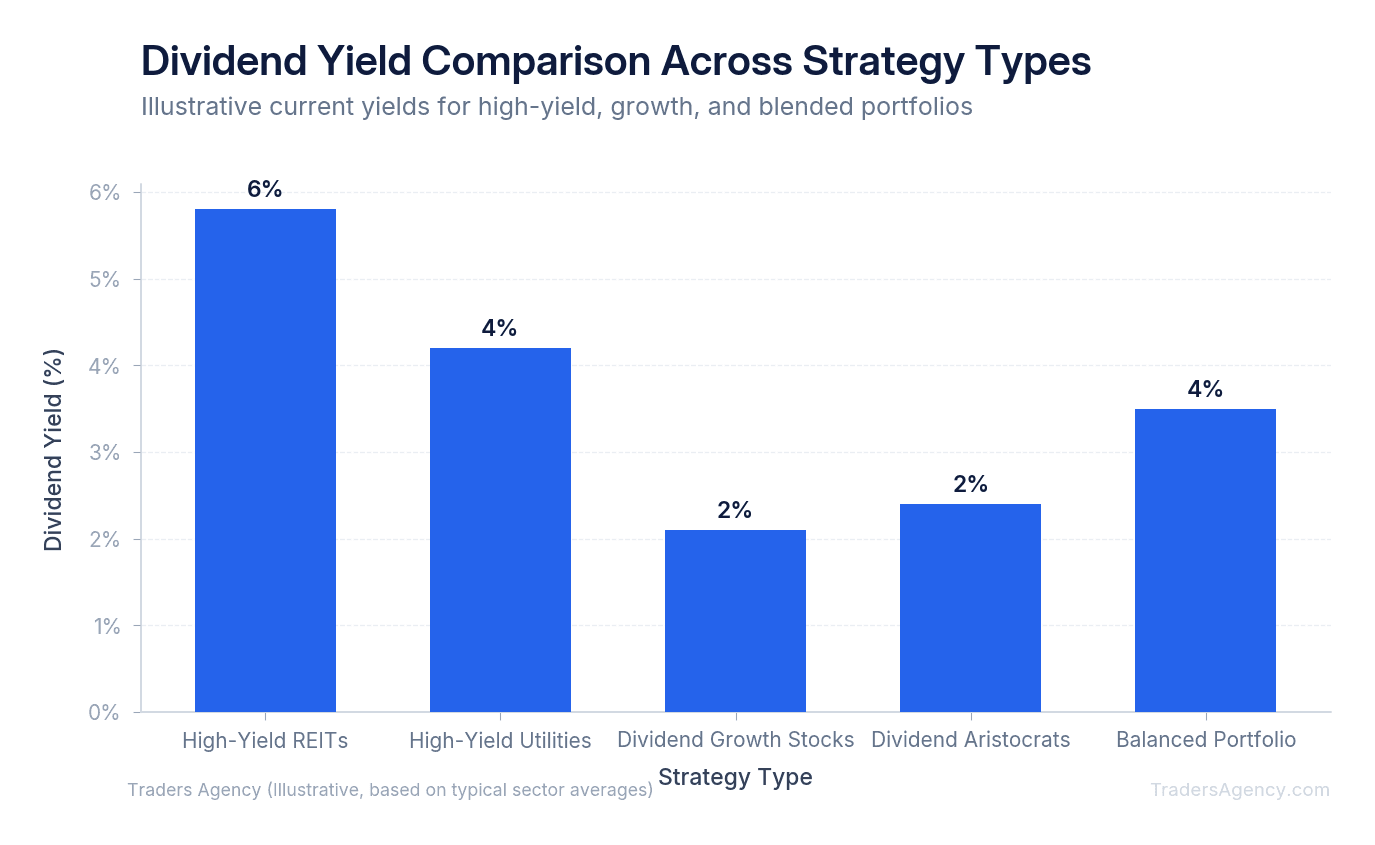
High dividend yield stocks often belong to mature companies in slow-growing sectors like utilities, energy, or telecommunications. They distribute most of their earnings to shareholders because they have fewer internal expansion opportunities. If a utility company stock trades at $50 per share and pays $3.00 annually, the dividend yield is 6.0%.
Dividend growth stocks typically start with lower initial yields, often between 1.5% and 3.0%. However, these companies retain enough earnings to fund business expansion while still raising their shareholder payouts annually.
Think of it like choosing between two jobs. One offers a flat $80,000 salary with no chance of a raise. The other starts at $60,000 but guarantees a 7% raise every single year. Over a long enough timeline, the second job eventually pays more in annual income.
How Does DRIP Compounding Amplify Returns Over Time?
DRIP compounding amplifies returns by automatically using your cash dividends to purchase additional shares of the underlying stock. As your share count increases, your future dividend payments also increase, creating a compounding cycle that accelerates your total wealth without requiring new capital.
When you combine a Dividend Reinvestment Plan (DRIP) with a strong dividend growth strategy, the math becomes incredibly powerful. You are not just earning dividends on your original investment. You are earning dividends on your dividends.
Most modern brokerages allow for fractional share reinvestment. If your dividend payment is $15.00 and the stock trades at $30.00, the DRIP automatically buys 0.5 shares. Your money never sits idle as uninvested cash. It goes to work immediately.
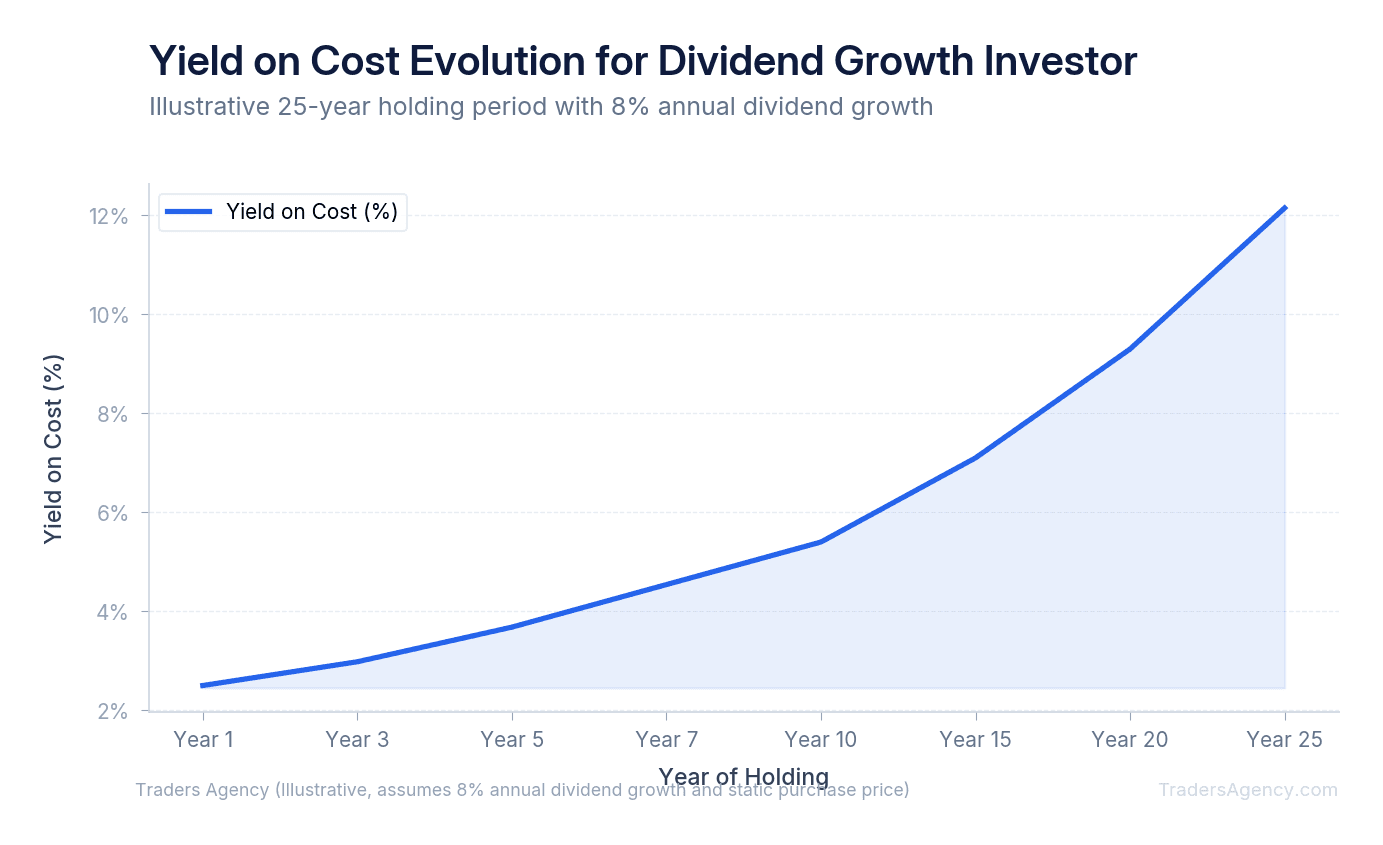
This brings us to a concept we teach called Yield on Cost (YOC). YOC calculates your current dividend income based on your original purchase price, rather than the current market price.
| Year | Annual Dividend Per Share | Yield on Cost (Original $100) |
|---|---|---|
| Year 1 | $3.00 | 3.0% |
| Year 5 | $4.41 | 4.41% |
| Year 10 | $6.48 | 6.48% |
| Year 15 | $9.52 | 9.52% |
| Year 20 | $13.98 | 13.98% |
If you buy a stock at $100 per share with a $3.00 annual dividend, your initial yield is 3.0%. If that company raises its dividend by 8% annually for a decade, the annual payout grows to roughly $6.48 per share. Your Yield on Cost is now 6.48% on your original $100 investment. If you reinvested those dividends along the way, your actual income is even higher because you now own more than your original single share. Over twenty years, this compounding effect can turn a modest starting yield into a massive income stream.
Which Strategy Produces Better Long-Term Income: Yield or Growth?
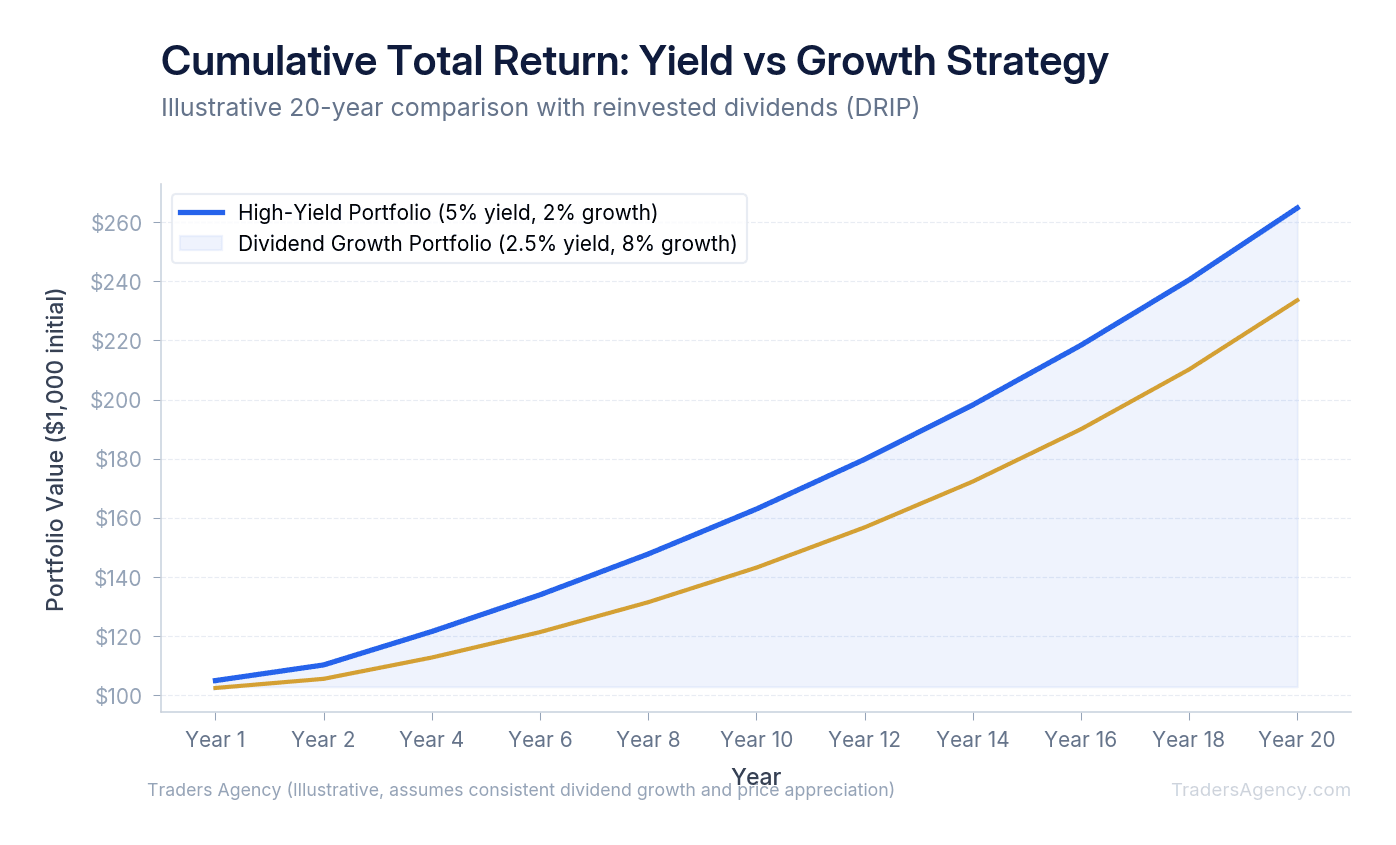
Dividend growth typically produces better long-term income and total return for investors with a time horizon longer than ten years. High dividend yield strategies generate superior immediate cash flow, making them better suited for retirees who need current income to cover immediate living expenses.
Here is a concrete example comparing two hypothetical $10,000 investments over a 20-year period:
| Metric | High-Yield Strategy (7.0% Yield, No Growth) | Dividend Growth Strategy (2.5% Yield, 10% Annual Growth) |
|---|---|---|
| Year 1 Income | $700 | $250 |
| Year 10 Income | $700 | $648 |
| Year 20 Income | $700 | $1,500+ |
| Total Dividends Collected | $14,000 | $14,300+ |
| Capital Appreciation | $0 | $28,000+ |
| Total Portfolio Value (Year 20) | $24,000 | $38,000+ |
The crossover point typically occurs around year 10, when the growing dividend surpasses the static high-yield payout. From that point forward, the dividend growth investor earns more annual income and holds a significantly more valuable portfolio.
Our approach: we prefer to use dividend growth for wealth accumulation during your working years. We transition to high yield for wealth distribution when you actually need to spend the cash.
Want expert trading insights delivered daily?
Join thousands of traders who rely on Traders Agency for market analysis and trade ideas.
Join Traders AgencyHow Do You Evaluate Payout Ratio Sustainability Before You Buy?
You can evaluate payout ratio sustainability by dividing a company's annual dividend per share by its earnings per share. A sustainable payout ratio generally falls between 40% and 60%, indicating the company generates enough profit to cover the dividend while retaining cash for future growth or economic downturns.
You can find these numbers in a company's 10-K annual report or through the SEC's EDGAR filing system. Look for the "Earnings Per Share" (EPS) and "Dividends Per Share" figures.
If a stock pays $4.00 in dividends but only earns $5.00 per share, the payout ratio is 80%. When evaluating dividend yield vs dividend growth, the payout ratio tells you if the dividend is safe. A ratio over 100% means the company is paying out more than it earns. They are funding the dividend with debt, which always ends badly.
Watch Out: A payout ratio above 100% means the company is borrowing money to pay its dividend. This is unsustainable and almost always leads to a dividend cut. Check this number before you buy any income stock.
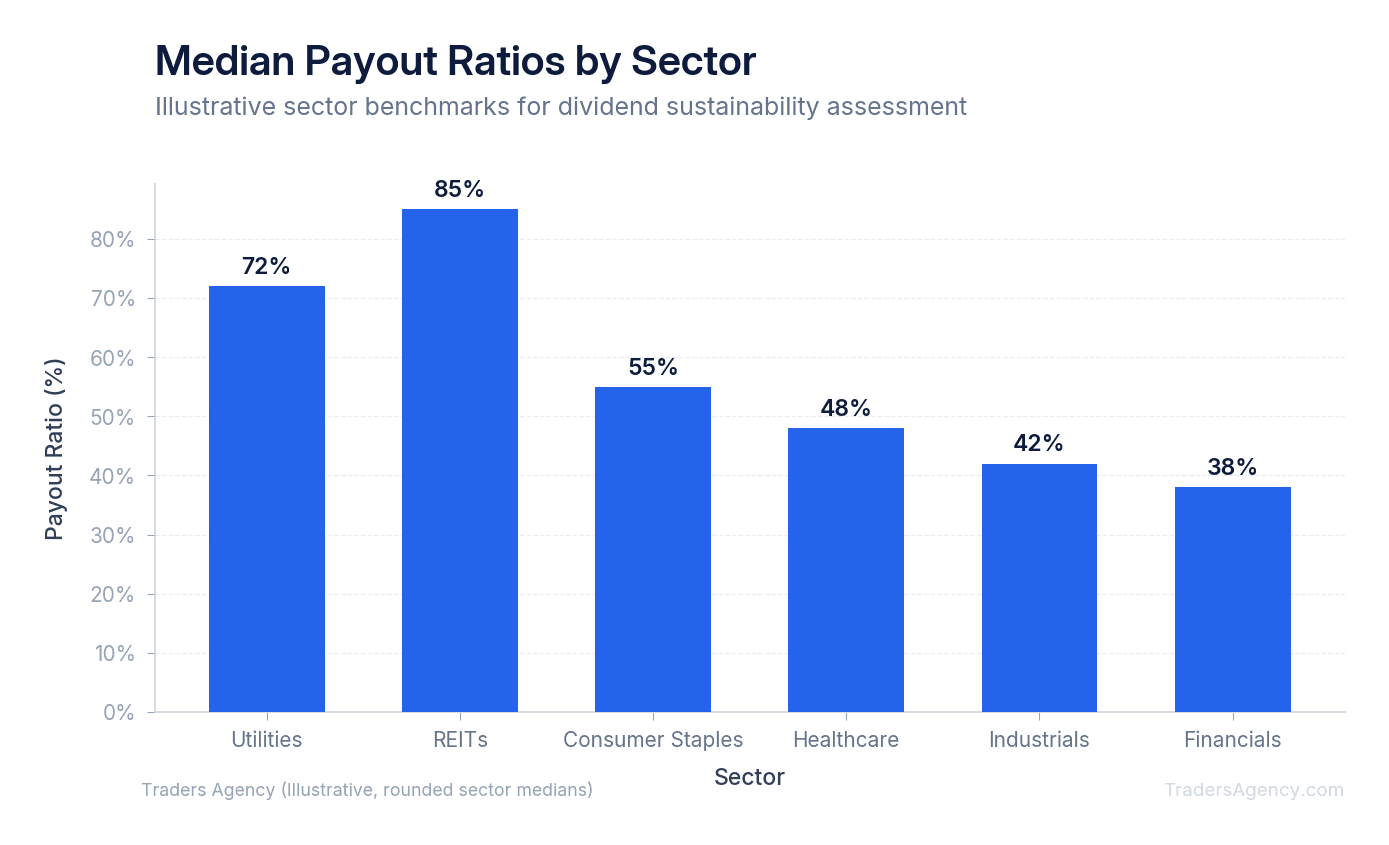
Different sectors have different safety thresholds. Here is what our team looks for:
- Technology and Healthcare: We want to see payout ratios below 50%. These companies need heavy cash reserves for research and development.
- Consumer Staples: Payout ratios up to 65% are generally safe due to highly predictable, recession-resistant revenue streams.
- REITs and Utilities: These entities can safely maintain payout ratios of 80% to 90% because of their specific tax structures and regulated monopolies.
Dividend Aristocrats and Kings: The Dividend Growth Investor's Watchlist
When building an income portfolio, you do not have to guess which companies will raise their payouts. The market tracks them for you through specific classifications.
Dividend Aristocrats are companies in the S&P 500 that have increased their base dividend payout for at least 25 consecutive years. Dividend Kings take this a step further. These rare companies have increased their payouts for 50 consecutive years or more.
We use these lists as our primary screening tool. If a company has survived the dot-com crash, the 2008 financial crisis, and recent inflation spikes while still raising its dividend, it demonstrates excellent capital allocation.
Corporate boards fiercely protect their Dividend Aristocrat status. Dropping off the list often triggers massive sell-offs from institutional index funds. Because of this pressure, these companies prioritize dividend safety above almost all other capital allocation decisions. This provides a layer of security for retail investors.
You can find these lists through standard financial data providers or brokerage screeners. However, do not buy a stock just because it has a title. Always verify the current payout ratio and earnings growth trajectory. A company might raise its dividend by a fraction of a penny just to keep its Aristocrat status, even if its underlying business is deteriorating.
Building a Dividend Ladder That Combines Both Approaches
You do not have to choose strictly between dividend yield vs dividend growth. The most effective income portfolios blend both strategies to balance immediate cash needs with future inflation protection. Our team recommends a tiered approach based on your specific timeline and risk tolerance. We call this building a dividend ladder.
- Establish Your Core Growth Positions: Allocate 60% to 70% of your portfolio to reliable dividend growers. Target companies with a 2.0% to 3.5% starting yield and a history of 7% to 10% annual dividend growth. These positions form the foundation of your portfolio. They protect your purchasing power against inflation over the next decade. Look for strong balance sheets and payout ratios under 60%.
- Layer in High-Yield Income Generators: Allocate 20% to 30% to higher-yielding assets like Real Estate Investment Trusts (REITs), Business Development Companies (BDCs), or established utility companies. Target a 5.0% to 7.0% yield for this section of your ladder. This provides an immediate boost to your portfolio's overall cash flow. You can use this higher immediate income to fund new investments in your growth tier or cover actual living expenses.
- Optimize for Tax Efficiency: Where you hold these stocks matters just as much as what you buy. Taxes can severely drag down your total return if you place assets in the wrong accounts. Qualified dividends are taxed at lower capital gains rates. Most standard dividend growth stocks fall into this category, making them ideal for standard taxable brokerage accounts. Conversely, REITs and certain high-yield instruments often pay non-qualified dividends taxed as ordinary income at your highest marginal tax bracket. We prefer to hold these high-yield assets in tax-deferred accounts like an IRA or 401(k) to shield the income from immediate taxation.
Key Concept: Your dividend ladder should evolve over time. During your accumulation years, weight heavily toward growth. As you approach retirement, gradually shift the balance toward higher-yielding positions that generate the cash flow you need to cover expenses.
When Should You Avoid High-Yield Dividend Stocks?
The biggest mistake we see traders make is sorting a stock screener by highest yield and blindly buying the top results. This is a guaranteed way to lose capital.
A dividend yield moves inversely to the stock price. If a company pays a $2.00 dividend and the stock drops from $40 to $10, the yield artificially spikes from 5% to 20%. This is called a high-yield trap. The market is pricing in an imminent dividend cut and potential bankruptcy. The high yield is an illusion.
Here are our strict rules for avoiding these traps and managing risk:
- Never buy a stock solely because the yield exceeds 8%. Always investigate why the yield is that high. Usually, the market knows something you do not.
- Check the earnings trend over the last three years. If revenue and earnings are declining year over year, the dividend will eventually follow.
- Use strict position sizing. Never allocate more than 5% of your total portfolio to a single high-yield stock. Diversification protects you from individual corporate failures.
- If a company cuts its dividend, sell the stock immediately. A dividend cut breaks the fundamental thesis of an income trade. The stock price usually continues to fall for months afterward as institutional income funds are forced to liquidate their positions.
Stop losses can be tricky with dividend stocks. Often, these stocks experience minor price drops on the ex-dividend date. Instead of tight percentage stop losses, we teach our members to use fundamental stops. A fundamental stop means you exit the trade if the underlying business metrics deteriorate, such as the payout ratio crossing above 85% for a non-utility stock.
Watch Out: A stock yielding 12% or more is almost never a gift. It is a warning sign. The market is telling you that a dividend cut is likely. Always verify the payout ratio, earnings trend, and debt levels before committing capital to any ultra-high-yield position.
Want expert trading insights delivered daily?
Join thousands of traders who rely on Traders Agency for market analysis and trade ideas.
Join Traders AgencyKey Takeaways
- A payout ratio crossing above 85% is a fundamental red flag for non-utility stocks and should trigger an exit review before a dividend cut occurs.
- A stock yielding 12% or more is typically a market warning that a dividend cut is likely, not an income opportunity worth chasing.
- Dividend yield measures current cash return as a percentage of stock price, while dividend growth measures the annual rate at which that payout increases, making them tools for different investor timelines.
- Yield on cost is a key metric for dividend growth investors: a stock with a modest starting yield can deliver a much higher effective yield years later as the payout compounds upward.
- Blending high-yield and dividend growth positions into a dividend ladder allows investors to collect immediate income while building inflation protection over time.
DISCLAIMER: Traders Agency does not offer financial advice. The information provided is for educational purposes only and should not be considered financial advice. Traders Agency is not responsible for any financial losses or consequences resulting from the use of the information provided. Trading carries inherent risks and may not be suitable for all individuals. You are advised to conduct your own research and seek personalized advice before making any investment decisions, recognizing the potential risks and rewards involved.
See more from Traders Agency on Google
Make us a preferred source and our market analysis will appear more prominently in your Google Search, Top Stories, and AI results.
Add to Preferred Sources