
Short interest data is a collection of metrics showing how many shares of a specific stock have been sold short by investors betting the price will fall. Tracking short interest data helps traders identify stocks with high squeeze potential before the explosive price action begins. You've probably seen a stock suddenly shoot up hundreds of percent in a matter of days, leaving everyone wondering what happened. Often, the hidden force behind these massive moves is a short squeeze.
We're going to walk you through exactly what these metrics mean, where to find them, and how to build a screening strategy. By the end of this guide, you'll know how to read the numbers, identify the setups, and manage the risks involved. Our team believes that understanding market mechanics is the best way to protect your capital.
What Is Short Interest and Why Does It Matter?
Bottom Line: Short interest data gives traders a measurable edge by revealing where forced buying pressure could ignite a squeeze, but only if you know how to read the metrics and time your entry around reporting cycles. The FINRA calendar and strict position sizing are not optional steps. They are what separates a calculated trade from a gamble on someone else's squeeze.
Short interest is the total number of open short positions on a stock that have not yet been closed or covered. It matters because a massive amount of short interest creates built-in buying pressure. If the stock price rises unexpectedly, short sellers are forced to buy shares to cover their losing positions.
This forced buying is the engine behind a short squeeze. When we teach our members about short selling, we start with the basic mechanics. A trader borrows shares from a broker, sells them on the open market, and hopes to buy them back later at a lower price. The difference between the selling price and the buying price is their profit.
However, if the price goes up instead, their potential losses are theoretically infinite. Panic sets in when the stock price climbs rapidly. Short sellers must buy shares at any price to stop the bleeding. When thousands of short sellers try to buy shares at the exact same time, the stock price skyrockets. Tracking short interest stocks allows you to see where this potential energy is building up.
Key Concept: Short interest represents the total number of shares sold short that haven't been covered. High short interest creates built-in buying pressure because those shares must eventually be repurchased, regardless of price.
What Are the Key Short Interest Metrics Every Trader Should Know?
To spot these opportunities, you need to understand the math behind the trades. We focus on three primary metrics when evaluating a stock. You'll see these terms on almost every financial platform.
1. Total Short Interest Percentage
This is the raw number of shares sold short compared to the total number of shares available to trade by the public. The available shares are called the public float. If a company has a float of 10 million shares and 2 million shares are currently shorted, the short interest is 20%.
We generally look for stocks with short interest above 15% to indicate a crowded trade. When a trade is crowded, it means too many people are betting on the exact same outcome. If they are wrong, the reversal will be violent.
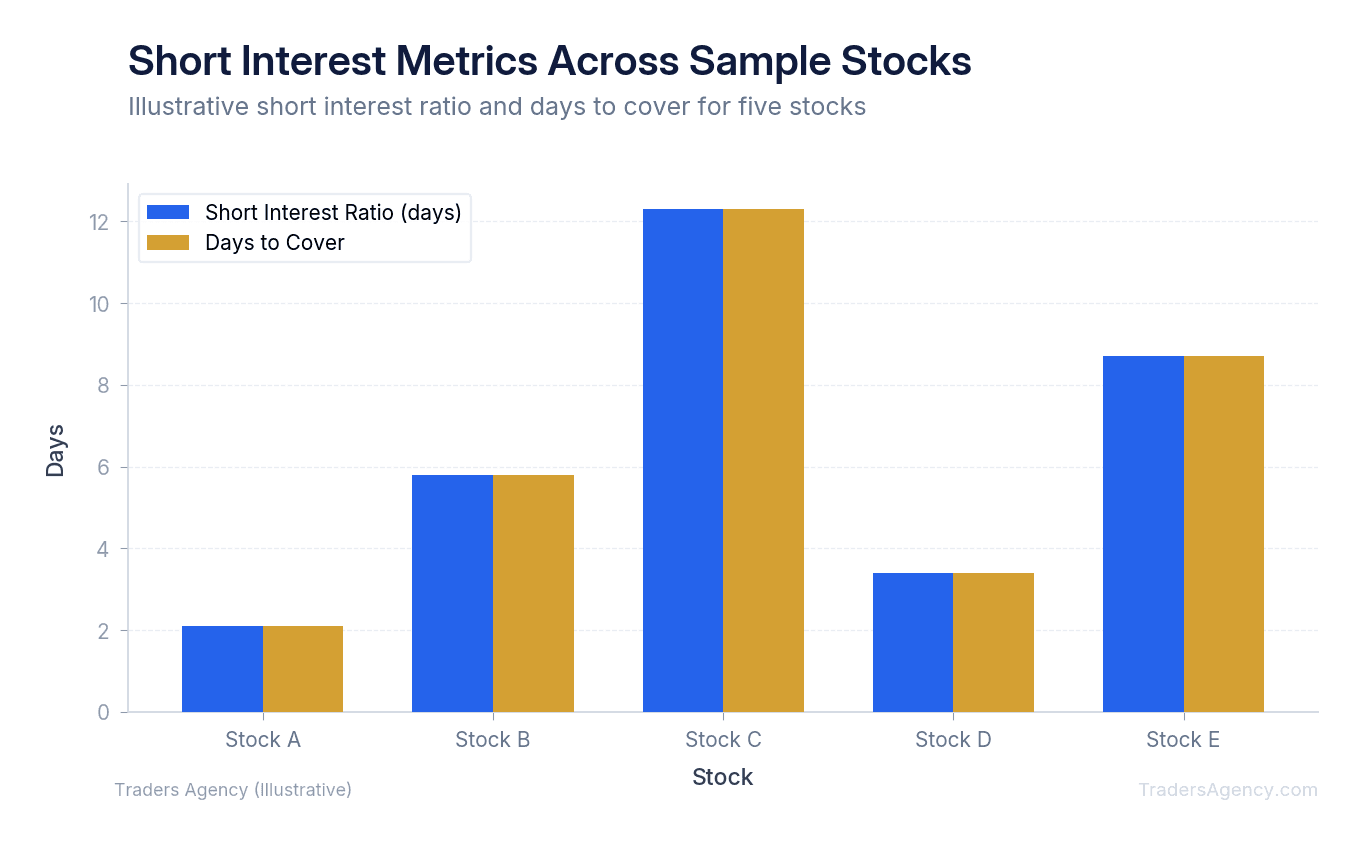
2. Days to Cover (Short Interest Ratio)
The short interest ratio, also known as days to cover, tells you how long it would take all short sellers to buy back their shares based on average daily trading volume. You calculate it by dividing the total short shares by the average daily volume.
If a stock has 5 million shares shorted and trades 1 million shares per day, the days to cover is five. A higher number means short sellers will have a harder time escaping if the price spikes. They are trapped in a narrow exit door.
3. Cost to Borrow (Borrow Fee Rate)
When short sellers borrow shares, they pay an interest rate to the broker. The cost to borrow stock fluctuates based on supply and demand. A normal fee might be 1% or 2% annually.
When shares become hard to borrow, this fee can spike to 50%, 100%, or even higher. High fees put immense financial pressure on short sellers to close their positions quickly. If a trader is paying a 100% annual fee, they are losing money every single day the stock simply trades sideways.
| Metric | What It Measures | Squeeze Signal Threshold |
|---|---|---|
| Short Interest % | Shares shorted vs. public float | > 15% |
| Days to Cover | Time for shorts to exit at avg. volume | > 5 days |
| Cost to Borrow | Annual fee to maintain short position | > 20% |
Where Can You Find Free Short Interest Data?
You can find free short interest data directly through regulatory and exchange websites like the Financial Industry Regulatory Authority (FINRA) and Nasdaq. These organizations require brokerages to report short positions twice a month, making them reliable but slightly delayed sources for retail traders.
The SEC and FINRA short interest reports are the gold standard for accuracy. Every brokerage must submit their exact numbers on specific settlement dates. However, they come with a major drawback for active traders. The data is only collected mid-month and end-of-month.
After collection, it takes several days for the exchanges to process and publish the numbers. By the time you read a free report on the Nasdaq Trader website, the information might be two weeks old. A lot can change in two weeks in the stock market. Short sellers might have already covered their positions during a recent price spike.
How Do Real-Time Platforms Differ From FINRA Reports?
Real-time platforms like Ortex and S3 Partners differ from FINRA reports by providing daily estimates of short interest data rather than waiting for bi-monthly regulatory filings. They use proprietary algorithms and live lending data from prime brokers to estimate current short positions and borrow fees.
For active traders, speed is everything. We prefer to use real-time data when tracking fast-moving setups. While FINRA gives you the exact historical numbers, paid platforms give you the current estimated reality. They track the live borrow fees and alert you when shares are being returned or newly borrowed.
If you see the estimated short interest spike from 15% to 30% in three days on a platform like Ortex, you have a massive informational advantage. You are seeing the pressure build before the rest of the market reads the delayed exchange reports. This speed allows you to build a watchlist of high short interest stocks before the actual squeeze begins.
Key Concept: Free FINRA data is accurate but delayed by up to two weeks. Real-time platforms provide daily estimates that give active traders a significant timing advantage when building squeeze watchlists.
Want expert trading insights delivered daily?
Join thousands of traders who rely on Traders Agency for market analysis and trade ideas.
Join Traders AgencyHow Do You Screen for Short Squeeze Candidates?
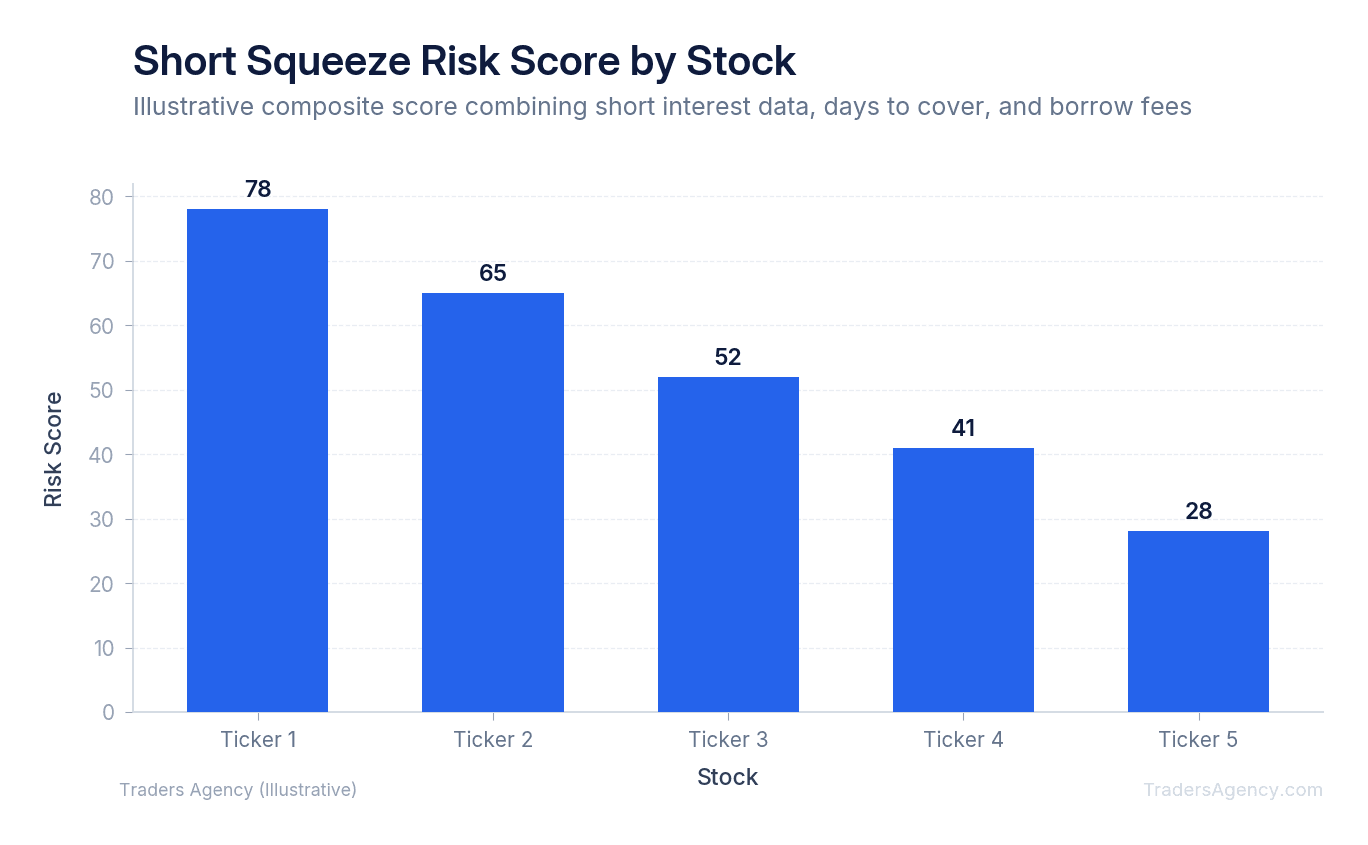
You screen for short squeeze candidates by combining high short interest, high days to cover, and a high borrow fee rate into a single scan. You want to identify stocks where short sellers are trapped, paying high fees, and would struggle to buy back shares quickly.
Our team recommends building a specific short squeeze screener to filter out the noise. There are thousands of stocks on the market. You don't want to guess which ones might squeeze. You want the data to tell you exactly where the pressure is building.
Step-by-Step Screener Setup
Here are the exact criteria we teach our members to use when hunting for these setups:
- Set Short Interest filter: Greater than 20% of the public float.
- Set Days to Cover filter: Greater than 5 days.
- Set Cost to Borrow filter: Greater than 20% annual fee.
- Set Average Daily Volume filter: Greater than 1 million shares.
We require at least 1 million shares of daily volume to ensure liquidity. If a stock doesn't trade enough volume, you might get trapped in the position yourself. High volume ensures you can enter and exit your trades cleanly without suffering massive slippage.
A Concrete Trade Example
Imagine a fictional company called TechCorp (Ticker: TCORP). Your screener flags TCORP with 35% short interest, 8 days to cover, and a 45% borrow fee rate. The setup is clear. Over a third of the available shares are sold short. It would take short sellers eight full days of average volume to buy them back. They are paying a massive 45% interest rate just to hold the trade.
The execution requires a trigger. We do not buy simply because the numbers are high. We wait for a technical breakout on the chart.
| Parameter | Value |
|---|---|
| Stock | TCORP trading below $20.00 resistance |
| Short Interest | 35% of float |
| Days to Cover | 8 days |
| Borrow Fee | 45% annually |
| Entry (Buy Stop) | $20.50 |
| Stop Loss | $19.00 |
| Scenario | Outcome | Result |
|---|---|---|
| Best Case | Breakout triggers cascade of covering, price runs to $30.00 | Significant profit |
| Worst Case | False breakout, stock reverses immediately | Small, controlled loss at $19.00 stop |
How Do You Combine Technical Analysis With Short Interest Data?
You combine technical analysis with short interest data by using the data to build a watchlist and using chart patterns to time your exact entry. High short interest tells you which stocks have explosive potential, while technical breakouts tell you exactly when the buying pressure is starting.
Data alone is never enough to justify a trade. A stock can have 40% short interest and still slowly bleed downward for months. The short sellers are winning in that scenario. You only want to buy when the short sellers are starting to lose.
We look for consolidation patterns near major resistance levels. A long period of sideways trading builds a clear line in the sand. When the stock finally breaks above that line on high volume, it signals a shift in momentum. That volume spike is often the first wave of short sellers throwing in the towel and buying back their shares.
What Are the Risks of Trading Based on Short Interest Data?
Trading high short interest stocks is inherently dangerous. These stocks are heavily shorted for a reason. Often, the underlying company has terrible fundamentals, declining revenue, or pending legal trouble. Institutional investors do not short a stock aggressively unless they believe the company is in serious trouble.
Just because a stock has high short interest does not mean a squeeze is guaranteed. Sometimes, the short sellers are right, and the stock goes to zero. You are trading a market mechanic, not investing in a quality business. You must treat these trades as short-term speculative setups.
Watch Out: High short interest stocks are heavily shorted for a reason. The underlying company often has serious fundamental problems. Never confuse a short squeeze trade with a long-term investment. Use tight stops and small position sizes.
Managing Position Sizing and Reporting Cycles
Risk management is your only defense in these volatile situations. Because these stocks can gap down 20% overnight on bad news, we prefer to use much smaller position sizes. If you normally risk 2% of your total account on a standard trade, consider risking only 0.5% on a short squeeze play.
You must also pay close attention to the reporting calendar. Volatility often spikes right around the release dates for official exchange reports.
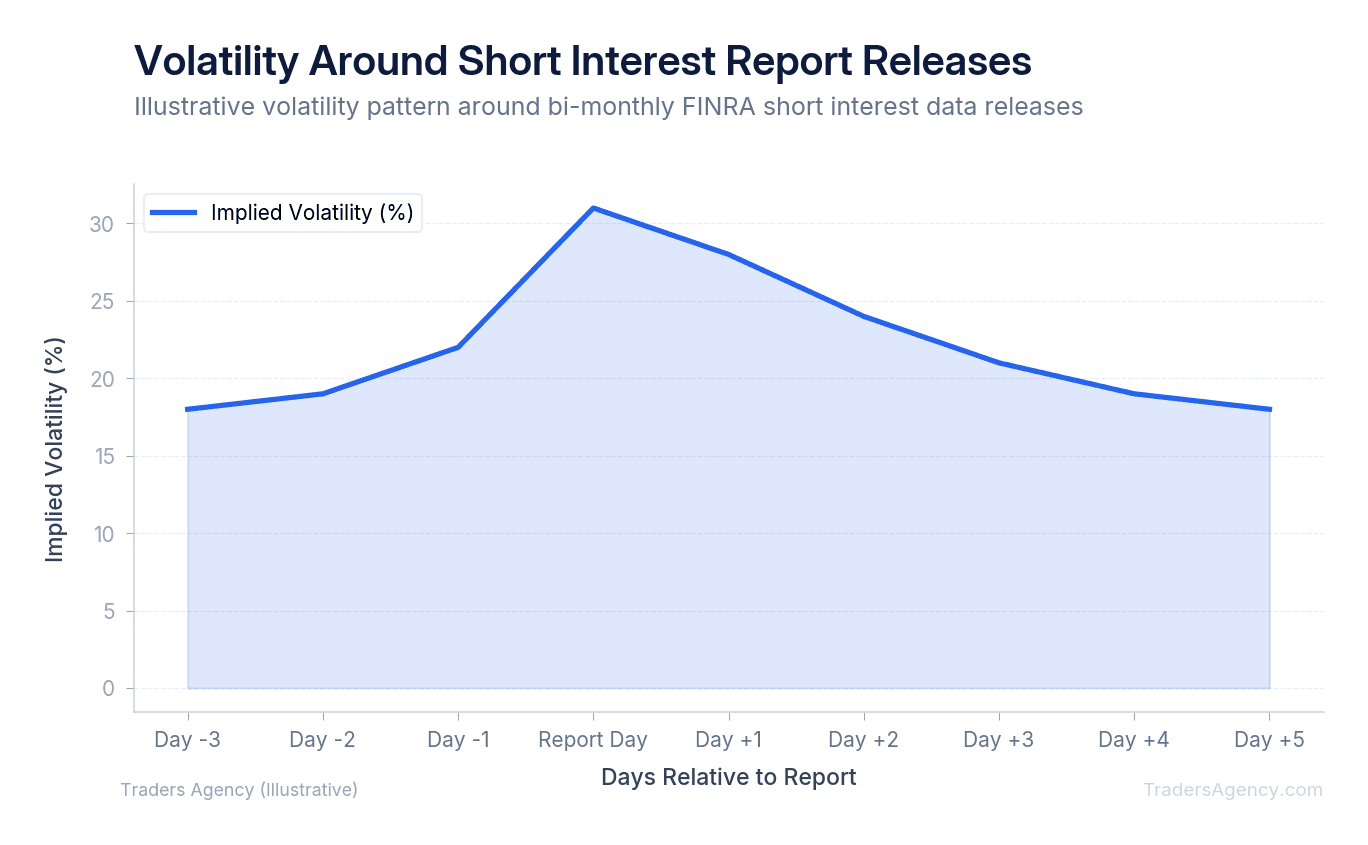
If the new report shows that short sellers have already covered their positions quietly, the squeeze thesis is dead. The stock price will likely collapse as retail traders rush for the exits. Always know when the next data drop is scheduled before entering a trade.
Use hard stop losses on every single trade. Never hold a losing position in a highly shorted stock hoping it will turn around. The mechanics of the market favor the prepared, disciplined trader who uses data to confirm their entries and exits. Keep your losses small, wait for the right setup, and let the data guide your decisions.
Risk Warning: Always check the FINRA reporting calendar before entering a short squeeze trade. If the next report reveals that shorts have already covered, the setup is invalidated and the stock could drop sharply. Reduce position size to 0.5% risk on these speculative plays.
The Traders Agency education team publishes new strategy guides and market analysis every week.
Want expert trading insights delivered daily?
Join thousands of traders who rely on Traders Agency for market analysis and trade ideas.
Join Traders AgencyKey Takeaways
- Short interest represents the total number of open short positions not yet closed or covered, and a high concentration of these positions creates built-in buying pressure that can trigger explosive price moves.
- When a shorted stock rises unexpectedly, short sellers are forced to buy shares to cover losing positions. This forced buying is the mechanical engine behind a short squeeze.
- Always check the FINRA reporting calendar before entering a short squeeze trade. If the next report shows shorts have already covered, the setup is invalidated and the stock could drop sharply.
- Position sizing matters on speculative short squeeze plays. The article recommends limiting risk to 0.5% of capital per trade to account for the unpredictable nature of these setups.
- Short interest data is most useful as a confirmation tool, not a standalone signal. Entries and exits should be guided by the numbers, not by momentum or hype alone.
DISCLAIMER: Traders Agency does not offer financial advice. The information provided is for educational purposes only and should not be considered financial advice. Traders Agency is not responsible for any financial losses or consequences resulting from the use of the information provided. Trading carries inherent risks and may not be suitable for all individuals. You are advised to conduct your own research and seek personalized advice before making any investment decisions, recognizing the potential risks and rewards involved.
See more from Traders Agency on Google
Make us a preferred source and our market analysis will appear more prominently in your Google Search, Top Stories, and AI results.
Add to Preferred Sources