
You have probably seen this happen before. A company reports strong revenue growth and expanding profit margins, but its stock price suddenly collapses. When you look closer, the business simply ran out of cash to pay its short-term bills. This is why we teach every member to read the balance sheet before trusting the income statement. In this guide, we will walk you through how to calculate working capital, interpret liquidity ratios, spot early warning signs of financial distress, and use this information to avoid value traps in your portfolio.
What Is Working Capital Liquidity and Why Does It Matter?
Bottom Line: Working capital liquidity is the difference between a company that survives a rough quarter and one that collapses despite strong revenue. Readers who build balance sheet analysis into their process are better positioned to avoid value traps where the income statement looks healthy but the cash position tells a different story.
Working capital liquidity measures whether a company has enough easily accessible cash and short-term assets to pay its upcoming bills. It matters because profitable companies can still go bankrupt if they lack the cash to pay suppliers, employees, or interest expenses during a temporary business slowdown.
We look at this as the financial cushion of a business. Think of it like your personal checking account. You might own a million-dollar house, but if you only have fifty dollars in cash and a mortgage payment due tomorrow, you have a liquidity problem.
Key Concept: Revenue shows you growth, but liquidity shows you survival. A company with poor liquidity is always one bad quarter away from disaster. They will eventually have to issue new shares (diluting your stock value) or take on expensive debt just to keep the lights on.
The SEC's investor education resources consistently emphasize the importance of reading the balance sheet, and for good reason. It is the single best tool for understanding whether a company can weather a rough patch.
How Do You Calculate Working Capital?
To evaluate a company's financial cushion, you need to know exactly what they own and what they owe in the short term. The standard working capital formula is simple: subtract current liabilities from current assets.
Current assets include cash, inventory, and accounts receivable (money owed by customers). These are assets the company expects to convert to cash within 12 months.
Current liabilities include accounts payable, short-term debt, and upcoming tax obligations. These are bills the company must pay within the next 12 months.
If a company has $500 million in current assets and $300 million in current liabilities, its net working capital is $200 million.
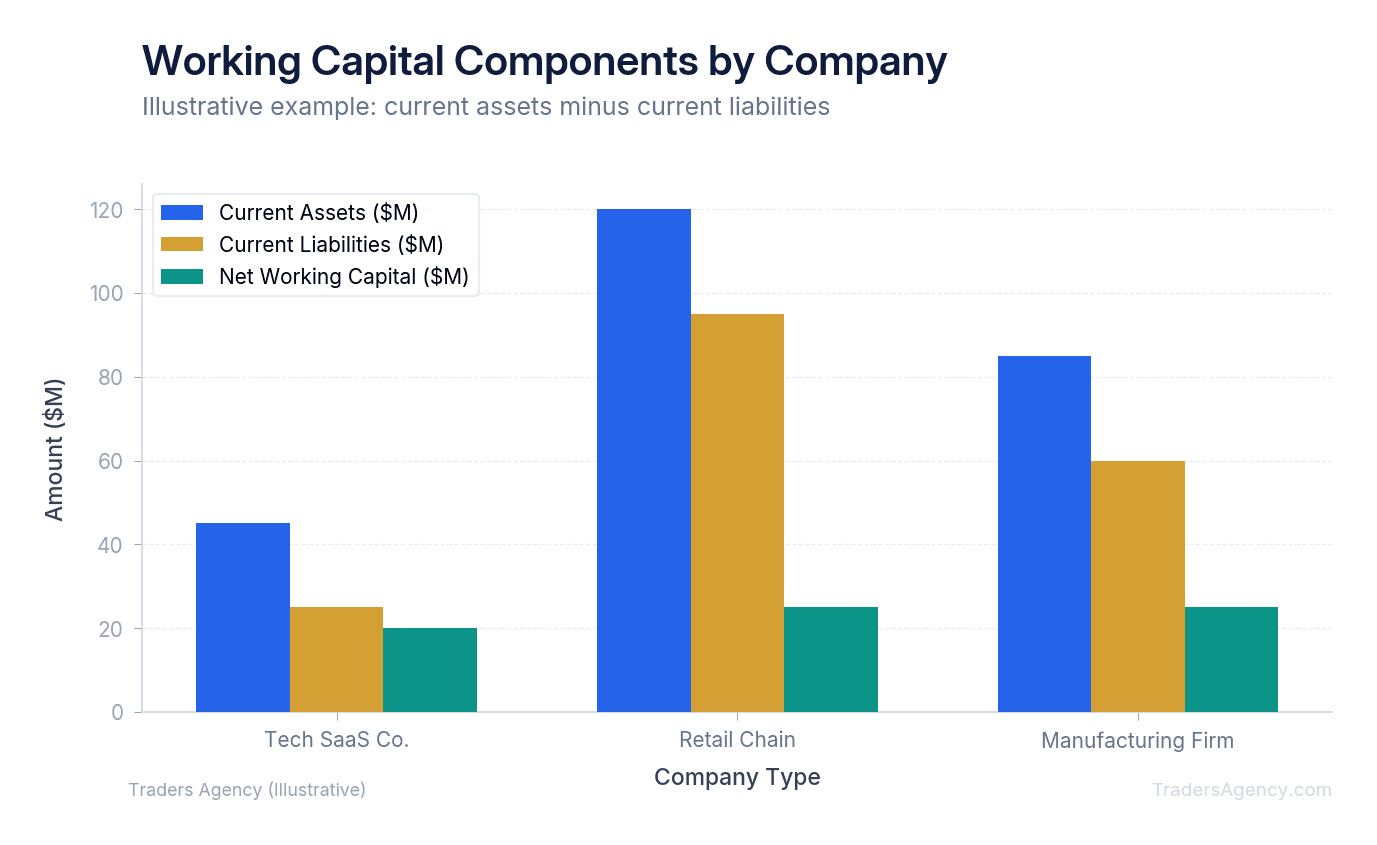
Sometimes you will hear analysts refer to the gross working capital formula. This simply looks at the total current assets without subtracting the liabilities. We prefer to focus on the net figure because it gives a much clearer picture of actual financial health. Knowing a company has $500 million in assets means nothing if they owe $600 million next month.
Current Ratio vs. Quick Ratio: Which Working Capital Ratio Formula Is Best?
The current ratio divides total current assets by current liabilities to provide a broad view of liquidity. The quick ratio is a stricter metric that excludes inventory from current assets. It focuses only on the most liquid assets like cash and receivables to measure immediate debt-paying ability.
We recommend using both metrics depending on the industry you are analyzing. The working capital ratio formula (another name for the current ratio) is great for a high-level overview. A current ratio of 1.5 means the company has $1.50 in assets for every $1.00 in short-term debt.
However, inventory is not always easy to sell quickly. If a clothing retailer has a warehouse full of out-of-season coats, they cannot easily use that inventory to pay off a bank loan.
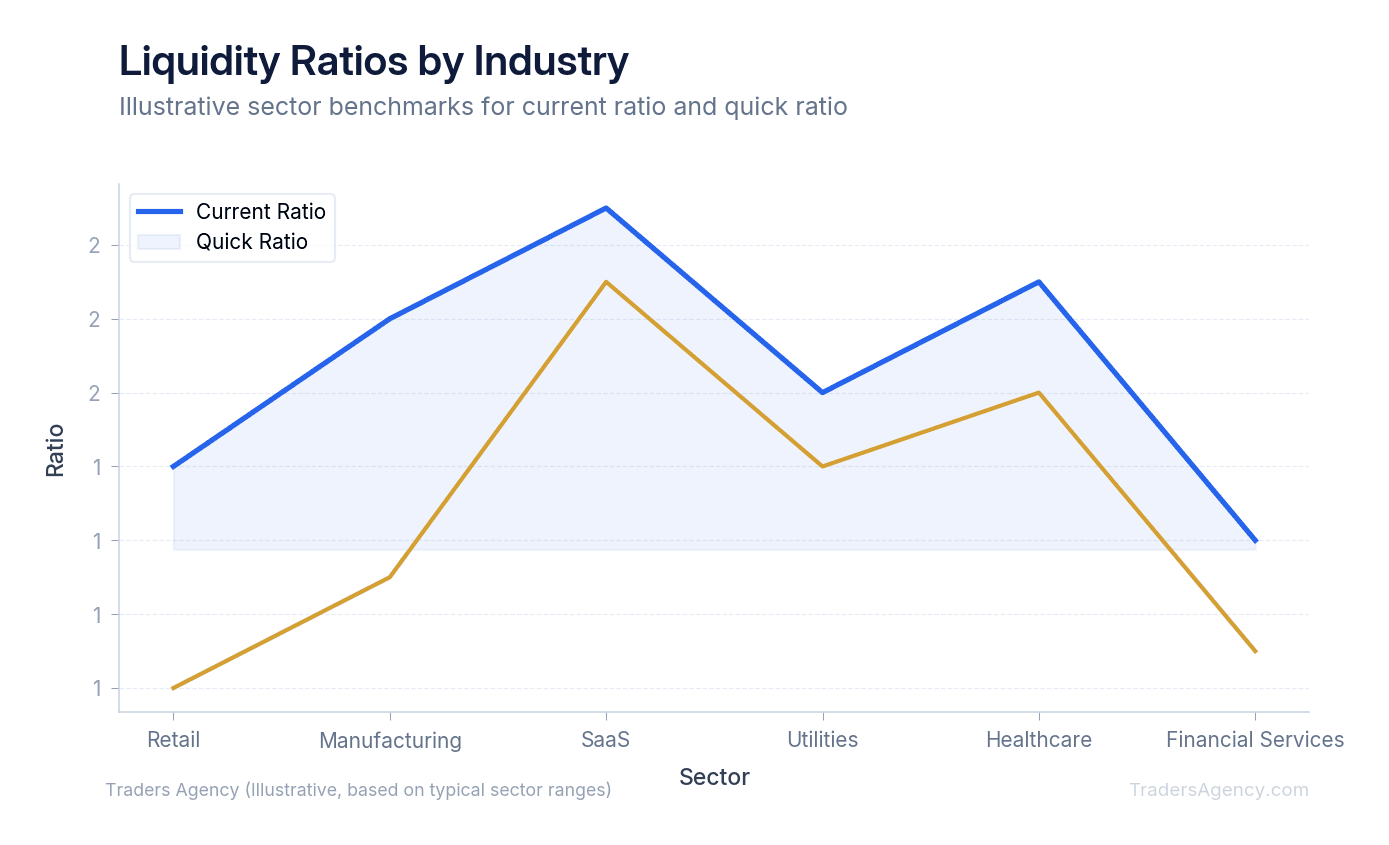
This is why the quick ratio is often our preferred metric for retail and manufacturing stocks. By stripping out inventory, you see the hard truth about a company's immediate cash position. Different sectors have completely different baselines for these ratios. A software company might have a current ratio of 2.5, while a grocery store might operate perfectly fine at 0.8 because their inventory turns over so rapidly.
| Sector | Typical Current Ratio | Typical Quick Ratio | Our Notes |
|---|---|---|---|
| SaaS / Software | 2.0 – 3.0 | 1.8 – 2.8 | Minimal inventory; ratios tend to be close together |
| Retail | 1.0 – 1.5 | 0.3 – 0.7 | Heavy inventory; quick ratio often much lower |
| Manufacturing | 1.2 – 2.0 | 0.6 – 1.2 | Raw materials and WIP inflate current assets |
| Grocery / Food | 0.7 – 1.0 | 0.3 – 0.5 | Rapid inventory turnover supports lower ratios |
What Are the Four Types of Working Capital?
Understanding these four categories helps you contextualize a company's balance sheet and determine whether a liquidity reading is normal or a cause for concern.
- Gross working capital: The total sum of all current assets. This gives you the raw size of a company's short-term asset base.
- Net working capital: The difference between current assets and current liabilities. This is the number we focus on most because it shows what is actually left over after obligations.
- Permanent working capital: The absolute minimum level of current assets a business needs to keep its doors open year-round, regardless of seasonal fluctuations.
- Temporary working capital: The extra capital required during peak seasons, like a retailer stocking up for holiday shopping.
Key Concept: When we review SEC EDGAR filings, we always look for seasonal spikes in temporary capital. If a retailer fails to sell their holiday inventory, that temporary capital becomes trapped. This severely damages their overall liquidity heading into the new year.
Is a Higher or Lower NWC Better?
A higher net working capital is generally better because it indicates a company has ample short-term assets to cover its debts. However, an excessively high number might mean the company is hoarding cash or holding too much unsold inventory instead of investing in future growth.
We teach our members to look for balance. A negative NWC means current liabilities exceed current assets, which is a massive red flag for most traditional businesses. It signals serious short-term financial stress.
But context matters. Giant companies like Amazon or Walmart often operate with negative NWC. They collect cash from customers quickly but negotiate extended payment terms with their suppliers. This is a sign of supplier leverage, not financial weakness.
For 99% of the stocks you will trade, you want to see a positive, stable NWC. If the number is too high, check the inventory line item. A bloated inventory often artificially inflates the NWC, hiding underlying sales problems.
Want expert trading insights delivered daily?
Join thousands of traders who rely on Traders Agency for market analysis and trade ideas.
Join Traders AgencyHow Do You Use the Working Capital Days Formula?
The working capital days formula calculates how many days it takes a company to convert its investments in inventory and resources into cash flows from sales. This metric is the foundation of the cash conversion cycle (CCC), which measures the exact speed of a company's cash flow.
The formula requires three specific inputs from the financial statements:
- Days Inventory Outstanding (DIO): How long it takes to sell inventory.
- Days Sales Outstanding (DSO): How long it takes to collect cash from customers.
- Days Payable Outstanding (DPO): How long the company takes to pay its suppliers.
The Cash Conversion Cycle formula is: DIO + DSO - DPO.
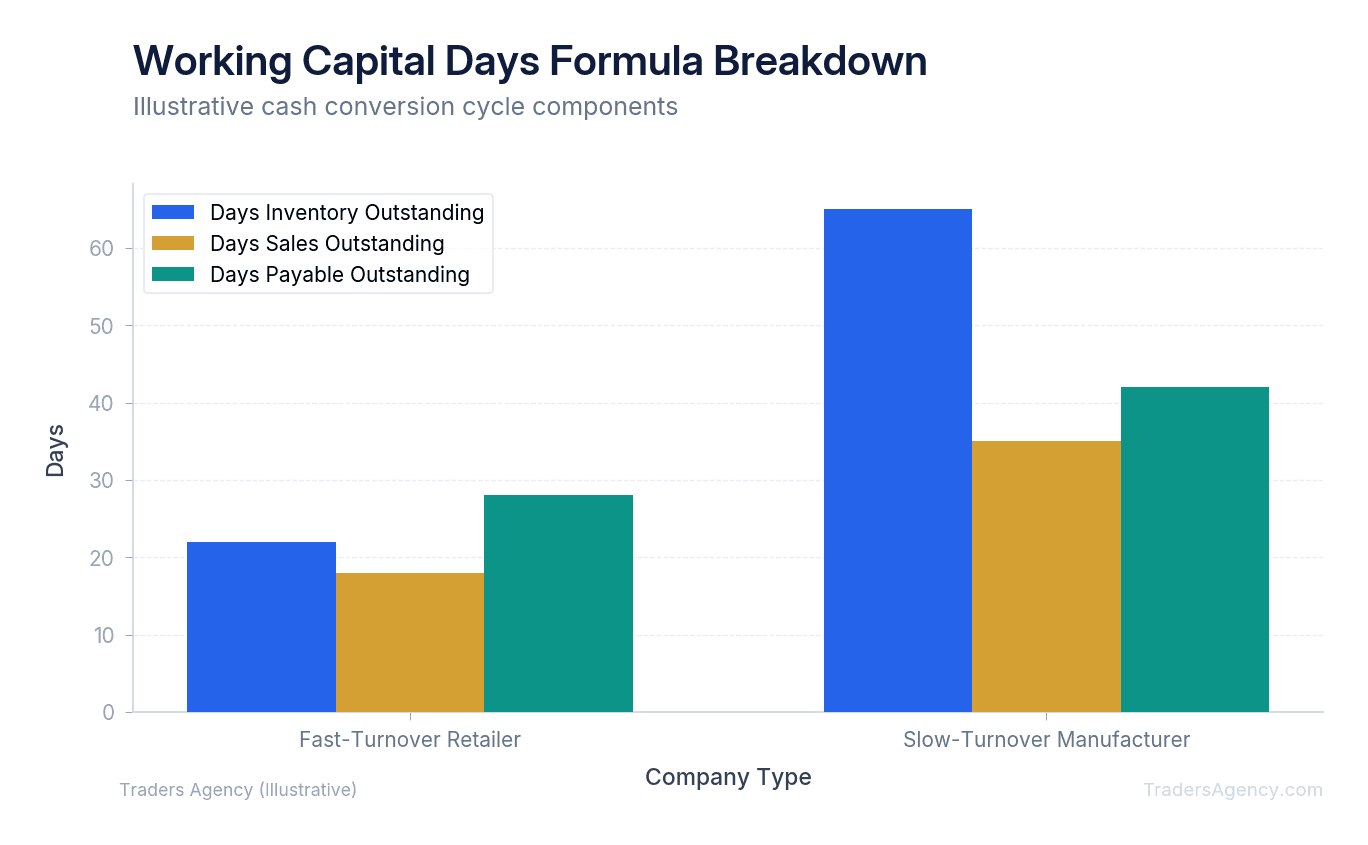
A lower CCC is generally better. If a company can sell its products in 30 days, collect cash in 15 days, but wait 60 days to pay suppliers, it has a negative CCC of -15 days. This means the company's suppliers are essentially funding its daily operations. If the CCC is 120 days, the company's cash is tied up for four months before they see a return.
Working Capital Liquidity Example: A Step-by-Step Walkthrough
Here is a concrete working capital liquidity example showing how we apply this analysis in real trading scenarios. We will compare two hypothetical tech hardware companies: TechAlpha and TechBeta. Both generated $100 million in revenue last year. If you only looked at the income statement, you might think they are equally strong investments.
- Identify the Current Assets
We pull up the balance sheets for both companies.
TechAlpha has $40M in cash, $10M in accounts receivable, and $10M in inventory. Total current assets: $60 million.
TechBeta has $10M in cash, $20M in accounts receivable, and $30M in inventory. Total current assets: $60 million.
Both have the exact same gross working capital. - Identify the Current Liabilities
Next, we check their short-term obligations.
TechAlpha has $20M in accounts payable and $10M in short-term debt. Total current liabilities: $30 million.
TechBeta has $40M in accounts payable and $10M in short-term debt. Total current liabilities: $50 million. - Calculate the Ratios
Now we run the numbers for both companies. - Interpret the Results
TechAlpha is in a position of strength. They have plenty of cash to cover their debts even if they sell zero inventory next quarter. TechBeta is in severe danger. Their quick ratio of 0.6 means they only have 60 cents in liquid assets for every dollar of short-term debt. If their inventory becomes obsolete, they will likely have to issue new shares or take on expensive debt to survive. We would avoid trading TechBeta from the long side.
| Metric | TechAlpha | TechBeta |
|---|---|---|
| Cash | $40M | $10M |
| Accounts Receivable | $10M | $20M |
| Inventory | $10M | $30M |
| Total Current Assets | $60M | $60M |
| Total Current Liabilities | $30M | $50M |
| Net Working Capital | $30M | $10M |
| Current Ratio | 2.0 | 1.2 |
| Quick Ratio | 1.67 | 0.6 |
| Our Assessment | Strong liquidity position | High risk, avoid long positions |
What Are the Early Warning Signs of Deteriorating Liquidity?
One of the most profitable ways to use working capital liquidity analysis is to spot trouble before Wall Street catches on. Companies rarely go bankrupt overnight. The balance sheet almost always shows the deterioration months in advance.
We look for a specific pattern: rising inventory and rising accounts receivable combined with shrinking cash reserves.
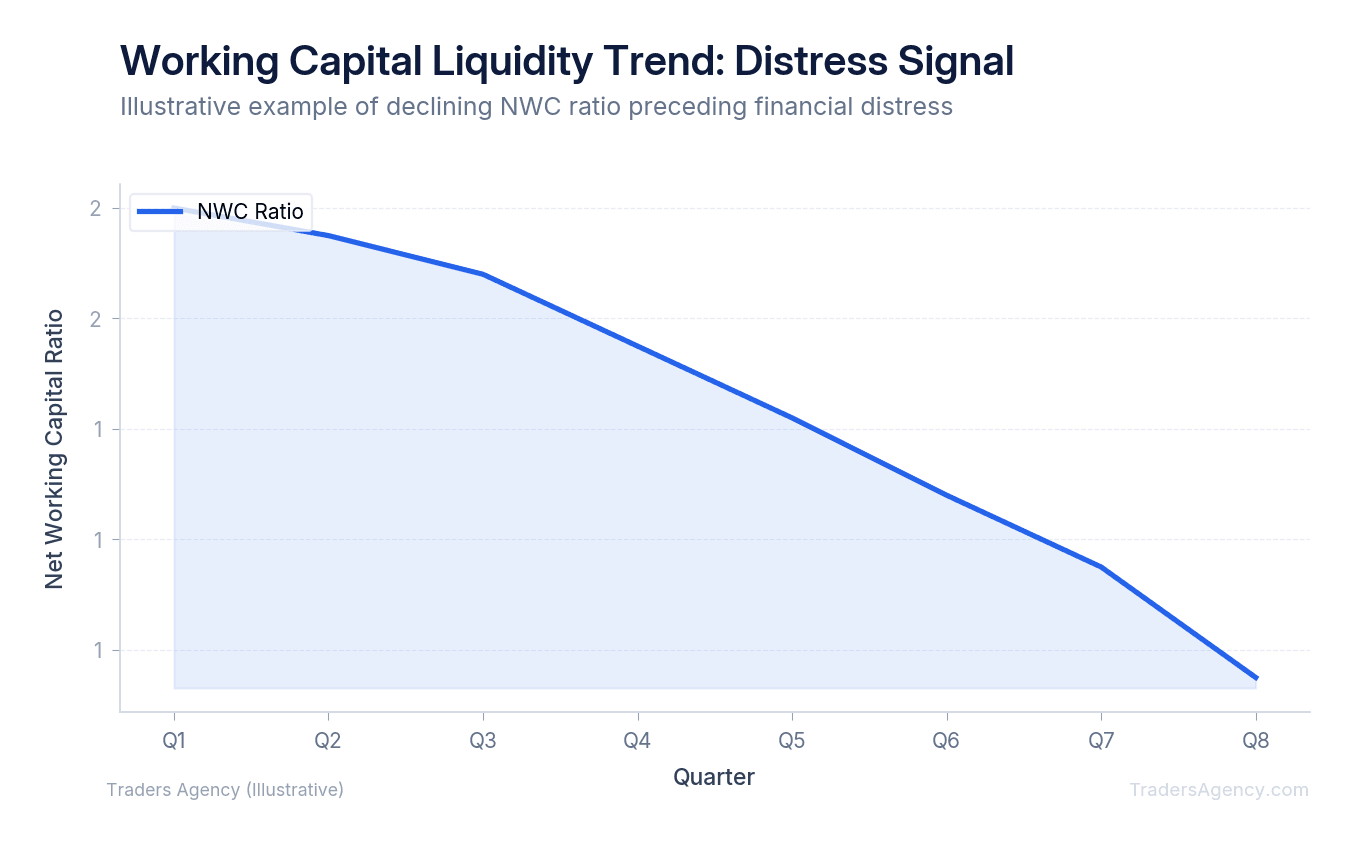
When a company cannot sell its products, inventory piles up. When they struggle to collect payments, accounts receivable swell. This traps their cash and forces them to rely on debt.
Watch Out: If you see the current ratio staying flat but the quick ratio dropping sharply over three consecutive quarters, you have found a massive red flag. The company is masking its cash burn with unsold inventory. This is one of the most common patterns we see before an earnings miss or sudden debt issuance.
We use this specific setup to identify short-selling opportunities or to know when to exit a long position. If a stock is trading near 52-week highs but its quick ratio has dropped below 1.0, the risk of an earnings miss or a sudden dilutive share offering is extremely high.
Practical Application and Risk Management
You should incorporate these liquidity checks into your regular stock screening process. Our team recommends setting a hard rule: never buy a long-term investment without checking the balance sheet first. You can find this data easily on Yahoo Finance, Finviz, or directly in a company's 10-Q filings.
However, there are times when you should not rely strictly on these metrics. Financial companies like banks and insurance firms have completely different balance sheet structures. Traditional working capital formulas do not apply to them.
Always compare a company's liquidity metrics to its direct competitors. A current ratio of 1.5 might be terrible for a software company but excellent for an airline. You have to know the standard for the sector you are trading.
For risk management, here is the approach we use with our own portfolios:
- Limit your portfolio exposure to companies with low liquidity.
- If you choose to trade a stock with a quick ratio below 1.0, keep your position size small.
- Use strict stop losses. A sudden macroeconomic shock will always hit cash-poor companies the hardest.
- Review balance sheet data quarterly, not just at the time of your initial entry.
Risk Warning: Working capital metrics are backward-looking. They reflect the company's financial position at the time of filing, not in real time. Always combine balance sheet analysis with price action and broader market conditions before making a trade decision.
The Traders Agency education team publishes new strategy guides and market analysis every week. If this kind of fundamental analysis is something you want to build into your trading process, we have an entire library of guides waiting for you.
Want expert trading insights delivered daily?
Join thousands of traders who rely on Traders Agency for market analysis and trade ideas.
Join Traders AgencyKey Takeaways
- Profitable companies can still go bankrupt if short-term cash runs out, making working capital liquidity a survival metric, not just a performance metric.
- Working capital is calculated from the balance sheet, not the income statement. Strong revenue growth can mask a deteriorating cash position.
- Poor liquidity often forces companies to issue new shares or take on expensive debt, both of which directly reduce value for existing shareholders.
- Working capital metrics are backward-looking and reflect the company's position at the time of filing, so they should be combined with price action and broader market conditions before acting.
- The personal finance analogy holds: owning a million-dollar asset means nothing if you cannot cover tomorrow's payment. The same logic applies to evaluating a company's balance sheet.
DISCLAIMER: Traders Agency does not offer financial advice. The information provided is for educational purposes only and should not be considered financial advice. Traders Agency is not responsible for any financial losses or consequences resulting from the use of the information provided. Trading carries inherent risks and may not be suitable for all individuals. You are advised to conduct your own research and seek personalized advice before making any investment decisions, recognizing the potential risks and rewards involved.
See more from Traders Agency on Google
Make us a preferred source and our market analysis will appear more prominently in your Google Search, Top Stories, and AI results.
Add to Preferred Sources