
You've probably seen a stock suddenly drop 10% on seemingly normal news and wondered what happened behind the scenes. Often, the answer lies in the buying and selling habits of massive financial institutions. We're going to walk you through exactly how to track this "smart money" and use it to improve your own trading strategy. Our team teaches traders that you don't need millions of dollars to trade like the professionals. You just need to understand where the professionals are putting their money.
By the end of this guide, you'll know how to find institutional ownership data, interpret what it means for a company's future, and apply it to your personal portfolio. We'll show you the exact tools our team uses to monitor these massive market players.
What Are Institutional Ownership Stocks and Why Do They Matter?
Bottom Line: Institutional ownership data is publicly available through 13F filings and free tools, giving retail traders a practical way to see where large capital is concentrated. Stocks with unusually high or over-100% institutional ownership carry elevated volatility risk, while companies in the middle range may offer more stable opportunities. Understanding this data does not require a large account, only the knowledge of where to look and how to interpret what the numbers actually mean.
Institutional ownership stocks are simply companies backed heavily by large financial entities rather than individual retail investors. Think mutual funds, pension funds, hedge funds, and insurance companies. This matters because institutions control billions of dollars, meaning their buying and selling activity directly dictates market trends. Tracking these moves helps traders align their strategies with major market forces.
To understand this concept, you have to look at the basic math of the stock market. Every publicly traded company has a specific number of shares outstanding, which is the total number of shares available to buy and sell. The institutional ownership percentage is simply the portion of those total shares owned by large financial organizations. If a company has 10 million shares outstanding and mutual funds own 6 million of them, the institutional ownership sits at 60%.
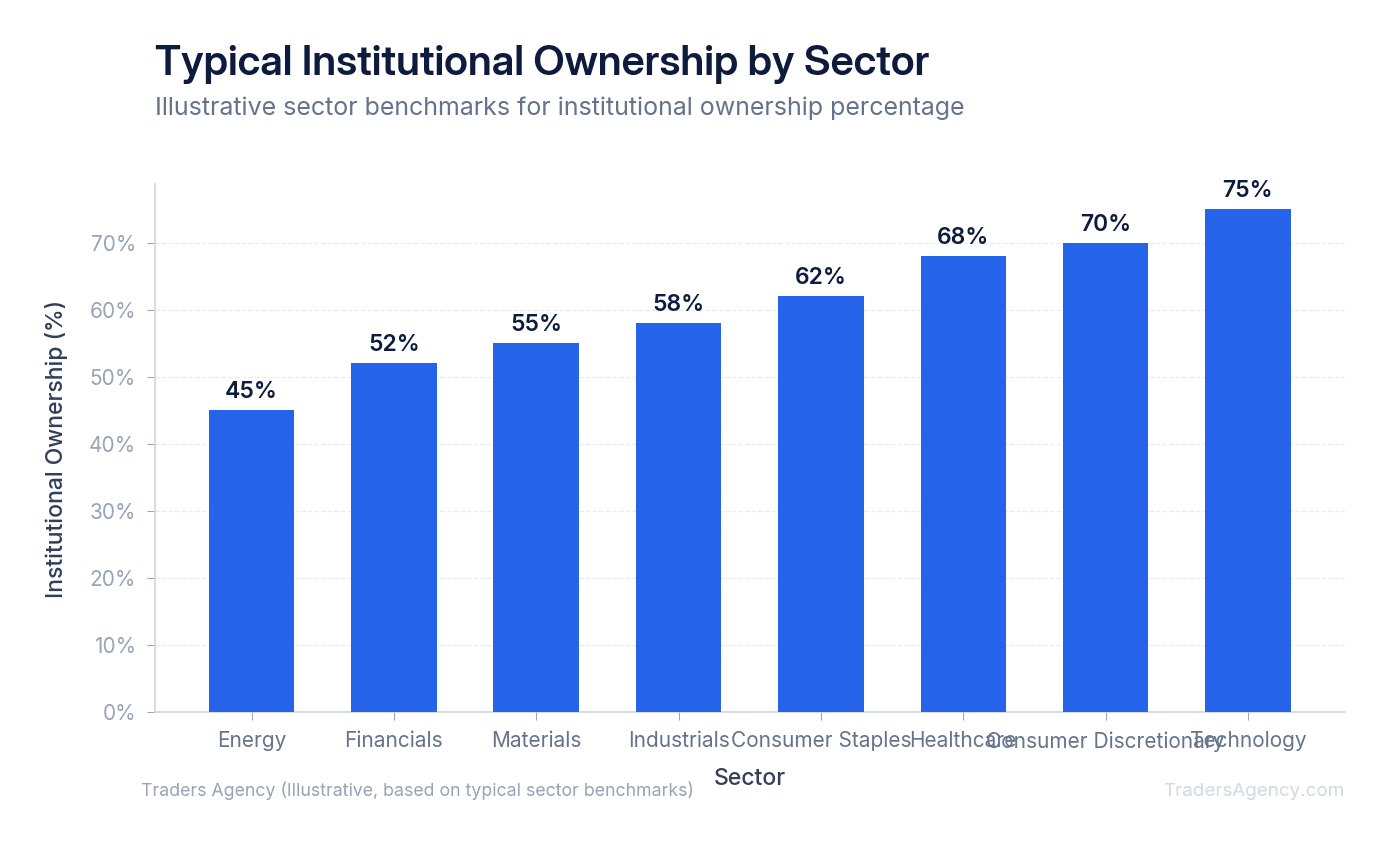
These large organizations are required by law to report their holdings to the public. The Securities and Exchange Commission (SEC) mandates that any institution managing over $100 million must file a document called a 13F form every quarter. This form lists exactly which US stocks they bought, sold, or held over the last three months.
Key Concept: Think of institutions as massive cargo ships in a small harbor. They move slowly, but they create massive waves that push all the smaller boats around. When you learn to read institutional ownership data, you can position your small boat to ride their waves instead of getting capsized by them.
Is Institutional Ownership Good for a Stock?
Yes, institutional ownership is generally good for a stock because it provides price stability, increases trading liquidity, and signals professional confidence in the company. However, extremely high ownership levels can create risks if these large funds suddenly decide to sell their shares all at once.
Our team prefers to trade stocks that have a healthy backing from major funds. When a mutual fund decides to buy a stock, they don't just buy a few hundred shares. They accumulate hundreds of thousands of shares over several weeks or months. This steady buying pressure creates a strong floor under the stock price, making it less likely to experience random, massive drops.
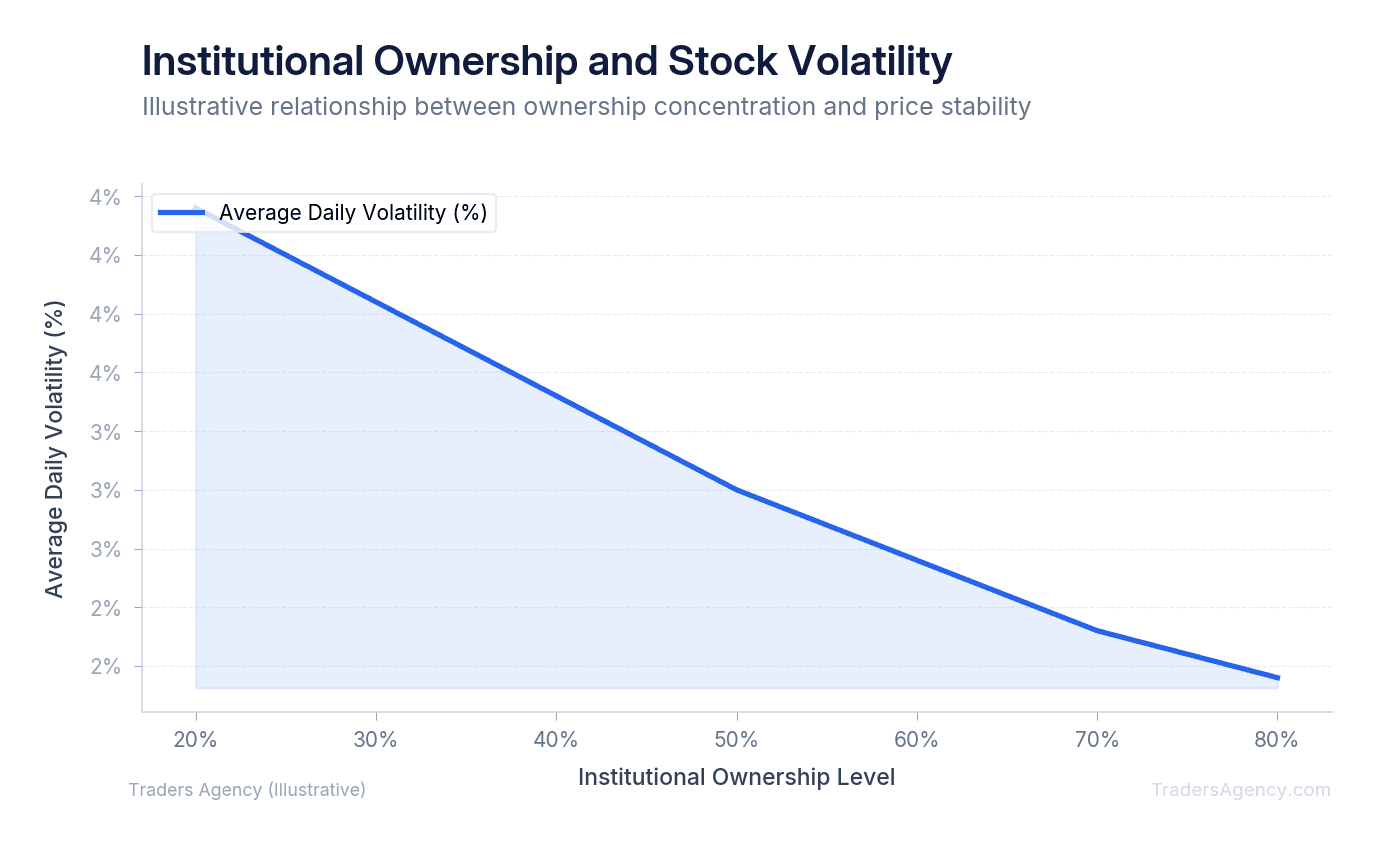
High institutional backing also means better liquidity. Liquidity refers to how easily you can buy or sell a stock without affecting its price. Because institutions are constantly trading large volumes, retail traders can easily enter and exit positions. You'll usually see tighter bid-ask spreads on these stocks, which saves you money on every single trade.
Finally, institutions employ armies of analysts to research companies before they invest a single dollar. If several major funds are buying a stock, it tells us that professional analysts have reviewed the company's financials and believe it has strong growth potential. We use this as a built-in layer of fundamental research.
Where Can You Find Institutional Ownership Data for Free?
You don't need expensive software to track what the big funds are doing. We teach our members to use free public resources to gather this information quickly and accurately. Here's our step-by-step process:
- Run a Basic Screener: The fastest way to start is by using an institutional ownership stock screener. Free platforms like Yahoo Finance or Finviz allow you to filter the entire stock market based on ownership percentages. Set a filter to only show companies with greater than 50% institutional ownership. This immediately narrows down thousands of stocks to a manageable list of high-quality candidates.
- Check Specific Company Profiles: Once you have a stock in mind, look up its specific profile on any major financial website. Navigate to the "Holders" or "Ownership" tab. Here, you'll see exactly what percentage of the stock is held by insiders (company executives) versus institutions. You'll also see a list of the top institutional holders, such as Vanguard or BlackRock.
- Track the SEC 13F Filings: For the most accurate data, go straight to the source. The SEC's EDGAR database is free to the public and contains every official 13F filing. Because government databases can be clunky to read, our team often uses free third-party tracking sites like Whale Wisdom. These sites organize the SEC data into clean, readable charts so you can see exactly when a specific hedge fund bought or sold their shares.
Want expert trading insights delivered daily?
Join thousands of traders who rely on Traders Agency for market analysis and trade ideas.
Join Traders AgencyCan Too Much Institutional Ownership Hurt a Stock?
While having institutional support is generally positive, there is a dangerous tipping point. When a stock becomes too popular among large funds, it becomes what we call a "crowded trade." This introduces a specific type of danger known as herding risk.
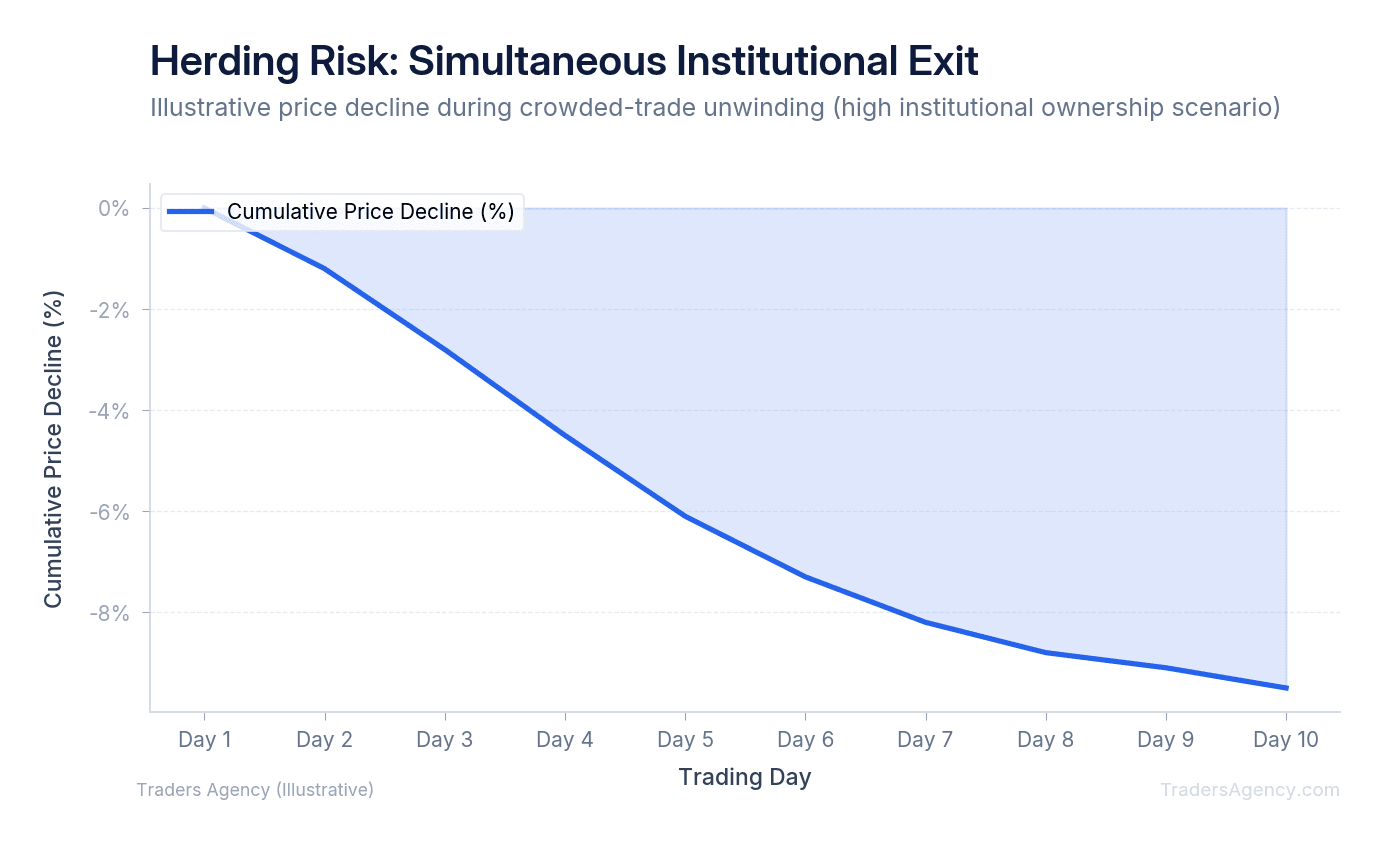
Imagine a mid-cap technology stock trading at $45 per share with an unusually high 92% institutional ownership. The company reports its quarterly earnings and misses its revenue target by just a tiny margin. Suddenly, five different mutual funds decide they need to reduce their risk and sell their positions.
Because institutions own almost all the available shares, there are very few buyers left in the market to absorb that massive wave of selling. The funds end up tripping over each other trying to exit the position at the same time. This panic selling can cause the stock price to gap down aggressively, plummeting from $45 to $30 in a matter of hours.
Watch Out: We always warn our students to be cautious when a stock's institutional ownership climbs above 85%. At that level, the stock is fully priced for perfection. Any bad news will trigger a massive institutional exit, leaving retail traders trapped in a rapidly declining asset.
How Do You Use Institutional Ownership When Making Investment Decisions?
Now that you understand the mechanics, we'll show you how to apply this to a real trading plan. You should never buy a stock solely because a hedge fund bought it. Instead, use this data as one specific filter in your broader strategy.
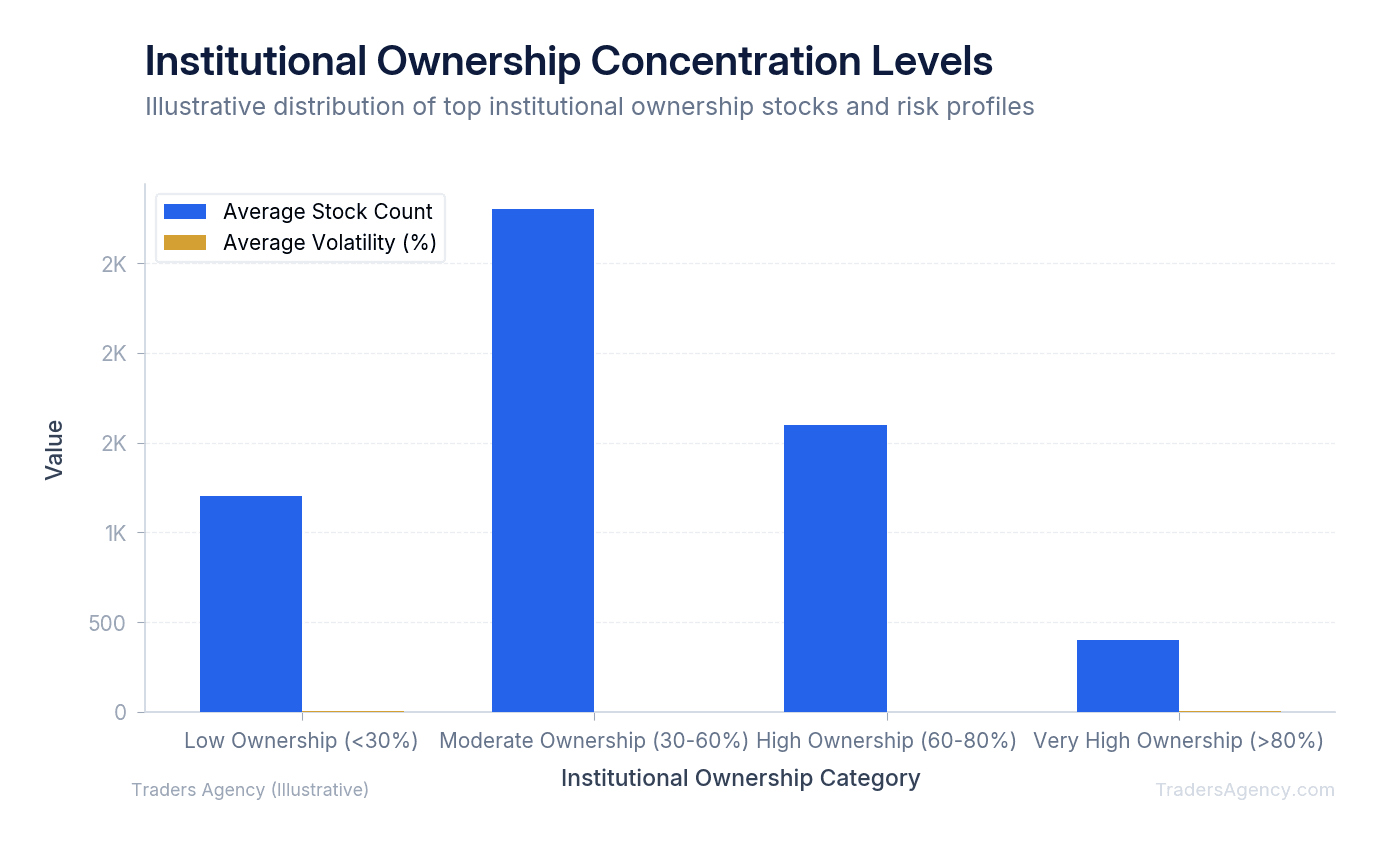
When we look for institutional ownership stocks to buy, we follow a strict set of criteria to manage our risk. Here's the exact checklist our team uses:
- Target the Sweet Spot: We look for companies with institutional ownership between 40% and 75%. This shows strong professional support but leaves enough room for new funds to buy in and drive the price higher.
- Check the Trend: We want to see the ownership percentage increasing over the last two quarters. If institutions are slowly accumulating shares, it's a bullish signal. If the percentage is dropping, we stay away.
- Verify the Volume: We check the average daily trading volume. We want to see at least 1 million shares traded per day to ensure we can enter and exit our trades easily.
- Set Firm Stop Losses: Even with institutional support, stocks can fall. We always place a hard stop loss at 8% to 10% below our entry price to protect our capital from unexpected institutional dumping.
Practical Example: Putting It All Together
Here's how this looks in practice. You find a stock trading at $50 per share with 60% institutional ownership. You check the recent 13F filings and see that three major funds initiated new positions in the stock last quarter. The stock has broken above its 50-day moving average on high volume.
| Parameter | Value |
|---|---|
| Stock Price | $50.00 |
| Institutional Ownership | 60% (within our 40-75% sweet spot) |
| Quarterly Trend | 3 new major fund positions initiated |
| Daily Volume | 1.8 million shares (above our 1M minimum) |
| Technical Signal | Breakout above 50-day moving average |
| Stop Loss | $45.00 (10% below entry) |
This combination of technical strength and institutional backing gives you a high-probability setup to enter a long position. The institutional data doesn't replace your technical analysis. It confirms it.
What Stock Has the Highest Institutional Ownership?
While exact rankings change daily, large-cap technology companies like Microsoft and Apple frequently rank among the top institutional ownership stocks. In some cases, smaller companies might show over 100% institutional ownership due to short selling mechanics and reporting delays, though a healthy target is typically between 50% and 80%.
You might be wondering how a stock can have more than 100% institutional ownership. This mathematical oddity happens because of short selling. When an institution shorts a stock, they borrow shares from one fund and sell them to another fund. Both funds then report those same shares on their 13F filings, temporarily inflating the total percentage until the short position is closed.
Watch Out: If you see a stock with over 100% ownership, it usually means the stock is heavily shorted. We advise beginner traders to avoid these situations entirely. They are highly volatile and prone to aggressive short squeezes that can wipe out an unprepared trader.
Instead, focus your attention on stable, growing companies in the middle of the pack. By tracking where the large funds are quietly parking their capital, you can make more informed, confident decisions in your own trading account. The data is free, the filings are public, and the edge is real. You just have to know where to look.
Want expert trading insights delivered daily?
Join thousands of traders who rely on Traders Agency for market analysis and trade ideas.
Join Traders AgencyKey Takeaways
- Institutional ownership stocks are companies where the majority of shares are held by entities like mutual funds, pension funds, hedge funds, and insurance companies, whose large-scale buying and selling can directly move prices.
- Every publicly traded company has a fixed number of shares outstanding, and tracking what percentage institutions hold gives retail traders a clearer picture of where large capital is being deployed.
- Ownership figures above 100% typically signal heavy short interest, which creates conditions for volatile short squeezes that can be especially dangerous for unprepared traders.
- Institutional 13F filings are public documents, meaning the data needed to track smart money positioning is freely accessible without any paid tools.
- The article advises focusing on stable, growing companies with moderate institutional ownership rather than chasing stocks at ownership extremes.
DISCLAIMER: Traders Agency does not offer financial advice. The information provided is for educational purposes only and should not be considered financial advice. Traders Agency is not responsible for any financial losses or consequences resulting from the use of the information provided. Trading carries inherent risks and may not be suitable for all individuals. You are advised to conduct your own research and seek personalized advice before making any investment decisions, recognizing the potential risks and rewards involved.
See more from Traders Agency on Google
Make us a preferred source and our market analysis will appear more prominently in your Google Search, Top Stories, and AI results.
Add to Preferred Sources



