
You have probably seen this happen in your own trading account. A company reports quarterly earnings, announces record-breaking revenue, and beats Wall Street estimates. Yet the stock price immediately plummets 15% in after-hours trading. You are left wondering why the market reacted so negatively to seemingly positive news. The answer almost always lives in the margins, and we are going to show you exactly how to spot it before it happens.
Gross margin trends analysis is a fundamental evaluation method that tracks the percentage of revenue remaining after subtracting the cost of goods sold over multiple quarters. Institutional investors and professional traders look past the top-line revenue numbers to see how much it actually costs the company to produce its goods. If those costs are rising faster than sales, profitability is in danger.
We will walk you through how to spot pricing pressure before it destroys a stock price. By the end of this guide, you will know how to calculate these metrics, where to find the reliable data, and how to apply this early warning system to your own trading strategy.
What Is a Gross Margin Analysis?
Bottom Line: Gross margin trends can reveal pricing pressure and rising production costs before they show up in headline earnings numbers or analyst downgrades. Traders who track these trends across multiple quarters, benchmark them against industry peers, and wait for technical confirmation may be better positioned to anticipate how a stock reacts to earnings rather than reacting after the fact.
A gross margin analysis is the process of evaluating a company's financial health by measuring the revenue left over after accounting for direct production costs. Traders use this metric to assess pricing power, production efficiency, and overall profitability across multiple financial quarters to predict future stock performance.
We teach our members that a single quarter of financial data rarely tells the whole story. You need to look at the trajectory of the business over time. A company might have a great single quarter due to a one-time tax benefit or a temporary spike in demand. However, the long-term trend of their production costs will reveal the true health of their core business model.
Think of a retail company selling consumer electronics. If the store sells a television for $1,000 and it costs $600 to manufacture and ship that unit, the gross profit is $400. The margin is 40%. If supply chain issues push that manufacturing cost up to $750 next year, but the store cannot raise prices because competitors are keeping their prices low, the profit shrinks to $250.
Key Concept: Gross margin measures the percentage of each revenue dollar that remains after paying direct production costs. A declining gross margin means the company is either losing pricing power or absorbing higher costs, both of which signal future earnings trouble.
When this happens across millions of units, the company will eventually fail to meet its earnings estimates. Traders who track these metrics can see the squeeze happening months before the company officially announces an earnings miss.
How Do You Calculate and Track Gross Margin Over Time?
To use this strategy effectively, you must first understand the math. The gross margin formula is straightforward: subtract the Cost of Goods Sold (COGS) from Total Revenue, divide that number by Total Revenue, and multiply the result by 100 to get a percentage.
You can find these exact numbers in official SEC filings. We prefer pulling raw data straight from the SEC EDGAR database or official 10-Q quarterly reports. Many free stock screeners and third-party financial websites round their numbers or categorize expenses differently, which can throw off your calculations.
Here is our step-by-step process for tracking this metric:
- Locate the Income Statement in the company's most recent 10-Q filing.
- Find "Total Net Revenues" or "Total Sales" line item.
- Find "Cost of Revenue" or "Cost of Goods Sold" line item.
- Apply the formula to get the percentage for the current quarter.
- Repeat for the previous four to eight quarters to build a timeline of margin performance.
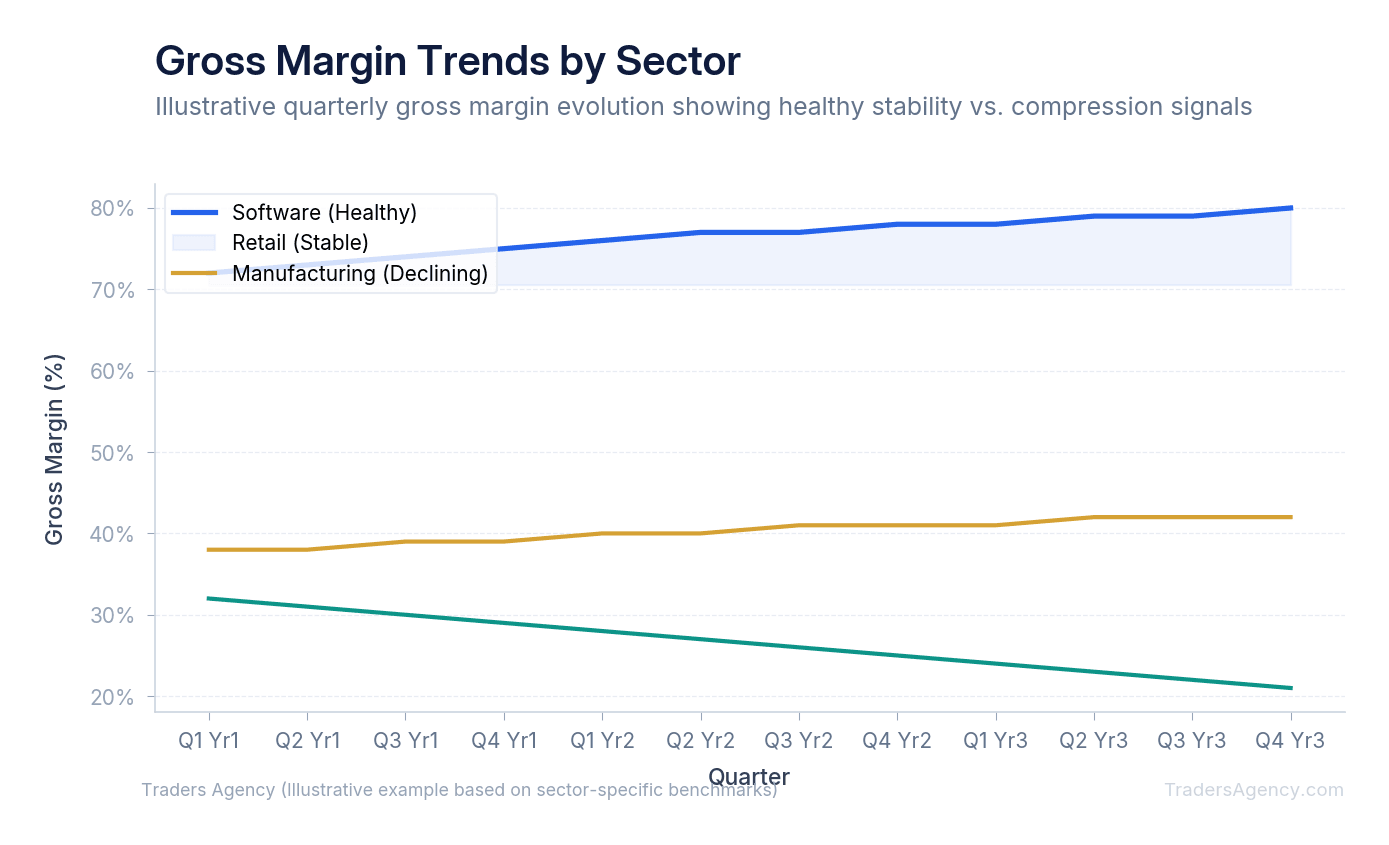
Once you have this data plotted out, you are no longer guessing about the company's efficiency. You have a mathematical representation of their pricing power. If the percentage is steadily climbing, the company is becoming more efficient or successfully raising prices. If it is falling, they are absorbing higher costs.
What Does a Declining Gross Margin Signal to Investors?
A declining gross margin signals that a company is either facing rising production costs or losing its pricing power in a competitive market. This trend acts as an early warning sign for investors, indicating that future earnings per share will likely miss expectations if the margin compression continues unchecked.
This is where the concept becomes an actionable trading strategy. Most amateur traders only look at top-line revenue growth. Our team uses gross margin trend deterioration as a leading indicator for earnings misses before they are reported.
Consider a specific gross margin trends analysis example. Imagine a tech hardware company, Ticker: TECH, reporting strong sales growth. You pull their SEC filings and map out their margins over the last year:
| Quarter | Revenue | COGS | Gross Margin |
|---|---|---|---|
| Q1 | $100M | $50M | 50% |
| Q2 | $110M | $58M | 47% |
| Q3 | $125M | $70M | 44% |
Revenue is growing rapidly, which keeps the mainstream financial news optimistic. However, the cost to produce those goods is growing much faster. The company is sacrificing profitability to achieve that sales growth.
Proper gross margin ratio interpretation tells us that TECH will eventually hit a wall. When operating expenses like marketing and administrative costs are factored in, the shrinking gross profit will not be enough to cover them.
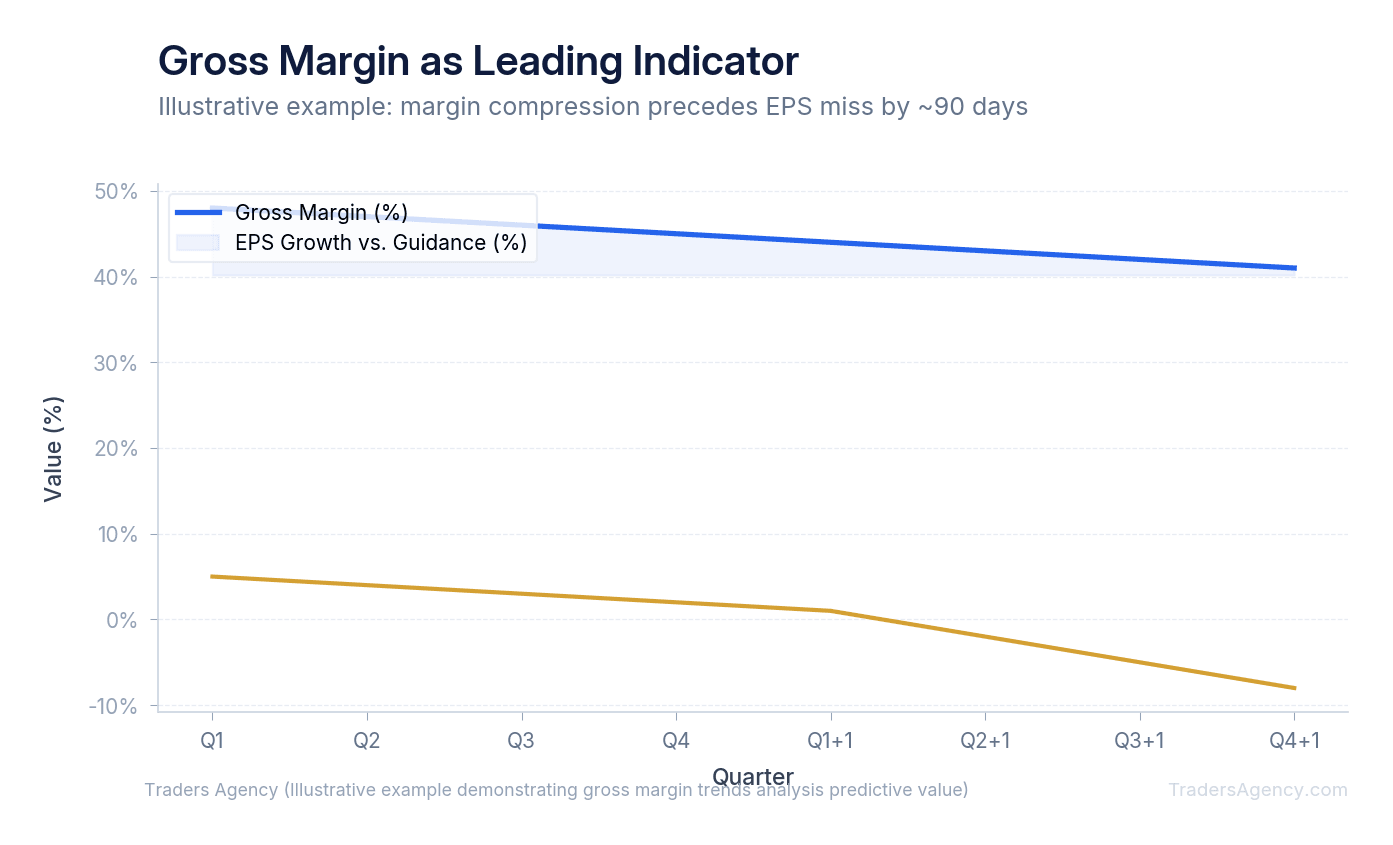
When our team spots this specific pattern, we begin looking for bearish trade setups. We might look to buy put options expiring after the next earnings date. For example, if TECH is trading at $50, we might buy the $45 strike puts for a $2.00 premium, risking $200 per contract to capitalize on the inevitable earnings miss.
Watch Out: Revenue growth alone does not equal a healthy business. A company growing sales at 25% while margins compress by 3 points per quarter is on a collision course with an earnings miss. Always check the margin trend behind the headline numbers.
Sector-Specific Benchmarks: What Good and Bad Gross Margin Looks Like
You cannot compare a software company to a grocery store. Different industries have entirely different cost structures and capital requirements. We always tell our traders to judge a company based on its specific sector benchmarks rather than a universal standard.
A software-as-a-service business often boasts margins around 75% to 85%. Duplicating software and hosting it on a cloud server costs almost nothing compared to the subscription price. If a cloud computing stock drops to a 60% margin, that is a massive red flag indicating severe pricing pressure or bloated server costs.
Conversely, a traditional grocery chain operates on razor-thin margins, typically between 20% and 25%. They deal with physical inventory, spoilage, massive supply chains, and intense local competition. A grocery stock maintaining a steady 23% margin is executing its business model perfectly.
Here are the general baselines we track:
| Sector | Typical Gross Margin Range |
|---|---|
| Software and Technology | 70% to 85% |
| Pharmaceuticals | 65% to 80% |
| Retail and Apparel | 35% to 50% |
| Automotive Manufacturing | 10% to 20% |
Always evaluate the metric within the context of the industry. A 40% margin is terrible for a cybersecurity firm but absolutely exceptional for a car manufacturer.
Want expert trading insights delivered daily?
Join thousands of traders who rely on Traders Agency for market analysis and trade ideas.
Join Traders AgencyWhat Is COGS Decomposition and How Does It Reveal the Cause of Margin Compression?
To truly understand why profitability is shrinking, you must break down the Cost of Goods Sold into its individual parts. We call this COGS decomposition. This process helps you pinpoint the exact root cause of the margin compression so you can determine if the issue is temporary or permanent.
You need to look at the management discussion section of the 10-Q filing to find these details. We break COGS down into three primary categories:
- Material Costs: Are raw materials becoming more expensive? If a furniture maker is paying double for lumber, their margins will shrink.
- Labor Expenses: Have wages increased in the manufacturing facilities? Union strikes or labor shortages can permanently raise the cost of production.
- Overhead and Freight: Are shipping, fuel, and factory maintenance costs eating into profits?
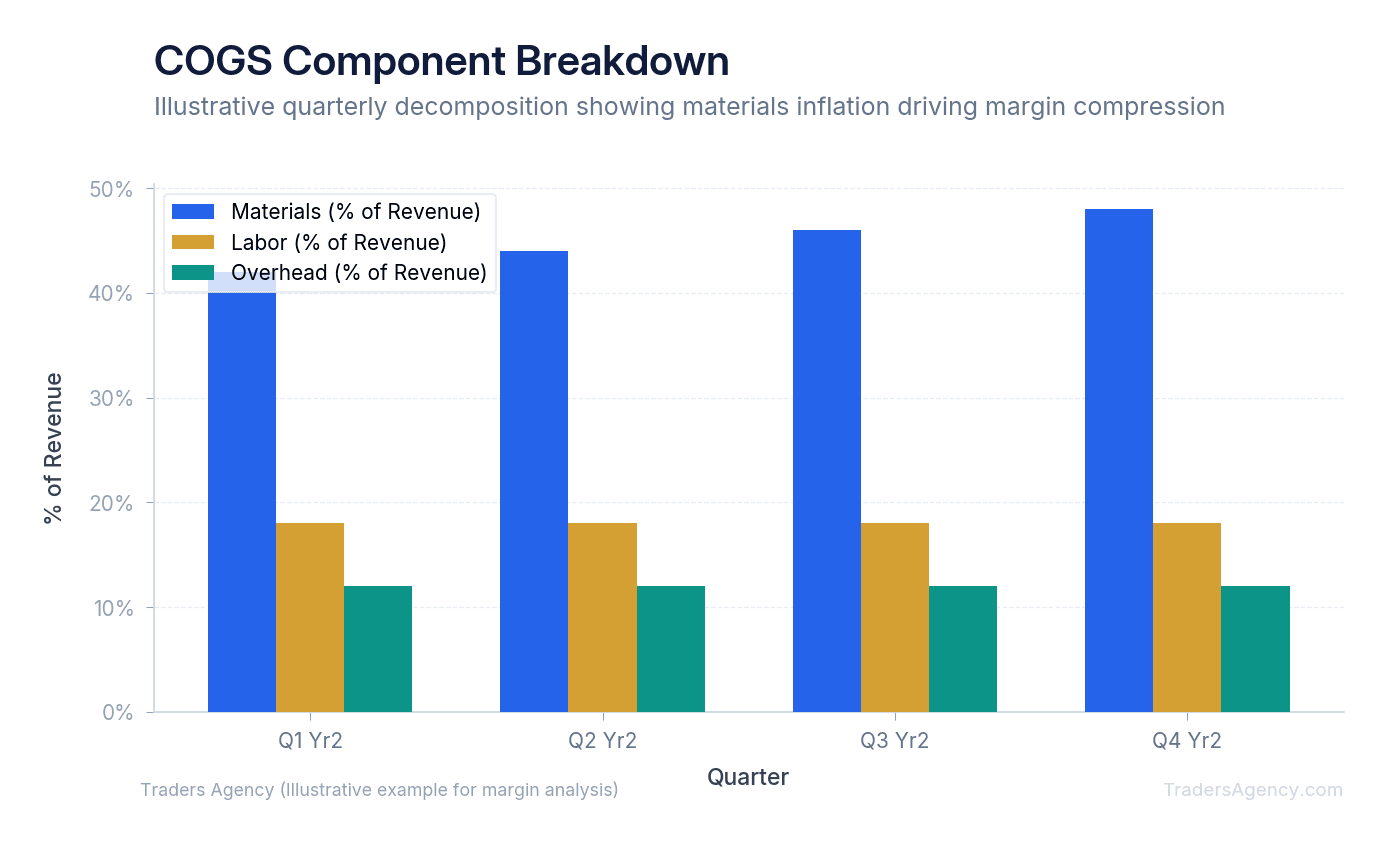
If the compression is caused by a temporary spike in freight costs due to a short-term port strike, the stock might actually be a buying opportunity when it dips. The costs will eventually normalize. However, if the compression is caused by permanent wage increases, the company will have to raise prices to survive. If they cannot raise prices, their stock will likely suffer a sustained downtrend.
Key Concept: Temporary cost spikes (port strikes, weather events, one-time supply disruptions) create buying opportunities. Permanent cost increases (wage inflation, regulatory compliance, structural supply shortages) create sustained downtrends. The COGS decomposition tells you which scenario you are facing.
How Do You Compare Gross Margin Against Industry Peers?
To analyse gross margin effectively, traders must compare a company's current margin percentage against its own historical performance and its direct industry competitors. This dual approach reveals whether margin compression is an isolated company problem or a broader macroeconomic sector issue.
Do not just look at a company in isolation. You need to compare gross margin trends against peers to get the full picture. If a company is losing profitability while its direct competitors are maintaining theirs, the company has a specific operational failure.
Here is a practical margin analysis example. Say you are evaluating two competing home improvement retailers: Ticker: BUILD and Ticker: WOOD.
You notice that BUILD has seen its margin drop from 35% to 31% over the last year. Your first instinct might be to short the stock. However, you then pull the SEC filings for WOOD and see their margin dropped from 34% to 28% during the exact same period.
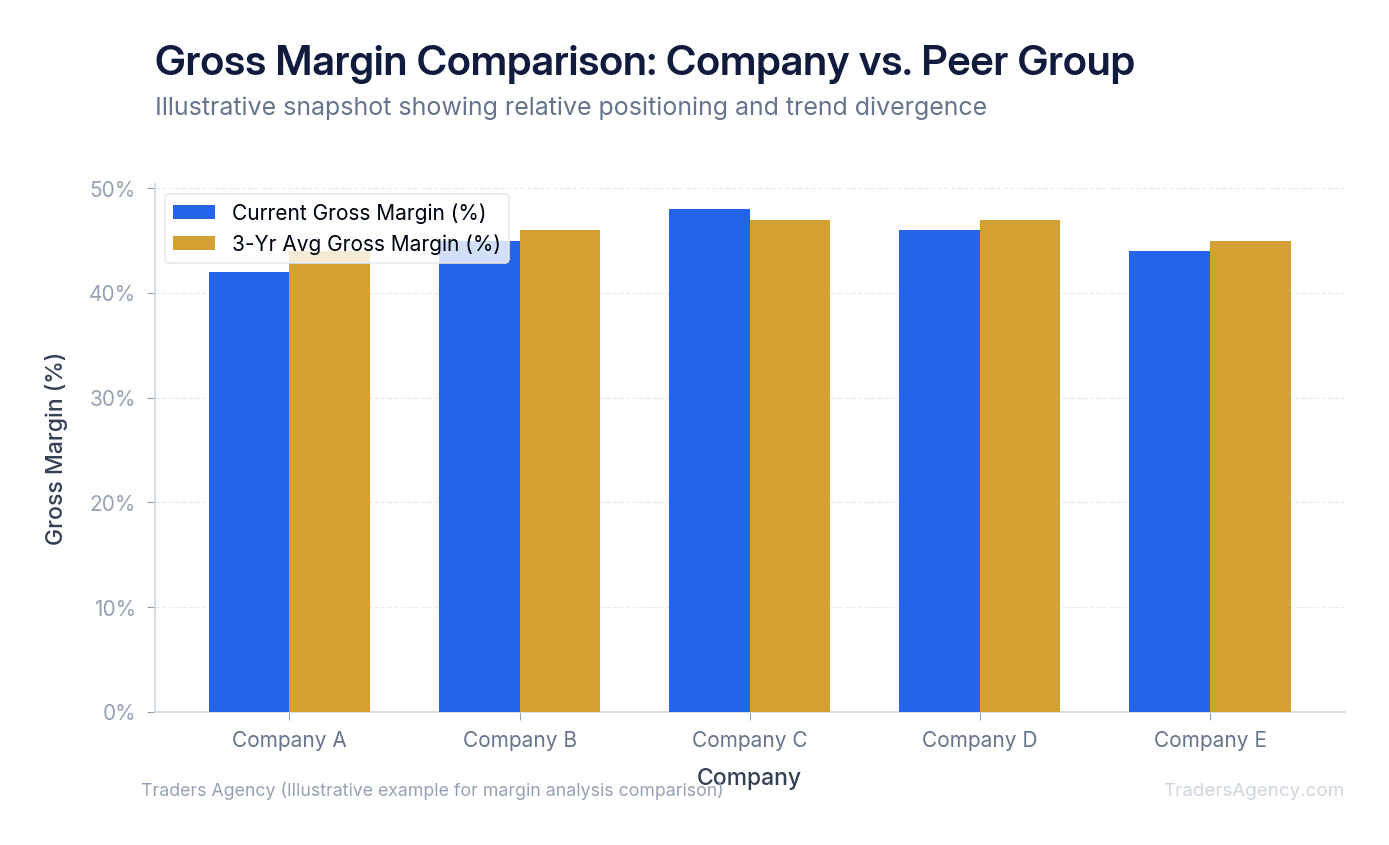
In this scenario, the entire sector is facing a macroeconomic headwind, likely related to lumber prices or housing market slowdowns. BUILD is actually outperforming its main competitor by managing the crisis better. Shorting BUILD might be a mistake because they are the strongest player in a weak sector.
We always map out the top three competitors in a space before making a trading decision. The strongest stock to buy is often the one that maintains its pricing power while its competitors bleed cash.
Practical Application and Risk Management
Fundamental metrics do not dictate daily price action. You should not use this strategy for short-term day trading or scalping. We apply this specific fundamental analysis during earnings season preparations and when building long-term swing trading positions.
Combining Fundamentals with Technical Analysis
We prefer to combine this fundamental early warning system with technical analysis for precise entry points. If we identify a company with three consecutive quarters of margin compression, we do not just blindly short the stock. We wait for a technical breakdown to confirm that institutional money is also heading for the exits.
For example, we will monitor the stock's daily chart. If the stock breaks below its 200-day moving average on high volume, we use that technical trigger as our entry signal. The fundamental data gives us the conviction, and the technical chart gives us the timing.
Position Sizing and Capital Protection
Even the most accurate fundamental analysis can be temporarily ignored by a highly emotional market. A stock with terrible financials can still rally during a broad market bull run. This is why strict risk management is mandatory.
Our team recommends limiting position sizes to 2% to 5% of your total account equity per trade. If you have a $10,000 account, you should not risk more than $200 to $500 on a single earnings play.
| Parameter | Our Recommendation |
|---|---|
| Position Size | 2% to 5% of total account equity |
| Stop Loss (Short Position) | 10% above entry price |
| Minimum Margin Decline | 3+ consecutive quarters of compression |
| Technical Confirmation | Break below 200-day moving average on high volume |
Always use hard stop losses to protect your capital. If you short a stock at $100 because you expect an earnings miss, place a buy-to-cover stop order at $110. If the market behaves irrationally and bids the stock up, you take a small, manageable loss and preserve your capital for the next opportunity.
Risk Warning: Fundamental analysis provides conviction, not certainty. Markets can remain irrational longer than your account can remain solvent. Never risk more than you can afford to lose on a single trade, and always use defined stop losses regardless of how confident you are in the thesis.
By tracking these trends, comparing them against industry peers, and waiting for technical confirmation, you can position yourself ahead of the crowd. You will stop guessing how earnings reports will turn out and start trading based on the mathematical realities of the underlying business.
Want expert trading insights delivered daily?
Join thousands of traders who rely on Traders Agency for market analysis and trade ideas.
Join Traders AgencyKey Takeaways
- A company can beat revenue estimates and still signal deteriorating financial health if gross margin is contracting quarter over quarter, which is why institutional investors prioritize margin trends over top-line growth.
- Gross margin is calculated as revenue minus cost of goods sold, expressed as a percentage of revenue. Tracking this figure across multiple quarters reveals whether production costs are rising faster than sales prices.
- COGS decomposition breaks down the cost of goods sold into its components, such as raw materials, labor, and logistics, so traders can identify the specific source of margin compression rather than treating it as a single undifferentiated number.
- Comparing a company's gross margin trend against sector-specific benchmarks matters because acceptable margins vary widely by industry. A margin that looks healthy in one sector may signal serious trouble in another.
- Technical confirmation is recommended before acting on a fundamental margin thesis. Waiting for price action to align with the deteriorating margin data may reduce the risk of entering a trade too early.
DISCLAIMER: Traders Agency does not offer financial advice. The information provided is for educational purposes only and should not be considered financial advice. Traders Agency is not responsible for any financial losses or consequences resulting from the use of the information provided. Trading carries inherent risks and may not be suitable for all individuals. You are advised to conduct your own research and seek personalized advice before making any investment decisions, recognizing the potential risks and rewards involved.
See more from Traders Agency on Google
Make us a preferred source and our market analysis will appear more prominently in your Google Search, Top Stories, and AI results.
Add to Preferred Sources



