
You've probably seen this happen. You spot a perfect technical breakout on your chart, you buy the new high, and the price instantly reverses, stopping you out for a loss. What went wrong? The answer almost always lies in the order flow. Time and sales trading is an advanced analytical method where we track individual executed orders and volume in real-time to anticipate short-term price movements. By monitoring the tape alongside the Level 2 order book, we can see exactly where institutional buyers and sellers are stepping in, giving us an edge that standard charting simply cannot provide.
In this guide, we'll walk you through how to identify hidden liquidity, spot exhaustion patterns, and execute high-probability entries using modern order flow techniques. Standard charting shows you the past, but the tape shows you the immediate present. By the end, you'll know how to read the battle between buyers and sellers at a granular level and apply these concepts to your daily trading routine.
What Is Time and Sales Trading and Why Does It Work?
Bottom Line: Time and sales trading gives day traders a real-time view of market mechanics that historical charts cannot provide. The core skill is learning to distinguish genuine institutional activity from noise in the tape, then aligning those signals with the broader trend context. Traders who develop this discipline may find themselves better positioned to avoid breakout traps and identify higher-probability entries.
Time and sales trading is the practice of reading the real-time transaction log of a financial instrument to gauge market sentiment and identify institutional activity. This log displays the exact price, size, and time of every executed trade, revealing the true aggression of buyers and sellers.
While a standard candlestick chart shows you the historical result of a price battle, the tape shows you the mechanics of the battle as it happens. We teach our members to view the tape as the heartbeat of the market. When you combine this transaction data with the Depth of Market (DOM), you gain a three-dimensional view of supply and demand.
Key Concept: Think of the Level 2 order book as the menu of what traders want to do, while the time and sales window is the receipt of what they actually did. The order book shows intent. The tape shows commitment.
Institutional players cannot hide their executed volume. By studying these receipts, an experienced trader can spot when a large fund is quietly accumulating a position or dumping shares into retail buying pressure. This provides a distinct mathematical edge over traders who only look at moving averages or trendlines.
How Do You Read the DOM and Level 2 Order Book Together?
To master any tape reading day trading strategy, you must understand how pending orders interact with executed trades. The Level 2 order book displays resting limit orders across various price levels. The DOM visually stacks these orders, showing the exact liquidity available at the bid and the ask.
We prefer to watch the interaction between the resting liquidity and the aggressive market orders. If you see a massive resting sell order of 500 contracts at the ask, you need to watch the tape to see how buyers react. Do they aggressively buy into that wall, or does the buying volume dry up before it even reaches the level?
When aggressive buyers continuously hit the ask but the price does not move up, you are witnessing absorption. The institutional seller is absorbing all the buying pressure, acting like a brick wall against the current trend.
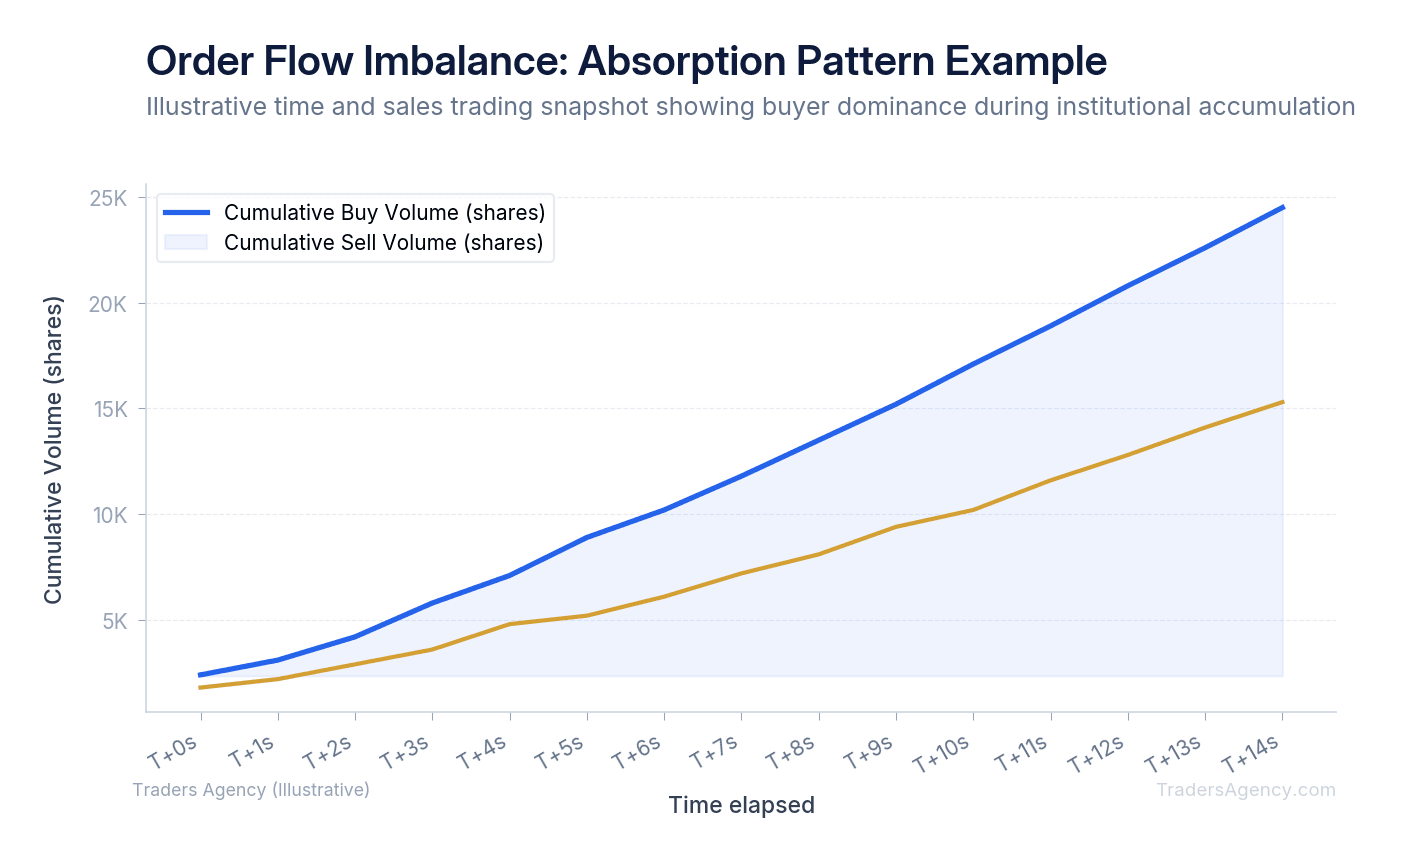
This absorption is a clear signal that the breakout will likely fail. The resting limit orders act as a ceiling, and the tape confirms that the buyers lack the firepower to break through. Advanced traders use this exact discrepancy to fade the breakout and take a short position.
Is Tape Reading Still Useful in Modern Markets?
Yes, tape reading is still highly useful for modern day traders. While high-frequency trading algorithms dominate today's markets, they still leave recognizable footprints in the order flow. By using advanced software, retail traders can filter out algorithmic noise and identify the large institutional orders driving market direction.
Many traders wonder if the classic principles of tape reading still apply today. The core psychology of supply and demand remains completely identical. Fear, greed, and institutional accumulation happen the exact same way they did a century ago. However, the speed of execution has changed drastically.
You cannot read a raw, unfiltered tape by eye anymore. High-frequency algorithms execute thousands of one-lot trades per second. Instead, we use modern tools that aggregate these micro-trades and highlight the actual block orders. This allows us to see the true intent of institutional participants, making order flow analysis a mandatory skill for professional-grade trading.
How Do You Identify Institutional Footprints in the Order Flow?
You identify institutional footprints by looking for iceberg orders, unnatural resting liquidity, and repetitive block trades on the tape. Institutions use algorithms to slice massive orders into smaller, hidden increments. Spotting these hidden orders allows you to trade alongside institutional money before the broader market reacts.
One of the most common institutional tactics is the iceberg order. An iceberg order only displays a small fraction of its true size on the Level 2 order book. For example, an institution might want to buy 10,000 shares of a stock, but they only show 100 shares on the bid.
As sellers hit that 100-share bid, it instantly refreshes with another 100 shares. The tape will show thousands of shares executing at that specific price, but the Level 2 bid never drops. This is a massive footprint that retail traders completely miss if they only look at a standard chart.
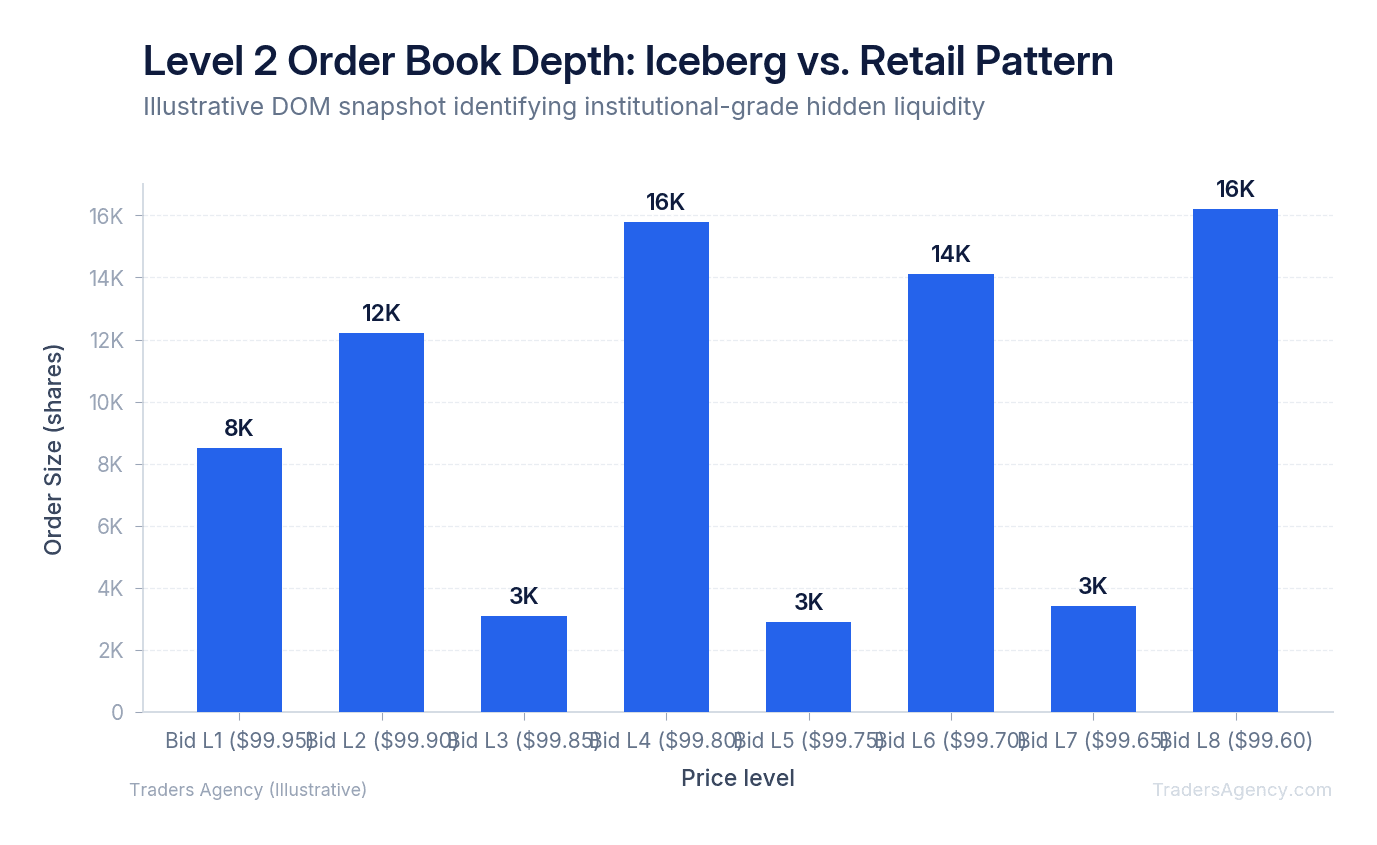
Key Concept: When an iceberg bid constantly refreshes at the same price level, a large buyer is defending that level. This creates a "floor" for the price and provides an excellent low-risk entry point for a long position. Place your stop loss just a few cents below their hidden order.
Want expert trading insights delivered daily?
Join thousands of traders who rely on Traders Agency for market analysis and trade ideas.
Join Traders AgencyWhat Are Absorption and Exhaustion Patterns in Order Flow?
The interaction between buyers and sellers often culminates in specific order flow patterns. The two most reliable patterns we teach are absorption and exhaustion. Understanding the mechanical difference between the two will significantly improve your trade timing and win rate.
Absorption happens when aggressive market orders are met with massive passive limit orders. The aggressive participants are trying to push the price, but the passive participant absorbs all their volume. The price stalls completely despite heavy volume printing on the tape.
Exhaustion occurs when the aggressive participants simply run out of volume. The tape slows down, the order sizes shrink from hundreds of contracts to single digits, and the price drifts aimlessly.
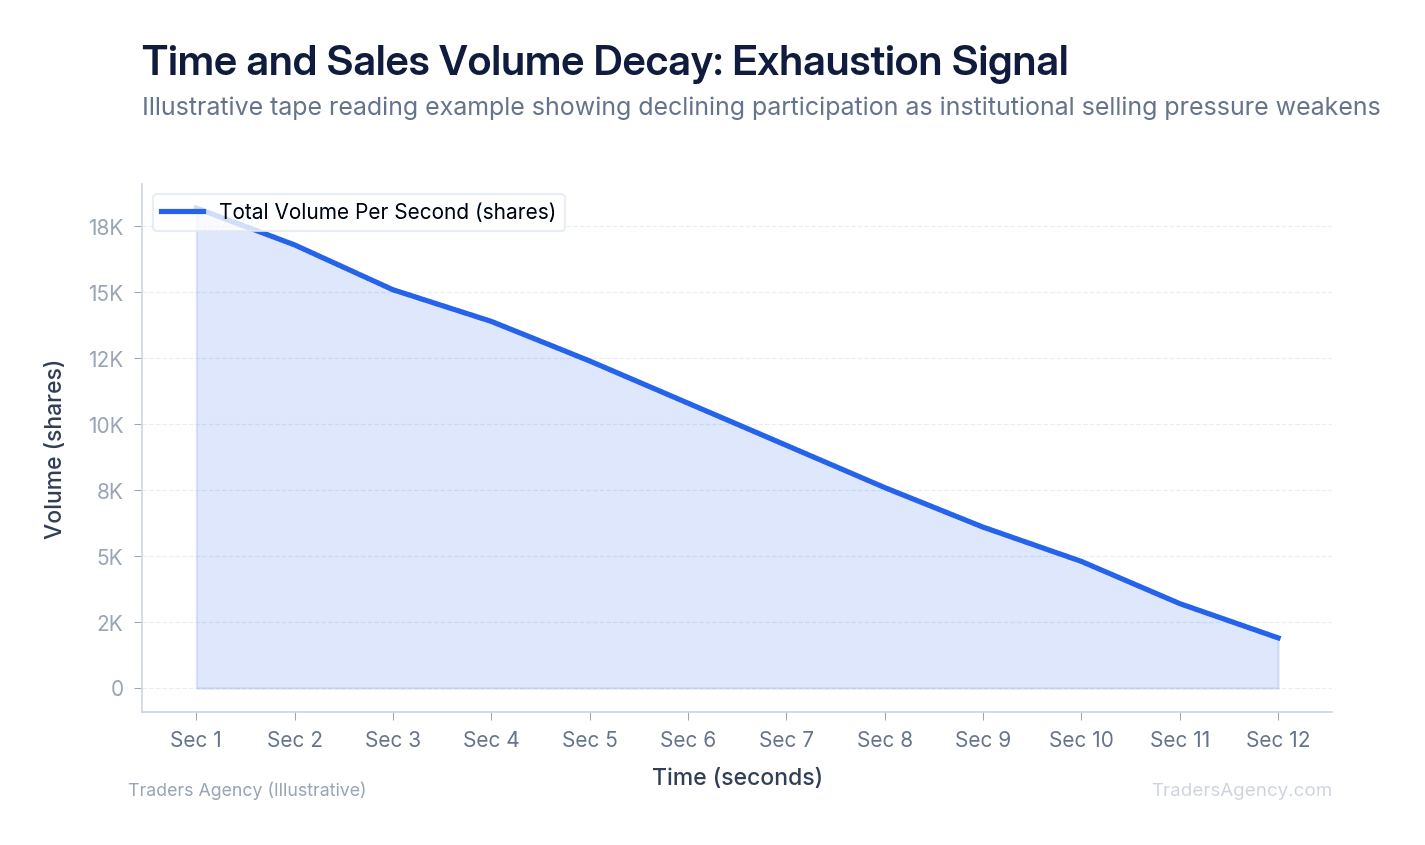
When you see exhaustion at a key support or resistance level, a reversal is highly probable. The battle has ended, and the opposing side is ready to take control of the market. Recognizing this shift in momentum before the price actually turns is the primary advantage of order flow trading.
Step-by-Step Example: Trading an Exhaustion Setup
To make this concrete, here's a specific trade setup using the E-mini S&P 500 Futures (ES). We'll look for an exhaustion pattern at a major resistance level and execute a short position.
- Step 1: Identify the Setup. The ES is rallying toward a known daily resistance level at 4,150.00. As the price approaches this level, we pull up our DOM and our filtered time and sales window. We are looking for aggressive buying to dry up right as the price tests the resistance zone. We want to see the buyers throw their best punch and fail.
- Step 2: Confirm Exhaustion on the Tape. The price hits 4,149.75. The tape shows rapid buying. Orders of 50, 75, and 100 contracts are hitting the ask in rapid succession. Suddenly, the price ticks up to 4,150.00, but the order sizes drop dramatically. We now see orders of 1, 2, and 3 contracts trickling in slowly. The buying volume has exhausted itself exactly at our structural level.
- Step 3: Execute the Trade. We place a market sell order to go short at 4,149.75. We place our stop loss exactly two ticks above the resistance at 4,150.50. This gives us a highly defined, tight risk parameter based on actual market mechanics, not an arbitrary percentage.
- Step 4: Manage the Position. Because the buyers are exhausted, sellers immediately step in to take control. The tape lights up with large red sell orders of 100+ contracts. The price drops rapidly to 4,145.00, where we take our profit.
| Scenario | Exit Price | Profit/Loss per Contract |
|---|---|---|
| Best Case | 4,145.00 | +$237.50 (4.75-point gain) |
| Worst Case | 4,150.50 | -$37.50 (3-tick loss) |
| Risk-to-Reward Ratio | 6.3 : 1 |
The risk-to-reward ratio here is exceptional because we used the tape to pinpoint the exact moment of failure. We're not guessing where resistance might hold. We're watching it hold in real-time.
Integrating Tape Reading Software with Your Workflow
You cannot rely on standard retail brokerage platforms for advanced order flow analysis. To execute a proper tape reading day trading strategy, you need specialized tools. Many of our members attempt to use a standard charting setup, but they quickly realize they need dedicated order flow software to see the full picture.
Programs like Bookmap, Sierra Chart, or Jigsaw Trading provide the granular data required. These platforms aggregate the tape, filter out 1-lot algorithmic trades, and visually map the resting liquidity on your charts. They transform a fast-moving wall of numbers into a readable visual format.
If you prefer a more traditional charting setup, you can use specific tape reading indicators on platforms like TradingView that approximate order flow. While TradingView is primarily a standard charting platform, certain volume profile and footprint add-ons can bridge the gap between price action and order flow data.
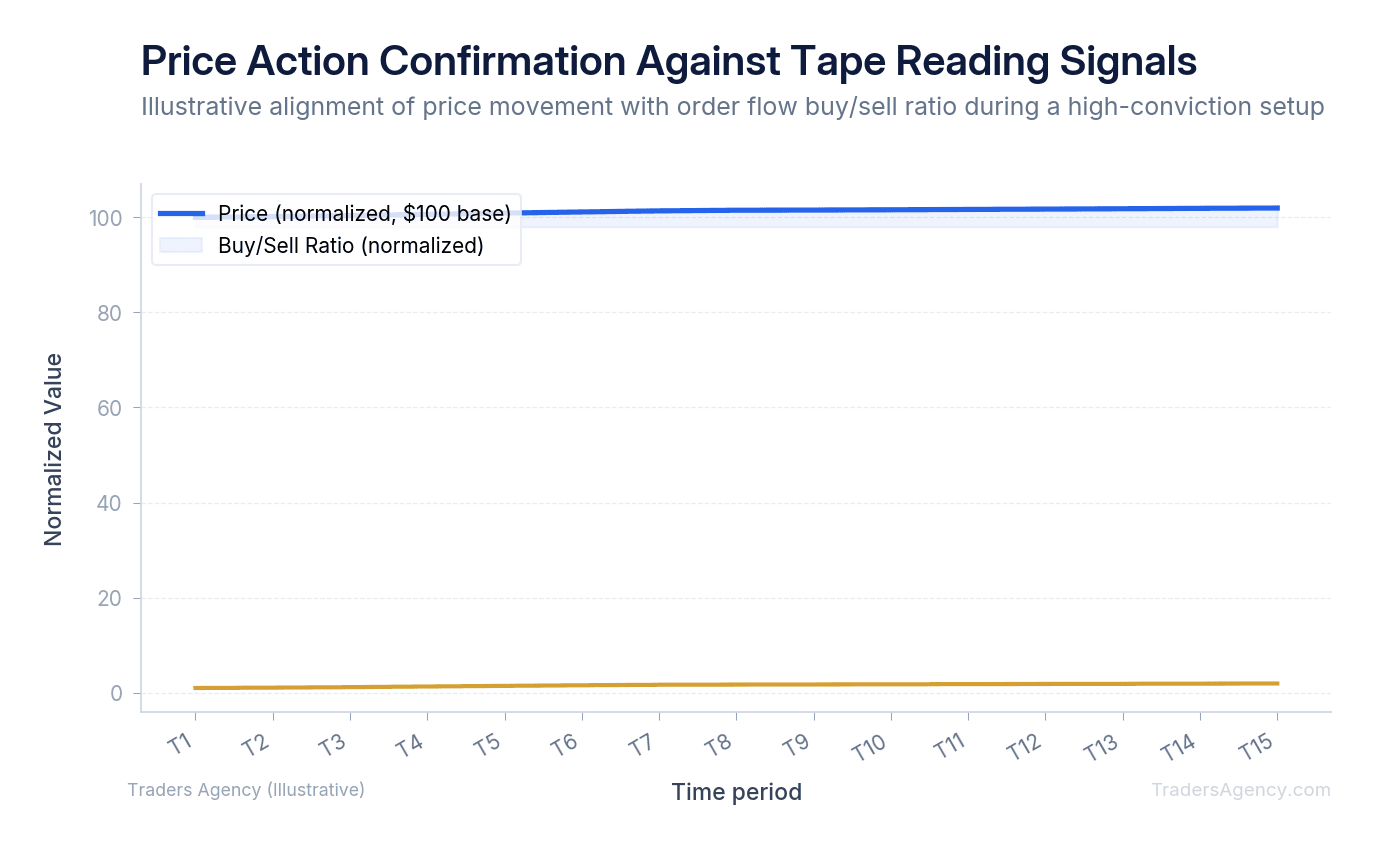
We recommend keeping your primary price chart on one monitor and your DOM and tape on another. This setup allows you to identify the structural trend on the chart while using the tape for precise, tick-level entries. The CME Group provides extensive educational resources on futures order types and execution quality that complement this approach.
Practical Application and Risk Management
Time and sales trading requires intense focus and strict risk management. This is not a strategy you use in a slow, ranging market with low volume.
Our team recommends using order flow analysis during periods of high liquidity and volatility. The best times are the first two hours of the New York session and the final hour of the day. During the midday lull, the tape becomes erratic and filled with algorithmic noise, leading to false signals and frustrating stop-outs.
Here are the specific criteria we follow for risk management:
- Maximum Allocation: Never risk more than 1% to 2% of your total account equity on a single tape reading setup.
- Stop Losses: Always base your stop loss on the structural order book. Place your stop just behind a massive resting limit order or an identified iceberg level.
- Position Sizing: Scale into your position. If you plan to trade 4 contracts, enter 2 contracts when you see the initial absorption, and add the final 2 when the tape confirms the reversal.
- Trade Invalidation: If the tape speeds up against your position and large block orders start breaking through your defense level, exit immediately. Do not wait for your hard stop to hit.
Watch Out: A common mistake is staring exclusively at the tape and losing sight of the bigger picture. The tape tells you exactly when to enter, but the higher timeframe chart tells you where the market is ultimately heading. Always align your order flow entries with the dominant trend of the day. If the daily chart is in a strong uptrend, use the tape to find hidden buyers on pullbacks rather than trying to short every exhaustion pattern you see.
Order flow trading is one of the most powerful edges available to active day traders. When you combine structural chart analysis with real-time tape reading, you stop guessing and start seeing the market as it truly operates: a continuous auction between aggressive and passive participants. Master this skill, and you'll find yourself on the right side of those breakout traps far more often than not.
Want expert trading insights delivered daily?
Join thousands of traders who rely on Traders Agency for market analysis and trade ideas.
Join Traders AgencyKey Takeaways
- The time and sales log displays the exact price, size, and time of every executed trade, revealing buyer and seller aggression in real time rather than after the fact.
- Reading the tape alongside the Level 2 order book together can help identify where institutional buyers or sellers are stepping in, which standard candlestick charts cannot show.
- Absorption and exhaustion patterns in the order flow can signal when aggressive participants are running out of momentum, offering potential entry points before a price reversal.
- Order flow analysis is most effective when aligned with the dominant trend: use tape reading to find hidden buyers on pullbacks in an uptrend rather than fading every exhaustion signal.
- Combining structural chart analysis with real-time tape reading reframes the market as a continuous auction between aggressive and passive participants, which can improve breakout trade accuracy.
DISCLAIMER: Traders Agency does not offer financial advice. The information provided is for educational purposes only and should not be considered financial advice. Traders Agency is not responsible for any financial losses or consequences resulting from the use of the information provided. Trading carries inherent risks and may not be suitable for all individuals. You are advised to conduct your own research and seek personalized advice before making any investment decisions, recognizing the potential risks and rewards involved.
See more from Traders Agency on Google
Make us a preferred source and our market analysis will appear more prominently in your Google Search, Top Stories, and AI results.
Add to Preferred Sources



