
You have probably watched a stock price fall rapidly, only to bounce off an invisible floor and reverse direction. Pivot point trading is a technical analysis strategy that uses the previous day's high, low, and closing prices to project these exact turning points on a chart. We will walk you through how to calculate these levels, how to read them, and how to apply them to your daily trading routines. Our team recommends learning this method because it removes the guesswork from your morning preparation. Instead of drawing random trendlines, you get objective mathematical levels. By the end of this guide, you will know exactly how to spot these hidden support and resistance zones.
What Are Pivot Points in Trading?
Bottom Line: Pivot point trading gives traders a set of mathematically derived support and resistance levels calculated from the prior day's high, low, and close, removing the need for subjective trendline drawing. The method originated with floor traders and remains useful for planning entries, targets, and stop placements in liquid markets. The levels are objective, but they work best as part of a broader framework rather than as a standalone system.
A pivot point is a technical indicator that calculates potential support and resistance levels based on the high, low, and closing prices from the previous trading period. Traders use these horizontal price levels to identify where market sentiment might shift from bullish to bearish.
We teach our members to think of the main pivot point like a tennis net. If the price stays above the net, the buyers are in control of the game. If the price drops below the net, the sellers take over the momentum.
Key Concept: A pivot point is the average of the previous day's high, low, and close. It acts as a central reference line: price above the pivot suggests bullish sentiment, while price below it suggests bearish sentiment.
This creates a clear, mathematical framework for your pivot points trading strategy. You do not have to guess where a stock might stop falling or where a rally might stall. Instead, you have exact levels drawn directly on your chart.
These levels act as psychological barriers for the market. When thousands of traders look at the exact same numbers, those price zones become highly reactive. That collective attention is what gives pivot points their power.
How Floor Traders Originally Used Pivot Points
Before computers dominated the financial markets, human floor traders stood in exchange pits to buy and sell contracts. These professionals needed a fast, mathematical way to determine if a market was cheap or expensive on any given day. The pivot point formula was developed on trading floors like those at the CME Group to solve this exact problem.
At the end of the trading day, floor traders would take the high, low, and closing prices of the asset. They used simple division to find the average price, which became the main pivot for the next morning.
This historical context explains why these levels still work today. Because so many institutional traders and automated algorithms still respect these classic formulas, the price often reacts exactly at these lines. It becomes a self-fulfilling prophecy based on pure math.
Floor traders could not look at complex digital charts while shouting orders in a crowded pit. They wrote these specific price levels on index cards and kept them in their trading jackets. If the market price dropped to their pre-calculated support number, they started buying. That simplicity is what makes this method so lasting.
How Do You Calculate Daily Pivot Points, Including R1 to R3 and S1 to S3?
You might wonder how to find pivot points without relying entirely on software. While you can easily use a pivot points calculator online, we always recommend learning the manual math first. This builds your understanding of market mechanics.
Here is a specific example using a fictional stock, XYZ Corp. We will calculate the main pivot, three resistance levels (R1, R2, R3), and three support levels (S1, S2, S3).
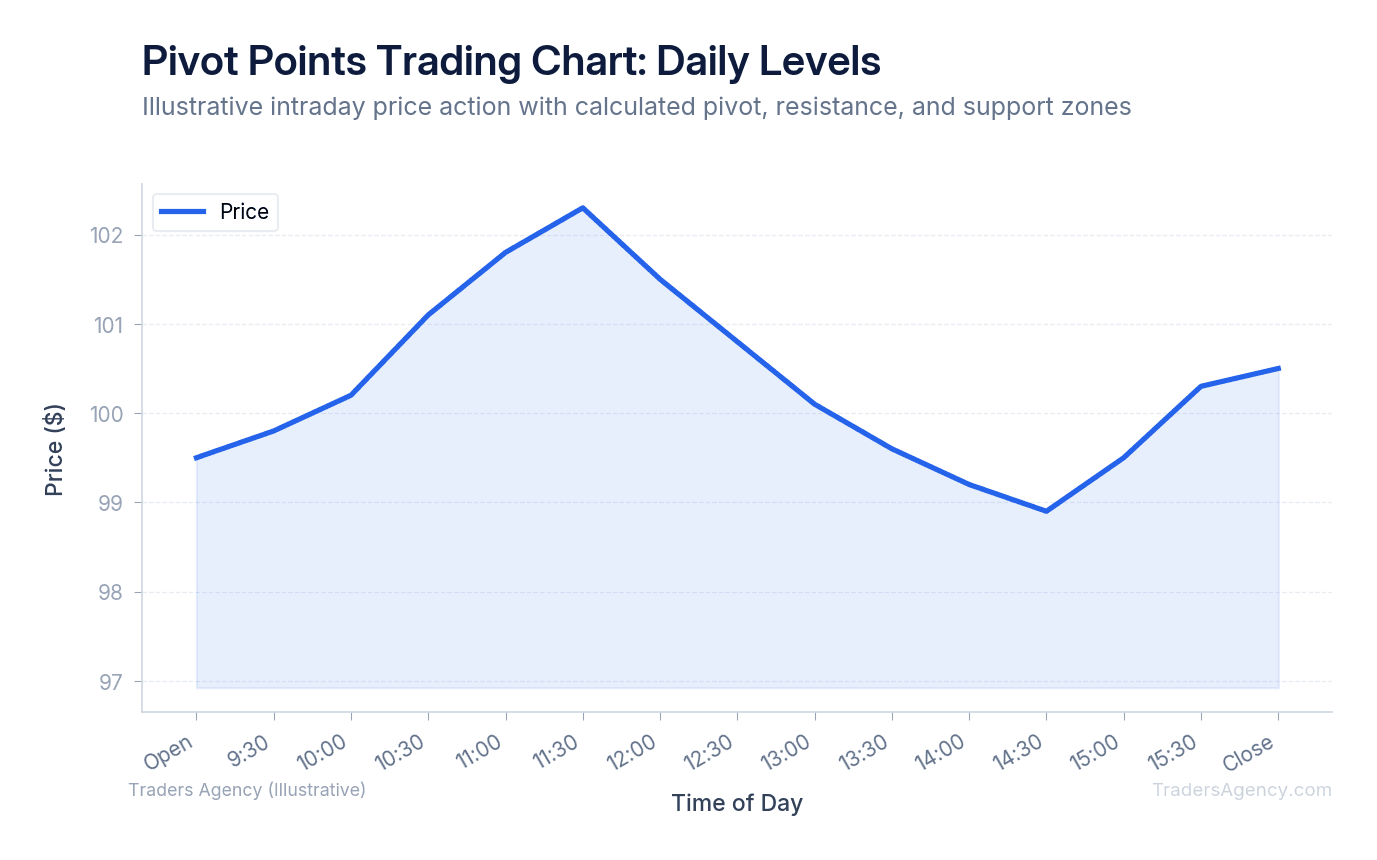
- Find the Previous Day's Data: First, you need the official high, low, and close from yesterday. For this example, XYZ Corp had a high of $105, a low of $95, and a close of $100.
- Calculate the Main Pivot: The main pivot point (often called P or PP) is simply the average of those three numbers. Add the high, low, and close together, then divide by three. For XYZ Corp: $105 + $95 + $100 = $300. Divide that by three, and your main pivot is exactly $100.
- Calculate Support and Resistance Levels: Next, calculate the resistance levels above the pivot and the support levels below it using the formulas in the table below.
| Level | Formula | XYZ Corp Result |
|---|---|---|
| R1 (Resistance 1) | (2 × Pivot) − Low | (2 × $100) − $95 = $105 |
| S1 (Support 1) | (2 × Pivot) − High | (2 × $100) − $105 = $95 |
| R2 (Resistance 2) | Pivot + (High − Low) | $100 + ($105 − $95) = $110 |
| S2 (Support 2) | Pivot − (High − Low) | $100 − ($105 − $95) = $90 |
| R3 (Resistance 3) | High + 2 × (Pivot − Low) | $105 + 2 × ($100 − $95) = $115 |
| S3 (Support 3) | Low − 2 × (High − Pivot) | $95 − 2 × ($105 − $100) = $85 |
What Is the Difference Between Fibonacci Pivot Points and Standard Pivot Points?
As technology improved, traders began modifying the classic floor trader math. The most popular variation we see today involves Fibonacci pivot points.
Standard pivot points use simple addition and subtraction to find support and resistance. Fibonacci pivot points use the exact same main pivot calculation, but they apply Fibonacci ratios to the previous day's price range. The most common ratios used are 38.2%, 61.8%, and 100%.
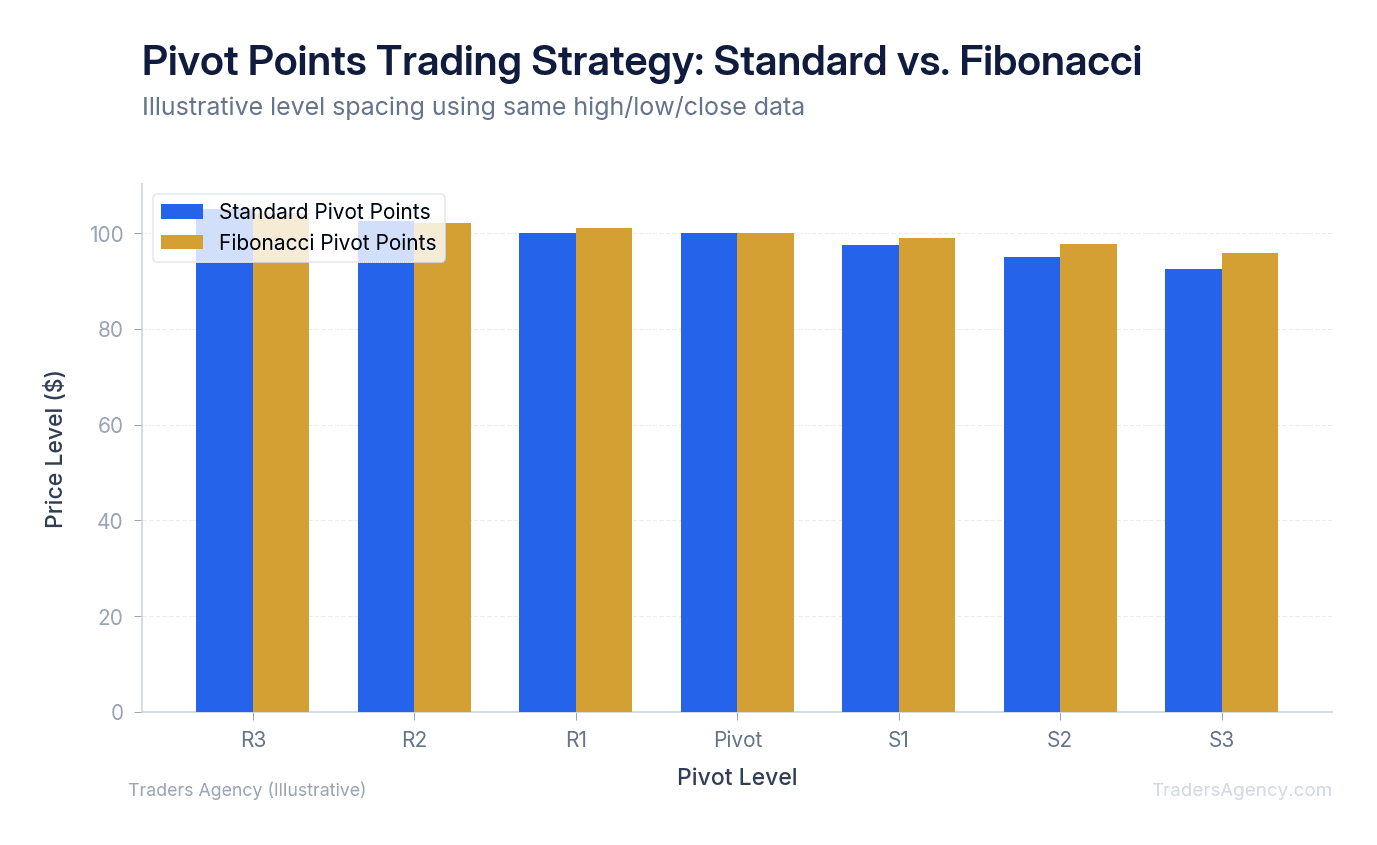
Our team prefers standard pivots for basic stock trading because they represent the original institutional math. However, Fibonacci levels often work exceptionally well in forex and cryptocurrency markets. You can easily test both methods by switching the settings in your charting software.
The choice between the two often comes down to the specific asset you are trading. We suggest applying both to a historical chart of your favorite stock to see which lines the price respects more consistently.
Want expert trading insights delivered daily?
Join thousands of traders who rely on Traders Agency for market analysis and trade ideas.
Join Traders AgencyWhich Pivot Points Are Best for Intraday Trading?
For day trading, standard daily pivot points are the most effective choice because they capture the immediate short-term momentum. You calculate these using the previous single trading day's data, which provides highly relevant support and resistance levels for today's active session.
While daily levels are perfect for day traders, you should also pay attention to weekly and monthly pivot points. A weekly pivot uses the high, low, and close of the entire previous week. A monthly pivot uses the data from the entire previous month.
When a daily pivot lines up perfectly with a weekly pivot, it creates a massive wall of support or resistance. We teach our members to mark these overlapping zones in bright colors on their charts. These overlapping areas often produce the strongest price bounces of the week.
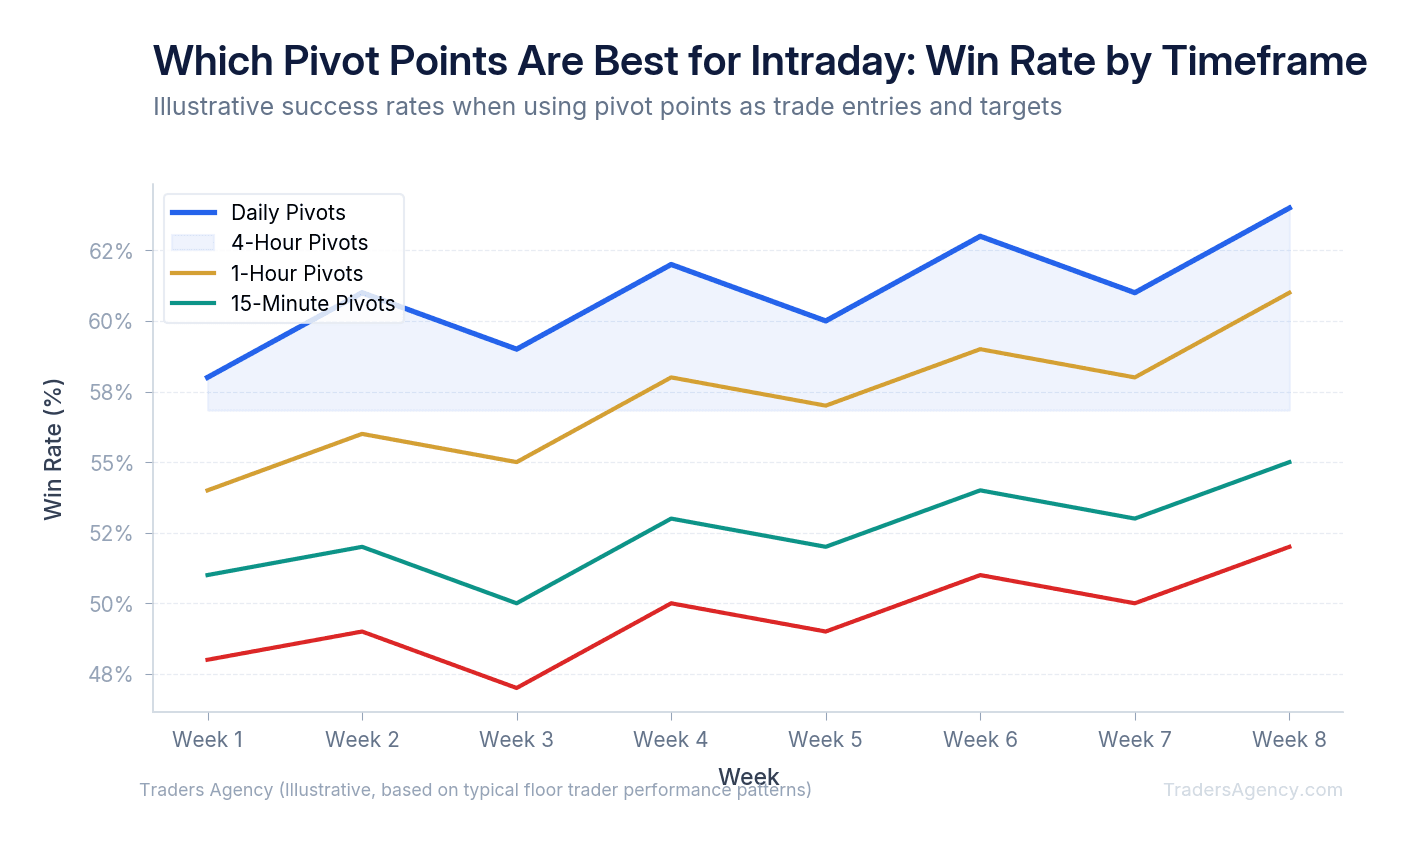
For intraday execution, we prefer to watch the price action on a 5-minute or 15-minute chart. These timeframes filter out the random noise of a 1-minute chart while still getting you into the trade early enough to capture the move.
How to Use Pivot Points for Trade Entries and Targets
Now that you understand the math, here is a practical pivot point trading setup. We will use a real-world scenario on a 5-minute chart to show you exactly how to execute this strategy.
- Identify the Setup: Imagine you are trading Apple (AAPL). Yesterday's price action created a main daily pivot at $170.00. The first support level (S1) sits at $168.50, and the first resistance level (R1) sits at $172.00. The market opens, and AAPL immediately drops from $171.00 down toward the main pivot at $170.00. You are now watching closely for a reaction at this mathematical floor.
- Execute the Trade: We do not buy simply because the price touches the line. Instead, we wait for a bullish candlestick pattern to form right at the $170.00 pivot. Once we see a green hammer candle bounce off $170.00 with high trading volume, we enter a long position at $170.20. We place a strict stop-loss order just below the pivot at $169.70 to protect our capital. Our profit target is the R1 level at $172.00.
- Manage the Outcome: In the best-case scenario, buyers step in at the pivot and the stock rallies straight to our $172.00 target. You exit the trade completely at R1 because resistance levels are where sellers typically step back in. In the worst-case scenario, the stock breaks through the pivot and hits our stop-loss at $169.70, resulting in a small, manageable loss.
| Parameter | Value |
|---|---|
| Stock | AAPL |
| Entry Price | $170.20 |
| Stop-Loss | $169.70 (risk of $0.50/share) |
| Profit Target (R1) | $172.00 (gain of $1.80/share) |
| Risk-to-Reward Ratio | 1:3.6 |
Because we risked $0.50 to make $1.80, this gives us a highly favorable risk-to-reward ratio. That kind of asymmetry is exactly what professional traders look for.
Which Indicators Work Best When Combined with Pivot Points?
Trading based on a single indicator is a fast way to lose money. To increase your win rate, you must combine pivot lines with other technical tools.
When you load pivot point indicators onto your charting platform, you will see horizontal lines across your screen. We prefer to add the Relative Strength Index (RSI) to the exact same chart. This gives us a secondary way to measure market momentum.
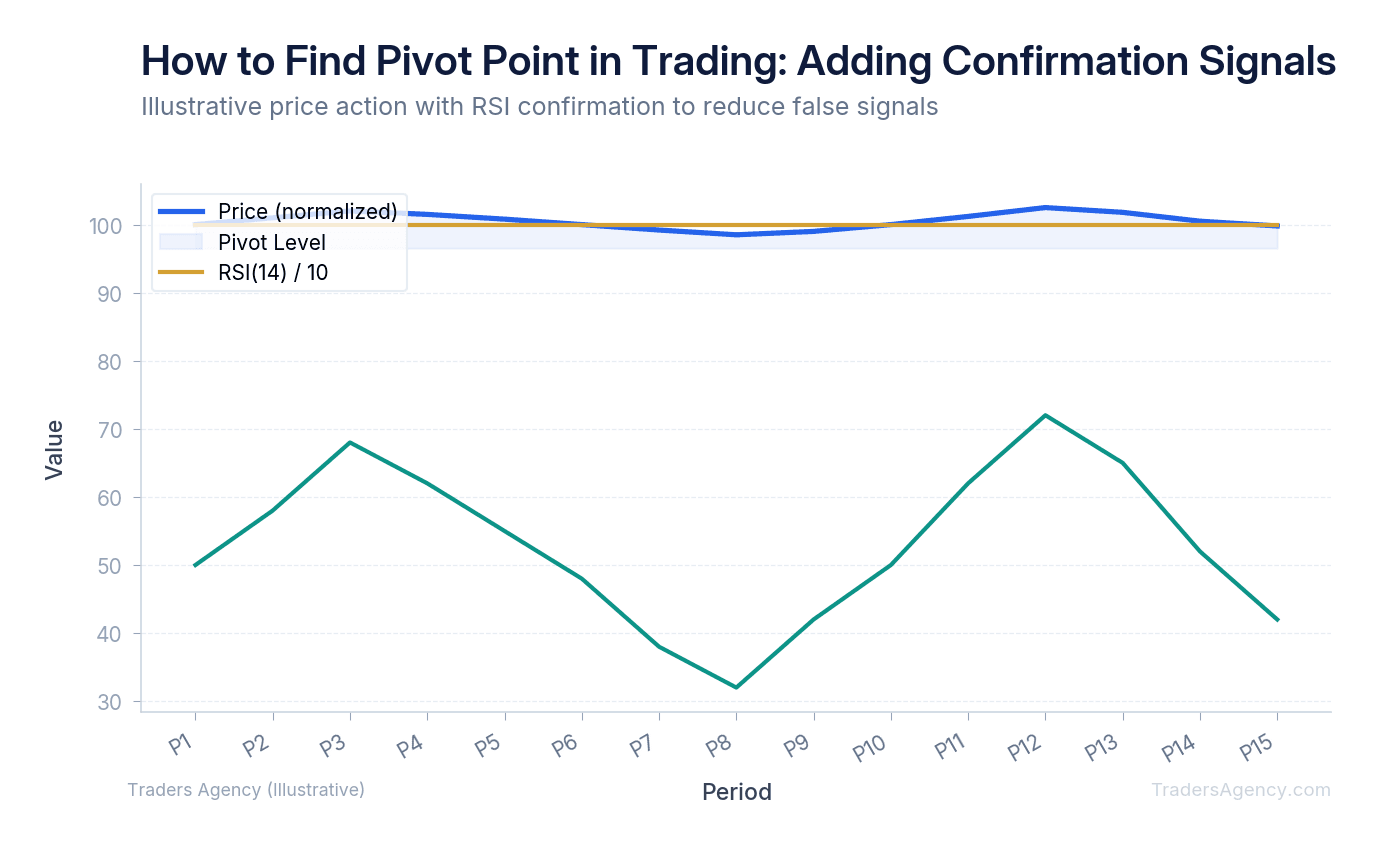
When a stock drops to an S1 support level, we check the RSI. If the RSI reads below 30 (indicating oversold conditions), we have two separate indicators telling us the stock is ready to bounce. This dual confirmation drastically reduces false signals.
You can also use moving averages for confirmation. If the main daily pivot aligns perfectly with a rising 50-period moving average, that specific price level becomes incredibly strong. We call this "indicator confluence" and it is a core part of our trading methodology.
Watch Out: You must apply strict position sizing rules. We recommend risking no more than 1% to 2% of your total account balance on any single pivot trade. Even the best mathematical setups will fail sometimes, and proper risk management keeps you in the game.
Common Mistakes to Avoid When Trading Pivots
Many beginners make the mistake of assuming a pivot point is an unbreakable concrete wall. In reality, these levels are flexible zones. If you place your stop-loss exactly one penny below a support line, normal market volatility will frequently trigger your stop before the stock bounces.
Another common error is ignoring the overall market trend. If the S&P 500 is crashing aggressively, buying a random stock just because it hit an S1 support level is highly dangerous. We always advise our members to trade in the direction of the broader market trend.
Finally, do not clutter your chart with too many lines. If you turn on daily, weekly, and monthly standard pivots alongside Fibonacci levels, your screen will be unreadable. Pick one specific method, apply it to a clean chart, and master how price reacts to those specific zones.
Watch Out: Avoid using pivot points in highly illiquid markets or during major news events. When a company releases a surprising earnings report or the Federal Reserve announces an interest rate change, the stock can blast right through R1, R2, and R3 as if they do not exist.
Are Pivot Points Good for Trading?
Yes. Pivot points are excellent for trading because they provide objective, mathematically derived price levels before the market even opens. They remove emotional guesswork by giving traders exact numbers for entry orders, profit targets, and stop-loss placement across any liquid asset class.
However, they are not a magic solution. Pivot points work best in liquid markets with normal volatility. They give you a structured map for the day, helping you trade with confidence and discipline.
Once you learn how to calculate and apply these floor trader methods, you will look at price charts in a completely new way. The math is simple, the levels are objective, and the edge is real. Our education team publishes new strategy guides and market analysis every week to help you keep sharpening your skills.
Want expert trading insights delivered daily?
Join thousands of traders who rely on Traders Agency for market analysis and trade ideas.
Join Traders AgencyKey Takeaways
- The main pivot point is calculated as the average of the previous day's high, low, and closing price, giving traders an objective central reference level before the market opens.
- Price trading above the pivot point signals bullish sentiment; price trading below it signals bearish sentiment, creating a clear directional bias for the session.
- Standard pivot point formulas project three resistance levels (R1, R2, R3) and three support levels (S1, S2, S3) from that central pivot, giving traders a full map of potential turning points.
- Fibonacci pivot points use Fibonacci ratios instead of fixed multipliers to space the support and resistance levels, which can produce different targets than the standard floor trader method.
- Pivot points work best in liquid markets with normal volatility. They are a structured planning tool, not a guaranteed signal, and are most effective when combined with other indicators for confirmation.
DISCLAIMER: Traders Agency does not offer financial advice. The information provided is for educational purposes only and should not be considered financial advice. Traders Agency is not responsible for any financial losses or consequences resulting from the use of the information provided. Trading carries inherent risks and may not be suitable for all individuals. You are advised to conduct your own research and seek personalized advice before making any investment decisions, recognizing the potential risks and rewards involved.
See more from Traders Agency on Google
Make us a preferred source and our market analysis will appear more prominently in your Google Search, Top Stories, and AI results.
Add to Preferred Sources