

Quantum computing stocks are waking up, and the price action is violent. We're seeing massive single-day rallies across the board in this sector. This is not a random market fluctuation. A specific piece of news just triggered what could be the first day of a massive run for these companies.
If you want to trade these volatile names, you need a precise strategy. You cannot just buy blindly and hope for the best. You need to understand the exact technical setups, the risk management math, and the specific holding periods required to protect your capital.
Here's exactly how to trade this setup.
Why Did Quantum Computing Stocks Explode Today?
The Trigger: Nvidia is releasing some type of new quantum software that apparently makes calculations two and a half times faster and produces three times fewer errors.
That error reduction is the exact metric the market has been waiting for. The big holdup in quantum stocks has always been reliability. What's preventing these companies from having real traction and going commercial grade is that there are simply too many errors in quantum computing, despite the massive performance improvements.
If this Nvidia news is real, and if this software makes a big difference in error reduction, it changes the entire timeline for commercial viability.
This is what many traders refer to as an episodic pivot. A big piece of news that starts a big rally. When a sector-wide problem gets addressed by a major player like Nvidia, the market reprices these assets immediately.
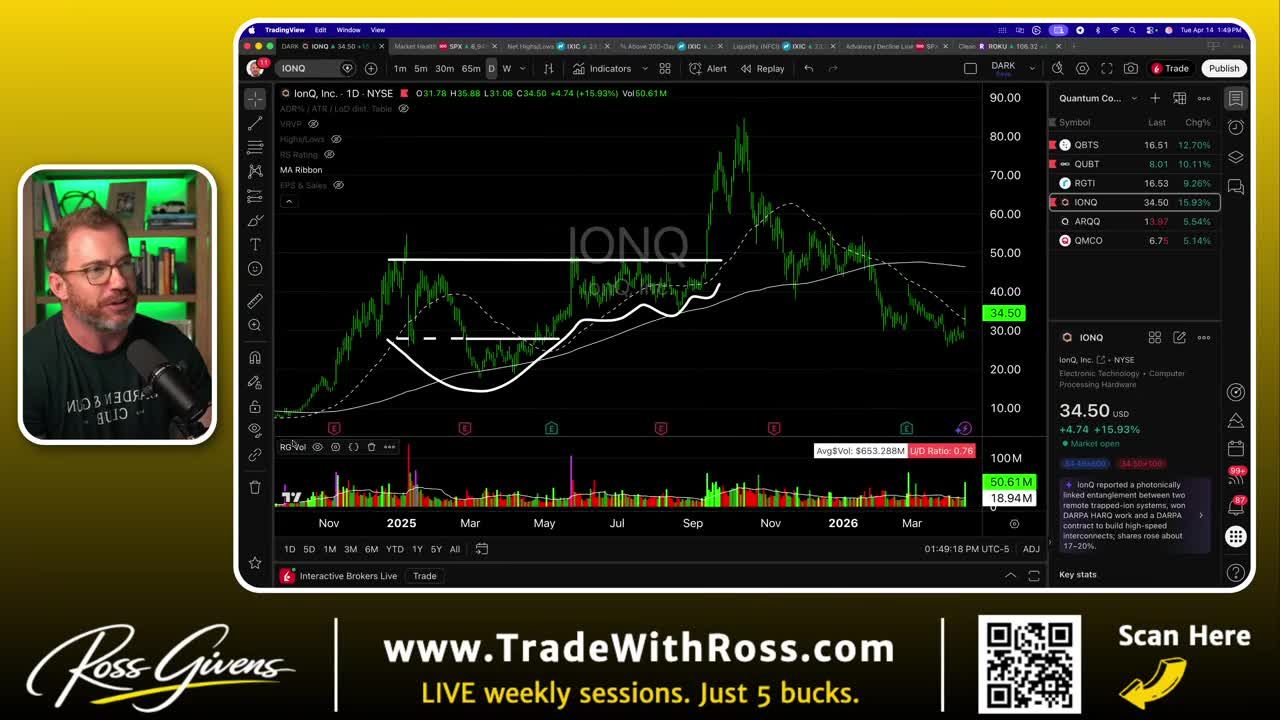
IONQ daily chart showing the explosive prior run to $85, subsequent pullback, and a high-volume gap up, a potential momentum continuation setup.
How Far Have Quantum Stocks Fallen?
To understand the upside potential, you have to look at the whole picture on the daily charts. These stocks have been absolutely blasted.
Take IONQ as the primary example. This is a stock that had a monstrous run in late 2024 and 2025. It was a $20 stock that shot all the way to $85 per share. It was a $67 stock. Since that peak, IONQ is down 60% to 70% off its highs.
All the big quantum computing stocks have experienced the exact same thing.
QBTS (D-Wave Quantum): We bought this back in May and made a nice big lick, but it has been getting killed recently.
QBT: Another name in the group that's been beaten down alongside the rest of the sector.
RGTI (Rigetti): Same story, getting hit hard with the rest of the quantum names.
Today, the daily change is massive. These names are up 10%, 12%, and 15% on the day. When an entire beaten-down sector gaps up on fundamental news, you have to pay attention.
Trading the Gap-and-Run Setup
A gap-and-run happens when a stock closes at one price, opens significantly higher the next morning, and just keeps pushing. A stock closes yesterday at $14.50, opens at $15.25, and runs to $17.00.
If I'm trading a daily chart setup like this, my standard approach is simple. Buy the stock and put my stop loss at the low of the day. If this is in fact the start of a new strong trend higher, the stock should not get back below the low of the day. These things can move fast, and a break below the daily low invalidates the setup.
But if you really want to dial in tight and maximize your position size, you have to drop down to the shorter timeframes.
1. Drop to the 5-Minute or 1-Minute Chart
I look at the 5-minute chart, and sometimes even the 1-minute chart, to find my entry. After a big move, we want to see the stock consolidate.
2. Wait for Supply Absorption
When a stock goes from $29 to $36 in a couple of hours, it needs to take a breath. It needs to absorb that supply. It pulls back, comes in, and compresses.
3. Identify the Breakout Pattern
This compression creates a textbook breakout pattern. I look for this pattern on a daily chart, but for this specific trade, I'm using the 1-minute chart to get a surgical entry.
Get an entire year of live weekly trading sessions and level up your investing chops.
Join my Black Ops Trading Club
The IONQ Trade Execution
I wanted to take a big position. I entered a long position of 1,000 shares of IONQ at $34.53. Ideally, the buy would have been slightly lower at $34.35 right as the breakout started. I was on the phone with my CPA at the time and entered slightly late, but the setup was still valid.
Why does getting such a precise entry matter? It all comes down to the math of risk management.
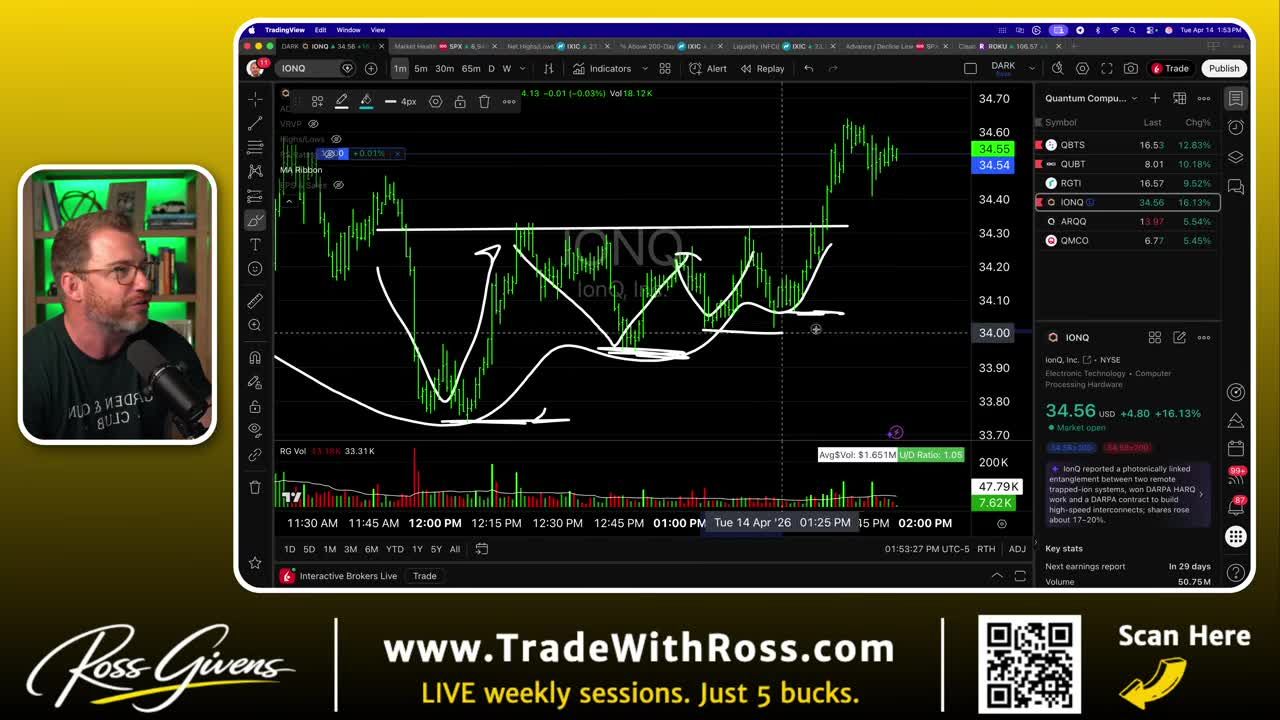
IONQ intraday chart with annotated swing lows helping define a tight stop-loss at $34.00.
If I buy the daily chart breakout and place my stop loss at the low of the day, I'm risking 10% to 11% on the trade. That's a massive percentage risk, which forces me to take a much smaller position size.
If I trade this super tight on the 1-minute chart, my stop loss goes right at the recent swing low. Even buying it late at $34.53, my risk is only about 1.5%.
Are my odds of the trade working out super high with a stop that tight? No. But because I'm only risking about 1.5%, I can take a much bigger trade.
The Math: 1,000 shares at $34.53 = just over $34,000. Stop loss at $34.00. Total risk: approximately $500, or roughly 1.5%.
My stop loss sits just beneath the last swing low at $34.00. Every time the stock pulls back, buyers step in and push it up. It should not go below that $34.00 level. I put a sell stop order in for those 1,000 shares at $34.00 and leave it as a day order.
How Should You Manage Risk When Trading Quantum Stocks on Day One?
I do not want $34,000 of a quantum computing stock sitting in my account overnight on the first day of a rally. If the whole move gets erased by tomorrow morning, I'm going to take a big lick.
My goal is simple. If this stock breaks out and continues to run to the close, I want to trim the position down so I'm not holding the full size overnight.
If this was a natural compression and the stock pushes back up, I could see a 2% to 3% move into the close.
On 1,000 shares, that's a profit of $1,000 to $1,500.
Once I hit that target, I sell half or two-thirds of the position. This gets the trade down to a smaller size and locks in a gain. I can then put a stop loss way down at the low of the day on the remaining shares.
This creates a free look trade. I've taken a short-term profit on a large portion of the position to completely cover the risk on the rest of the position.
How the IONQ Trade Played Out
At 1:55 p.m. Central time, the stock started to run. The market closes at 3:00 p.m. Central, giving me just over an hour to see this thesis play out. My initial target was the last area the stock found acceptance, the $35.00 to $35.12 range.
By 2:23 p.m., the stock had pushed cleanly out of the consolidation zone and rallied to around $35.25.
At this point, the initial risk on the trade was about $500. The open profit was now $700. There is absolutely no sense in risking $500 when you're up $700. You must protect your capital.
Choking Off the Trade
I immediately brought my stop loss up beneath the new swing low. At that point, my risk was almost nothing. A whopping 14 cents on 1,000 shares, or about $140.
As the stock continued to run, I wanted to start peeling the position down. It's nice having a big move, but it's just too much risk to take 1,000 shares overnight.
I canceled my original stop loss and put a new sell stop in for 500 shares at $35.20.
Why $35.20? I'm just trying to ride the momentum. What you typically see with these stocks is a pattern: they consolidate and run, consolidate and run, consolidate and run. The stock is going to take breaths along the way. Each time it breaks through and runs higher, I raise my stop to the new low. I'm continuously choking this thing off.
If it falls 20 cents and tags me out of half the position, I'm perfectly fine with that. If it runs to $36.00 or $37.00 into the close, I'll ride that too.
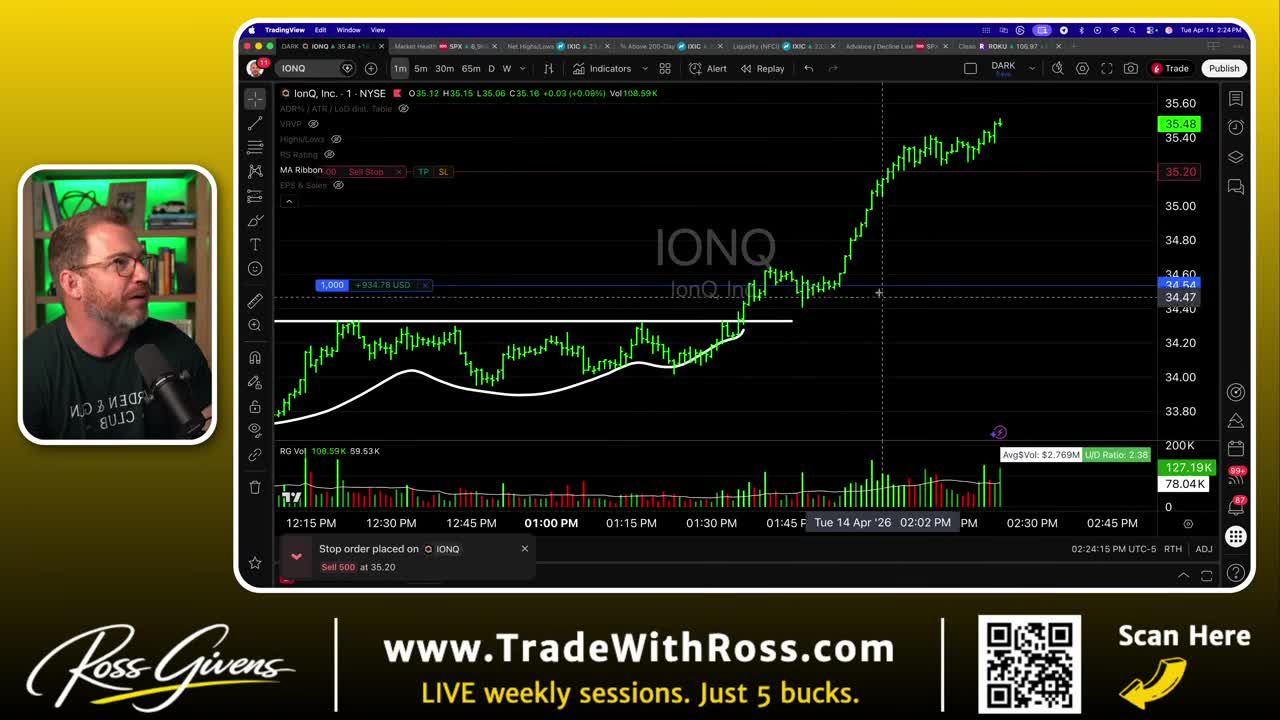
Actively selling IONQ in increments as the stock spikes higher, with a stop sell order placed at $35.20.
Scaling Out for Profit
With about 20 minutes left until the close, the stock hit $35.50. I was trying to get the open profit to an even $1,000, and it literally hit $999 before it started pulling back.
Instead of waiting, I started peeling shares off at market price. I sold in increments of 100 shares at a time. The stock was up almost 3% from my entry in just 48 minutes.
The stop eventually triggered on a pullback, taking me out of another chunk. This got my position down to exactly 300 shares, which is exactly where I wanted to be for an overnight hold.
Position Update: Started with 1,000 shares. Took 700 shares off for a profit. Now holding just 300 shares of IONQ from an average entry of $34.50.
Is This a New Quantum Computing Stocks Rally?
Now that the day trade portion is secured and profitable, we step back to the daily chart to manage the remaining 300 shares.
This is where the episodic pivot thesis truly gets tested. I place a Good Till Cancelled stop loss on these final 300 shares right at $31.00, which is the low of the day. This is my longer-term position.
If this is in fact the start of a big move, the upside targets are massive.
The stock should run at least back up into the $50.00 to $55.00 range. That's about a 45% upside. It could potentially push back up into the $70s, which would be a double from today's price.
Risk/Reward on the Runner: If the stock fails and hits the $31.00 stop, I lose about $200. If it runs to $50-$55, I'm up roughly $5,000. That's a risk-reward ratio of about 1:25.
That is an extremely strong setup, and it all started by risking just $500 out of the gate on a highly finessed 1-minute chart entry.
The Bottom Line
The Nvidia software news is the exact type of fundamental shift that can ignite a beaten-down sector. When you combine a 60% to 70% drawdown from the highs with a massive single-day gap and run, the conditions are perfect for aggressive trading.
You must manage your risk tightly when trading quantum computing stocks. Do not hold massive positions overnight on day one. Use the shorter timeframes to secure your entry, scale out to lock in profits, and leave a runner with a wide stop to capture the potential massive upside.
If IONQ and the rest of the quantum sector can hold these daily lows, we could be looking at the start of a big run back toward previous highs.
Get an entire year of live weekly trading sessions and level up your investing chops.
Join my Black Ops Trading Club
Related Reading
Key Takeaways
Nvidia released quantum software claiming 2.5x faster calculations and 3x fewer errors, directly addressing the error-rate problem that has blocked commercial viability for quantum computing companies.
The sector was already down 60% to 70% from its highs before this catalyst hit, meaning the gap-and-run setup combines a deeply oversold base with a high-impact news trigger.
IONQ is the primary trade focus, with the daily low on the breakout day serving as the key risk level. Holding above that low is the condition required to stay in the trade.
The recommended execution strategy involves scaling out of the position to lock in profits while leaving a runner with a wide stop, rather than holding a full position overnight on day one.
This qualifies as an episodic pivot, a sector-wide catalyst from a major player like Nvidia that forces the market to reprice the entire group, not just a single stock.
DISCLAIMER: Traders Agency does not offer financial advice. The information provided is for educational purposes only and should not be considered financial advice. Traders Agency is not responsible for any financial losses or consequences resulting from the use of the information provided. Trading carries inherent risks and may not be suitable for all individuals. You are advised to conduct your own research and seek personalized advice before making any investment decisions, recognizing the potential risks and rewards involved.
See more from Traders Agency on Google
Make us a preferred source and our market analysis will appear more prominently in your Google Search, Top Stories, and AI results.
Add to Preferred Sources