The stock market just flashed another vix buy signal, and this one historically has been 89% accurate.
What we've seen in a very short window of time is the fear premium disappearing from the market. And when we look beneath the surface, everything looks strong right now.
What Is the VIX Buy Signal?
Bottom Line: The combination of a historically rare VIX collapse, expanding market breadth, and loosening financial conditions is pointing in the same direction: higher stock prices. This setup has resolved bullishly 89% of the time since 1990, and the current data shows no meaningful divergence from that historical pattern. The fear premium has left the market, and the weight of evidence favors the bulls.
The volatility index, also known as the VIX, is a great indicator for how scared investors are. It measures how volatile the stock market is right now. Big sell-offs from things like COVID, the 2022 inflation, or last year's trade war cause the VIX to spike higher.
When things are calm and markets are steadily marching up, the VIX gets very low.
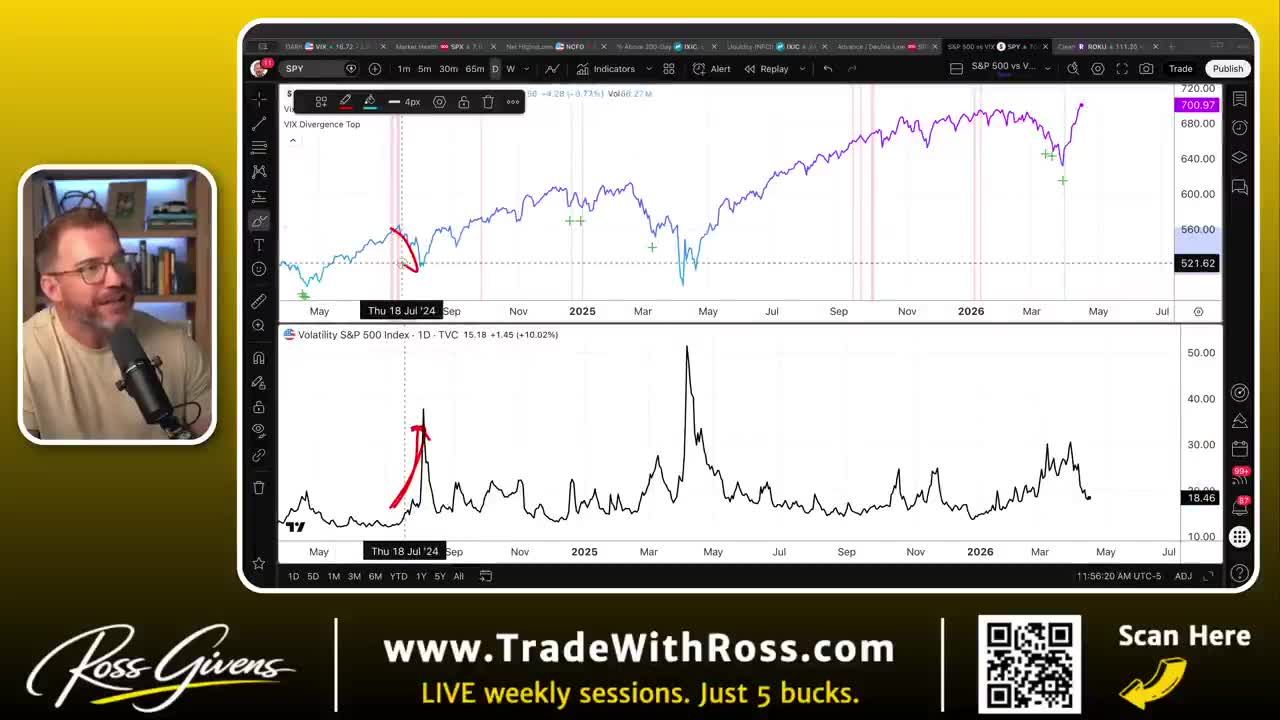
Comparing the S&P 500 index with the VIX, every spike in volatility coincides with a sell-off in the market. The trade war in early 2025 caused markets to dump very heavily and the VIX spiked back higher. Each one of these little dips is met with a spike in the VIX.
But over the last two weeks, the VIX has absolutely collapsed.
For 35 years, this has been one of the most reliable market buy signals there is.
How Accurate Is the VIX Buy Signal Historically?
The forward returns for the stock market following extreme VIX crashes are incredibly strong.
Looking at the last 20 VIX crashes, the market has been higher one year later in all but two instances. That gives this signal an 89% historical accuracy rate. The average gain over that 12-month period: 17.2%.
Two, three, and five years later, the numbers are even better.
Only twice has the market not been higher 12 months later. Both were at the start of the 2022 bear market, back when the Fed massively raised interest rates to fight record inflation.
Every time we get a big weekly spike in the VIX following seemingly negative news, that spike has historically marked the low of the market. We saw it in 2025. We saw it following COVID. We saw it at the end of 2022. Every time, that was in fact the low.
Money Is Flowing to Risk
When investors are scared and expect a pullback, they go to safe areas. The money flows into consumer staples, things like Johnson and Johnson.
That is not what's happening right now.
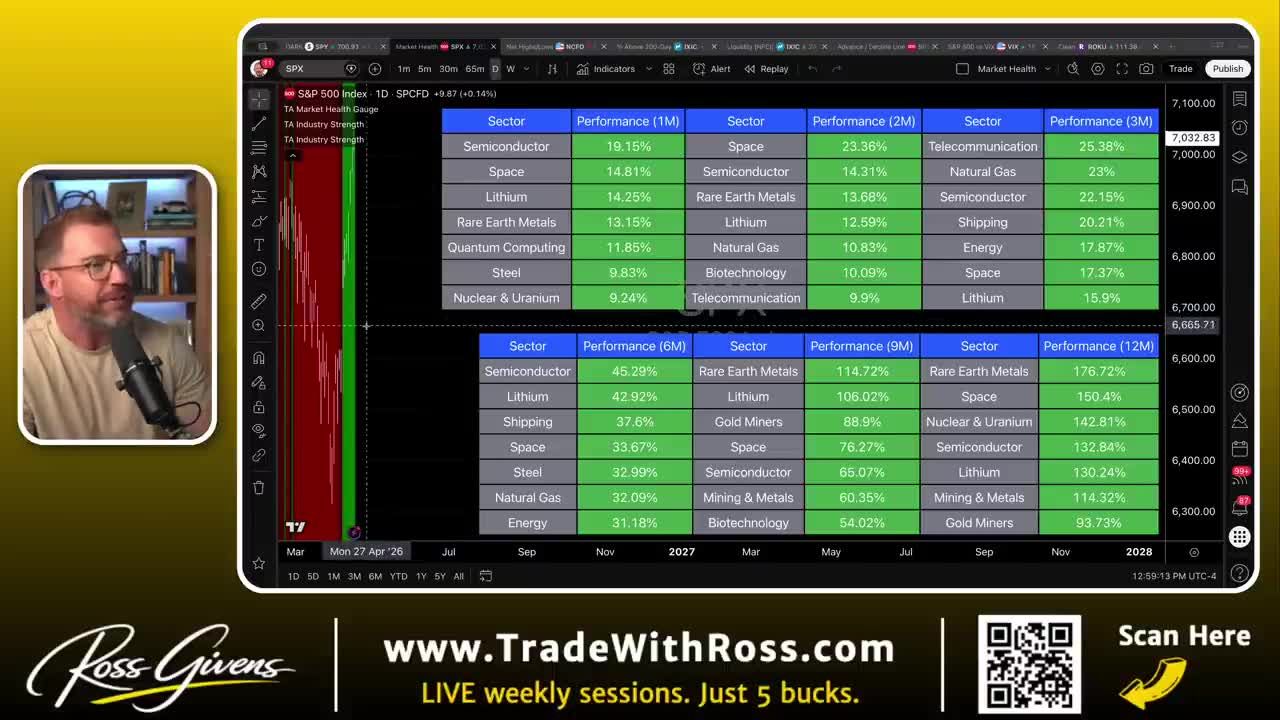
The industry strength indicator shows money going to risk areas: semiconductors, space stocks, quantum computing, and rare earths.
Get an entire year of live weekly mentoring sessions, my newsletter, indicators, bonus reports, tons more. Click the link and I'll see you in the next live session.
Join my Black Ops Trading ClubWhich Breadth Indicators Are Confirming the VIX Buy Signal?
The vix buy signal is very strong on its own. But when we look beneath the surface, everything else looks strong right now too.
1. Net New Highs Expanding
The net highs and lows indicator shows how many stocks made a new 52-week high that day compared to how many made a new 52-week low. It just gives you a net reading.
Yesterday, 136 stocks in the NASDAQ made a new 52-week high. Only 17 made a new low. That leaves a net reading of 119.
When this reading is green, that's what you should see in a healthy market. Pockets of red have been when we get pullbacks. But once we rip back to green, and we're currently on our 10th day in a row of net new highs, that confirms this thing is likely done on the downside.
2. NASDAQ Stocks Above the 200-Day Moving Average
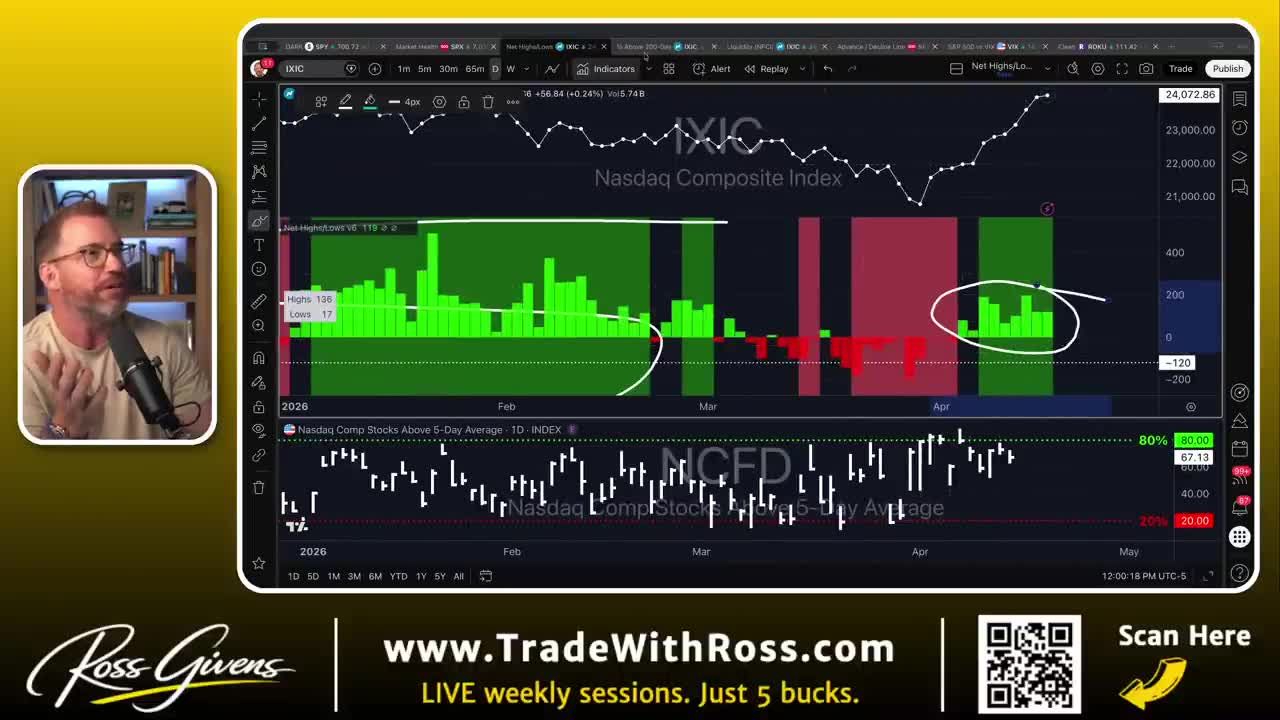
This indicator tracks the percentage of NASDAQ stocks above their 200-day moving average. In a healthy market pushing higher, it generally stays in the 50% to 70% range. Below 50% is trouble.
3. The Advance/Decline Breakout
This is one of my absolute favorites. The advance/decline line simply measures how many stocks went up today versus how many went down. I don't care if a stock went up 10 cents or $10 a share. Did it go up, or did it go down?
If 2,000 stocks go up and 500 go down, the net reading is plus 1,500. That adds to the previous day and creates a running line. It is a very good indicator of strength or weakness hiding beneath the surface.
The question is whether the advance/decline line is stronger or weaker than the overall market.
Right now, we are seeing exactly what we want to see. The advance/decline line broke into new highs on April 8th, a full week before the indexes made a new high. The market is even stronger than we realized.
Financial Conditions Are Loosening
The National Financial Conditions Index (NFCI) measures how tight financial conditions are. The NFCI and the NASDAQ tend to have a one-to-one inverse relationship.
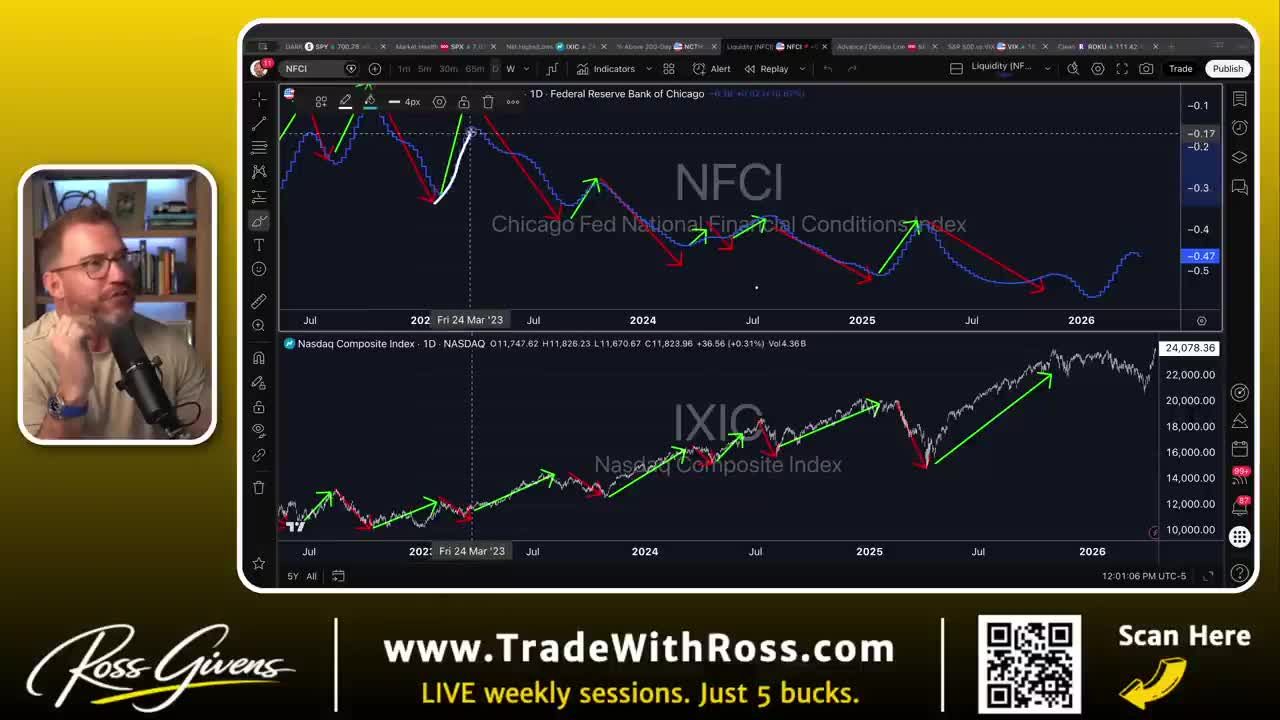
When the NFCI is rising, financial conditions are tightening. Markets usually pull back. When it is falling, conditions are loosening. More money flowing. Easier to borrow and go on margin. Stocks typically rise.
For the first time since early 2025, we saw the NFCI tighten. That lines perfectly with the market pullback.
But in the last two weeks, we are finally starting to loosen again.
When This Signal Fails
A vix buy signal only fails when the underlying market breadth is secretly deteriorating. If the major indexes are grinding higher but the advance/decline line is falling, the market is dangerously weak beneath the surface.
We saw this exact bearish divergence leading into the 2022 bear market. At the end of 2021, the index was grinding higher. But the advance/decline line was not. The divergence was telling you to be careful. Things were actually weak beneath the surface.
The market was just being held up by Google, Amazon, Tesla, and Netflix. It wasn't real. That divergence would have warned you about the 2022 bear market where stocks came down hard.
Today, we have the exact opposite setup. The advance/decline line is making new highs before the stock market. That same bullish setup appeared back in April. The advance/decline line was making new highs long before the index. What followed was a big bull market.
The Fear Premium Is Gone
The data is clear. The vix buy signal is flashing. Market breadth is expanding. Financial conditions are loosening.
Everything I'm seeing says stocks go higher from here.
Anything can happen. If a nuclear bomb drops on top of the New York Stock Exchange on Monday, yes, we're probably going to go down. But do with this what you will. The historical accuracy speaks for itself.
Get an entire year of live weekly mentoring sessions, my newsletter, indicators, bonus reports, tons more. Click the link and I'll see you in the next live session.
Key Takeaways
- The VIX dropped from above 30 at the end of March to 18 in just 14 days, a 40% collapse that ranks as the seventh most extreme volatility crash since 1990.
- This specific VIX buy signal has an 89% win rate going back to 1990, making it one of the most historically reliable market indicators over the past 35 years.
- Market breadth indicators, including the advance-decline line, are confirming the signal by making new highs ahead of the broader index, a pattern that has preceded sustained bull markets.
- Financial conditions are loosening alongside the VIX collapse, adding a second layer of confirmation that risk appetite is returning to the market.
- Every major VIX spike since 1990, including COVID, the 2022 inflation selloff, and the 2025 trade war, has eventually resolved with strong forward returns following an extreme volatility collapse.
DISCLAIMER: Traders Agency does not offer financial advice. The information provided is for educational purposes only and should not be considered financial advice. Traders Agency is not responsible for any financial losses or consequences resulting from the use of the information provided. Trading carries inherent risks and may not be suitable for all individuals. You are advised to conduct your own research and seek personalized advice before making any investment decisions, recognizing the potential risks and rewards involved.
See more from Traders Agency on Google
Make us a preferred source and our market analysis will appear more prominently in your Google Search, Top Stories, and AI results.
Add to Preferred Sources