
An options chain is a digital matrix that lists all available options contracts for a specific stock, index, or exchange-traded fund. Learning how to read options chain data is the first step every trader must take before executing an options trade. You've probably opened your brokerage account, clicked on the options tab, and felt completely overwhelmed by the wall of numbers. We're going to change that right now.
We'll walk you through exactly what these numbers mean and how to use them to find high-probability trades. The layout might look like a complicated spreadsheet, but it's actually a highly organized menu of trading opportunities. Our team recommends treating this screen as your primary research tool.
By the end of this guide, you'll understand how to filter this data to plan your trades with confidence. You'll know exactly where to look to find the safest and most liquid contracts, and you'll understand how to avoid the common traps that cost beginners money.
What Is an Options Chain?
Bottom Line: An options chain is not a wall of noise. It is a structured data set that tells you what contracts exist, what they cost, and how actively they trade. Once you can identify the key columns and filter for liquidity, you have everything you need to evaluate a trade before you risk a single dollar. The skill compounds quickly: the more chains you read, the faster the numbers become instinct.
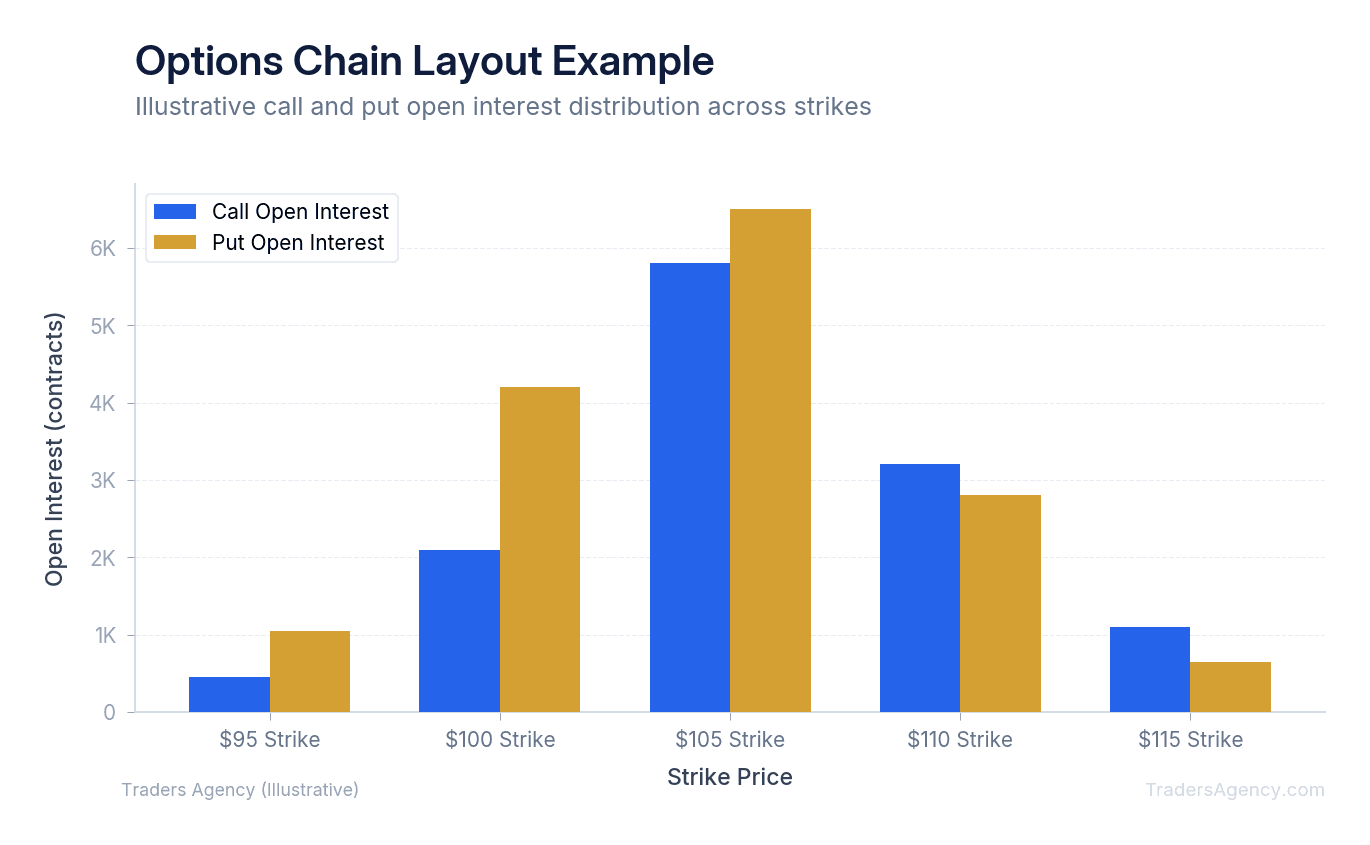
An options chain tells you every available call and put contract for a given underlying asset, organized by expiration date and strike price. It provides real-time pricing, volume, and volatility metrics so traders can evaluate potential setups before risking their capital.
Think of it like a menu at a restaurant. Instead of food, you're looking at different contracts you can buy or sell. The standard call and put options layout splits the screen right down the middle.
You'll find call options on the left side of the screen and put options on the right side. The center column usually displays the strike price, which acts as the dividing line between the two sides.
When you first open the chain, you'll see a list of dates. These are the expiration dates. You must click on a specific date to reveal the drop-down list of available strike prices for that specific timeframe. Every single date has its own unique set of contracts and pricing.
Key Concept: An options chain is organized by expiration date first, then by strike price. Calls appear on the left, puts appear on the right, and the strike price column runs down the center.
What Is the Difference Between Calls and Puts on an Options Chain?
Call options give the buyer the right to buy shares at the strike price, while put options give the buyer the right to sell shares at the strike price. The chain displays both simultaneously so traders can compare market sentiment at a glance.
Our team recommends focusing on one side at a time when you're just starting out. If you expect a stock to go up, you look at the calls on the left. If you expect the stock to go down, you look at the puts on the right. Mixing them up is a common beginner error that can result in placing a trade in the wrong direction.
You'll also notice different background colors on the chain. Brokerages use shading to show in-the-money vs. out-of-the-money contracts.
For calls, contracts with strike prices below the current stock price are shaded because they hold intrinsic value. For puts, contracts with strike prices above the current stock price are shaded. Out-of-the-money contracts typically have a white or unshaded background.
Understanding this visual coloring helps you quickly identify which contracts already have real value built into their price. Out-of-the-money contracts are cheaper, but they require the stock to make a larger move before expiration to become profitable.
What Do the Columns on an Options Chain Mean?
When you open a platform like Thinkorswim or Webull, you'll see several columns of data. You can customize these columns, but we prefer to keep the standard layout for simplicity. Here's what each major column means for your daily trading.
Strike Price: This is the target price at which the option contract can be exercised. If Apple (AAPL) is trading at $150, you might look at the $155 strike price for a bullish trade. The strike price determines your probability of success.
Bid and Ask: The bid is the highest price a buyer is willing to pay. The ask is the lowest price a seller is willing to accept. You buy at the ask and sell at the bid. The difference between these two numbers is the spread.
Volume: This shows how many contracts have traded hands during the current trading session. High volume means high interest from other traders. Volume resets to zero at the opening bell every single morning.
Implied Volatility (IV): Implied volatility reflects the market's expectation of future price movement over the life of the option, expressed as an annualized percentage. Higher IV means the market expects large price swings, which makes the option premium more expensive.
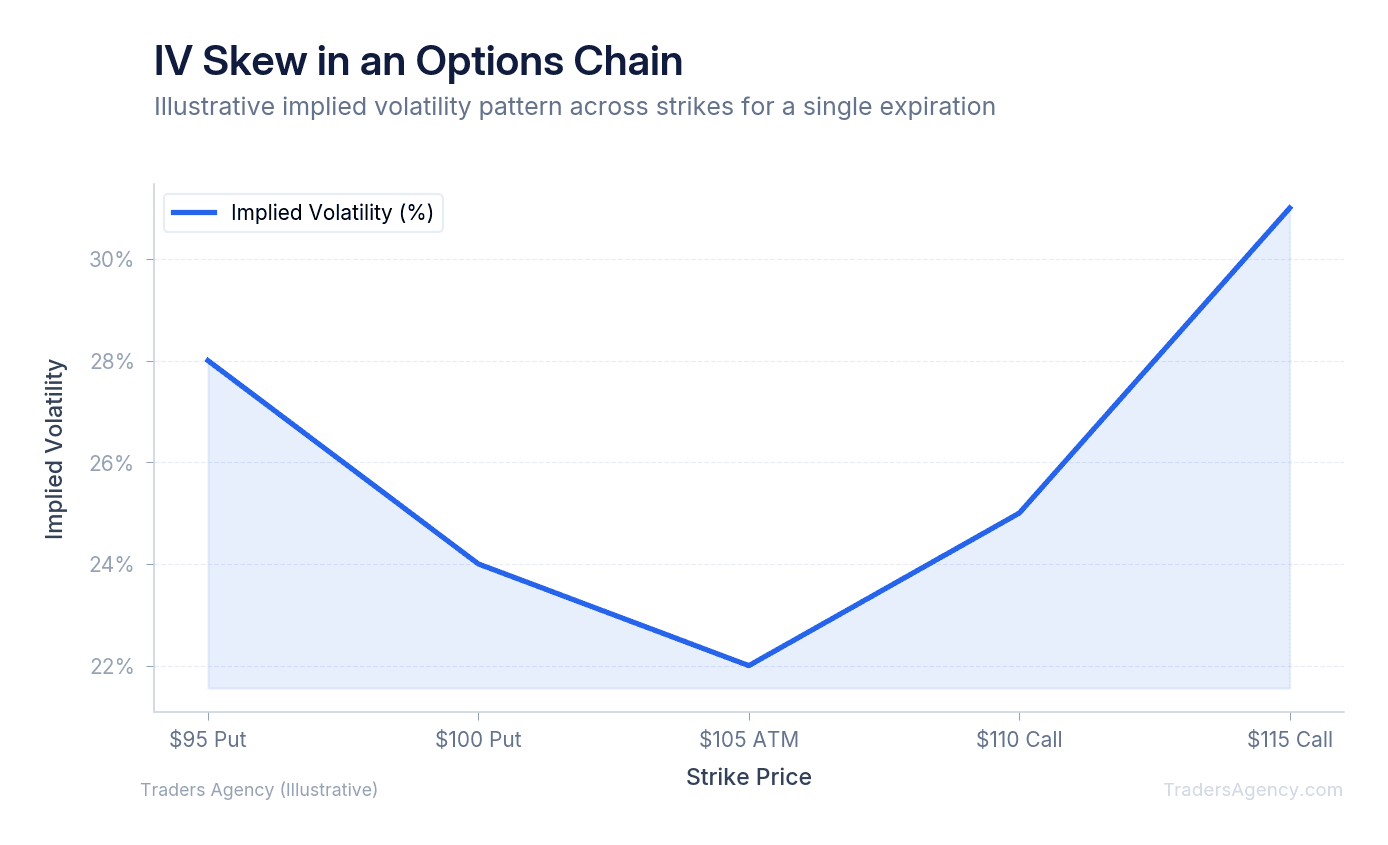
If a stock has an upcoming earnings report, the implied volatility will spike. We teach our members to monitor this column to avoid overpaying for options. Buying options when implied volatility is low is generally much safer because you're not paying a premium for anticipated chaos.
| Column | What It Tells You | What to Look For |
|---|---|---|
| Strike Price | Exercise price of the contract | Near current stock price for higher probability |
| Bid/Ask | Current market pricing | Tight spread (under $0.10 is ideal) |
| Volume | Today's trading activity | Higher is better for liquidity |
| Open Interest | Total outstanding contracts | At least 100+ for safe entry/exit |
| Implied Volatility | Expected future price movement | Lower IV = cheaper premiums |
What Is Open Interest and Why Does It Matter?
Open interest represents the total number of active, outstanding contracts that have not yet been settled or closed. Unlike volume, which resets to zero every morning, open interest carries over from day to day and shows the true liquidity of a specific strike.
We teach our members to use open interest as a confirmation tool for market trends. If you see a massive cluster of open interest at a specific strike price, that level often acts as support or resistance. Large blocks of open interest act like magnets for the stock price.
Institutional traders leave footprints in the open interest column. When we spot unusual options activity, like 10,000 new contracts opening at a strike price that usually sees only 100 contracts, it signals that large funds are placing directional bets.
Tracking open interest helps retail traders gauge institutional sentiment. High open interest means money is locked into that specific price level, giving you confidence that you can easily enter and exit your position. You can learn more about how options markets function through the Cboe Options Exchange educational resources.
Key Concept: Open interest shows the total number of active contracts at a given strike. High open interest means strong liquidity and often signals price levels where institutional money is concentrated.
Want expert trading insights delivered daily?
Join thousands of traders who rely on Traders Agency for market analysis and trade ideas.
Join Traders AgencyHow Do You Identify Liquid Options to Trade?
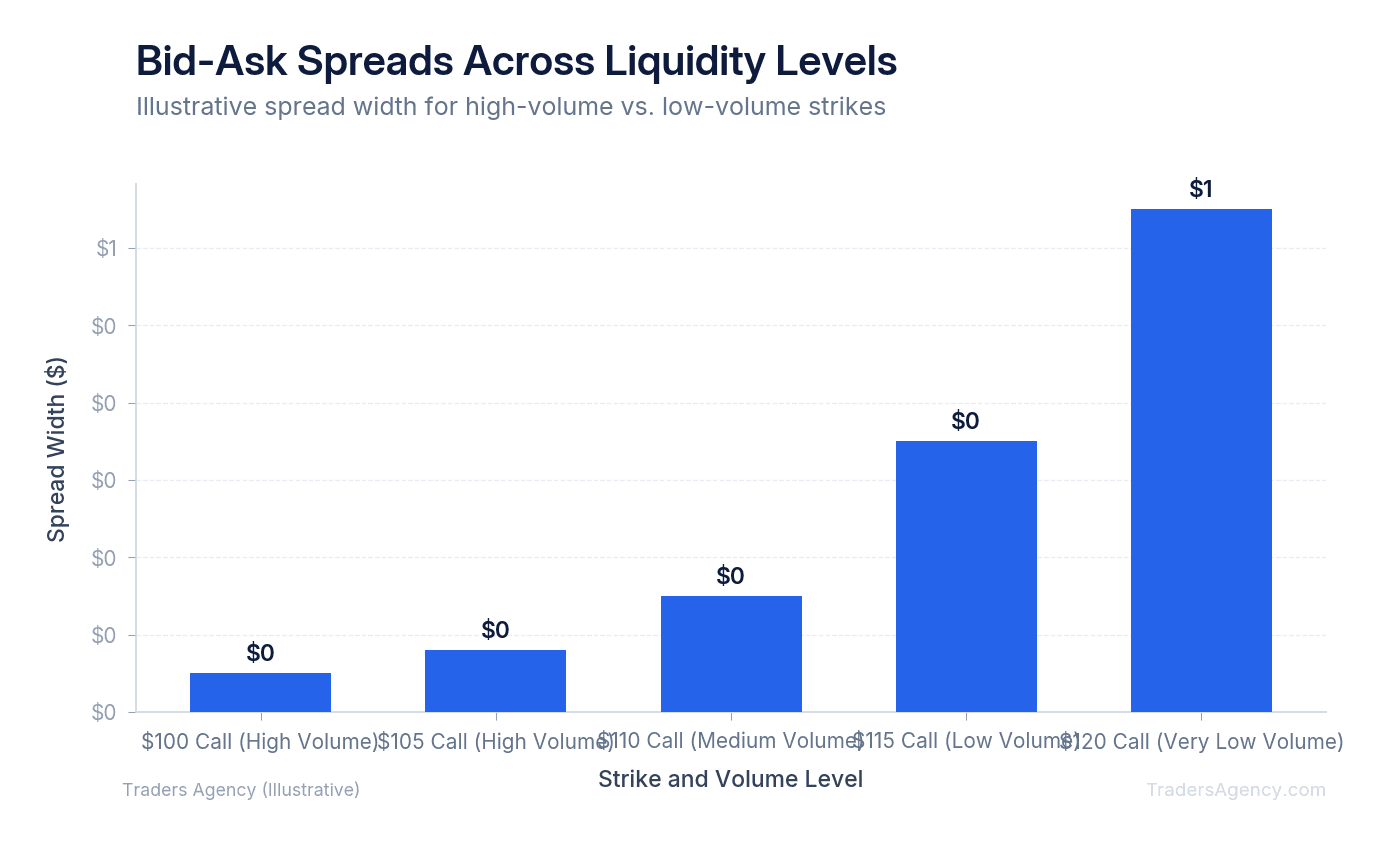
You find liquid options by looking for contracts with high daily volume, large open interest, and a narrow bid-ask spread. Liquid options allow you to enter and exit trades instantly without giving up profits to poor pricing.
The bid-ask spread is your best indicator of liquidity. If an option has a bid of $1.00 and an ask of $1.05, the spread is only five cents. This is a highly liquid contract.
If the bid is $1.00 and the ask is $1.50, the spread is fifty cents. We avoid wide spreads because you immediately lose money to the spread the second you enter the trade.
We recommend trading options on highly liquid stocks or ETFs like the SPY to ensure tight spreads. Trading illiquid options is a common beginner mistake that leads to instant losses upon execution, as you're forced to pay a terrible price just to get into the trade.
Watch Out: A wide bid-ask spread (over $0.20) means you lose money the instant you enter the trade. Always check the spread before clicking "buy." Stick to liquid names like SPY, AAPL, and MSFT when starting out.
How Do You Use an Options Chain to Plan a Trade?
Now that you know the terminology, we'll walk you through a practical example. Imagine Microsoft (MSFT) is trading at $400 per share. You believe the stock will rise to $415 over the next month. Here's how you execute that idea using the chain.
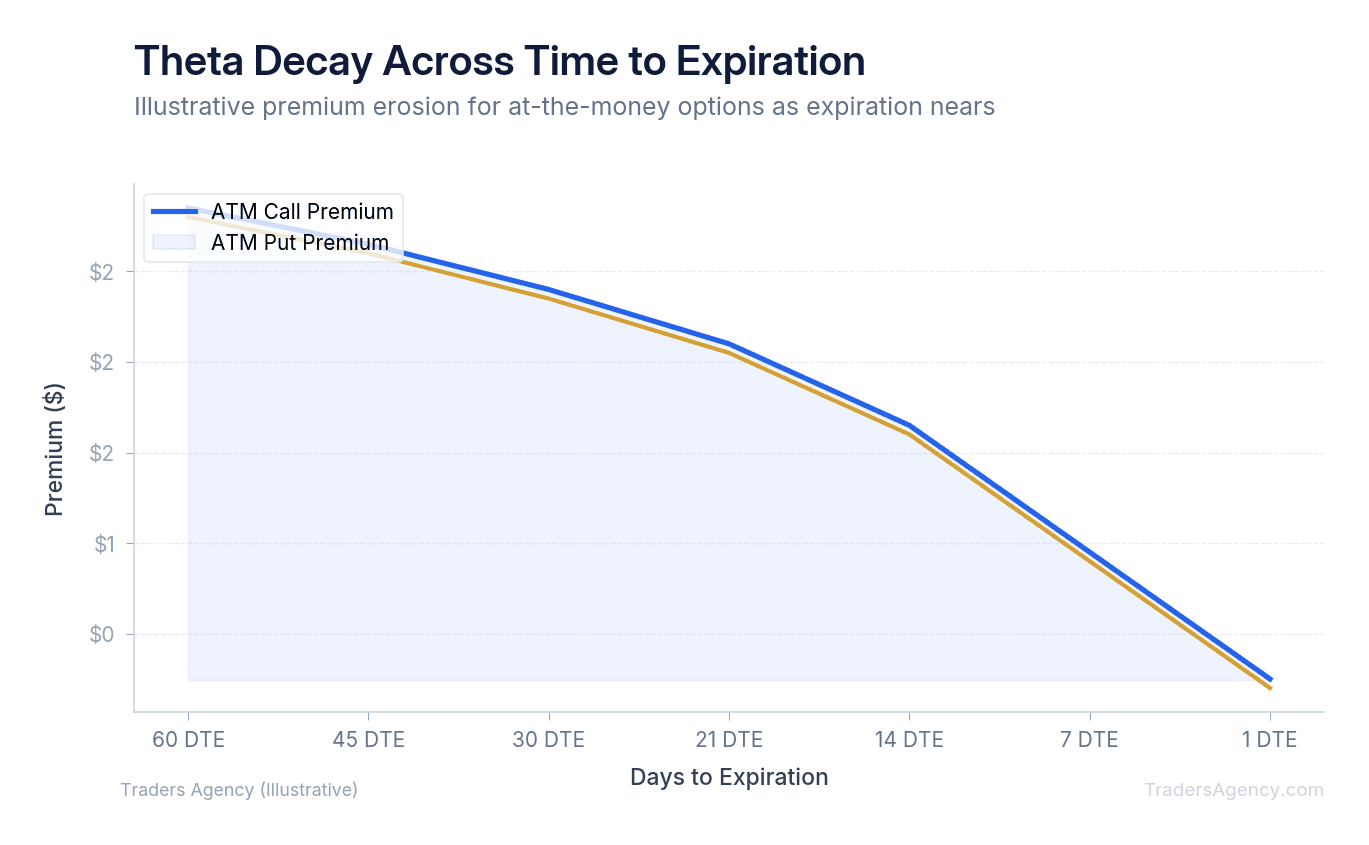
- Select the Options Expiration Date: The chain groups contracts by date at the very top of the screen. We prefer to buy at least 30 to 45 days of time until expiration. This gives the stock enough time to make the expected move without time decay eating away your premium too quickly. For this trade, you select an expiration date 40 days out.
- Choose the Strike Price: You look at the call options on the left side of the screen because you expect the price to go up. Scroll down to find the $410 strike price. This contract is slightly out of the money, meaning it will be cheaper than an in-the-money contract, but still close enough to the current price to have a high probability of success.
- Verify Volume and Open Interest: Before placing the order, check the liquidity columns. You see the $410 call has a daily volume of 2,500 contracts and an open interest of 12,000. These numbers confirm the contract is highly liquid. You won't have any trouble entering or exiting this position.
- Check the Bid-Ask Spread and Execute: The bid is $4.90 and the ask is $5.00. The spread is tight, just ten cents wide. You place a limit order to buy one contract at $5.00. Since each contract represents 100 shares, your total maximum risk is $500. If the stock drops, you cannot lose more than this initial investment.
| Parameter | Value |
|---|---|
| Stock | MSFT at $400 |
| Contract | $410 Call, 40 days to expiration |
| Entry Price | $5.00 per contract ($500 total) |
| Volume | 2,500 contracts |
| Open Interest | 12,000 contracts |
| Bid-Ask Spread | $0.10 (tight, liquid) |
| Max Risk | $500 (premium paid) |
Platform Differences and Risk Management
Learning how to read options chain data requires adapting to your specific brokerage platform. While the core data remains the same, the visual presentation varies across different brokers.
Robinhood uses a simplified, mobile-first interface that hides many advanced columns by default. You have to manually tap the settings icon to see open interest and implied volatility.
Thinkorswim provides a massive, customizable grid favored by professional traders. You can display dozens of columns at once, though this can be visually overwhelming for beginners.
Webull offers a middle ground with clean charts and easy-to-read column headers. We suggest clicking through the settings on your chosen platform to ensure volume, open interest, and implied volatility are always visible on your main screen.
Regardless of your platform, you must practice strict risk management. Here are the rules we teach our members to follow:
- Never allocate more than 2% to 5% of your total account to a single options trade. If you have a $10,000 account, your maximum risk per trade should be $200 to $500.
- Always use limit orders instead of market orders to control your exact entry price.
- Avoid buying options right before a major earnings report to prevent overpaying for inflated implied volatility.
- Close your position before the expiration date to avoid the risks of automatic assignment or exercise.
Risk Warning: Options trading carries significant risk. You can lose your entire premium if the stock does not move in your direction by the expiration date. Always define your maximum loss before entering any trade, and never risk money you cannot afford to lose.
By understanding the data in front of you, you can avoid illiquid contracts and plan trades that align with your specific risk tolerance. The chain is no longer a confusing wall of numbers. It's a clear map of your trading opportunities.
Our education team publishes new strategy guides and market analysis every week. The more time you spend reading options chains, the faster these numbers become second nature. Start with liquid, well-known stocks, practice reading the columns we've outlined here, and build your confidence one trade at a time.
Want expert trading insights delivered daily?
Join thousands of traders who rely on Traders Agency for market analysis and trade ideas.
Join Traders AgencyKey Takeaways
- An options chain organizes every available call and put contract for a single underlying asset by expiration date and strike price, giving you real-time pricing, volume, and volatility data in one place.
- The chain splits into two sides: calls on one side, puts on the other, with the strike price column running down the center as your reference point.
- Volume and open interest columns reveal liquidity. Low numbers in either column signal contracts that are harder to exit and carry wider bid-ask spreads that eat into your profit.
- Reading implied volatility (IV) from the chain lets you gauge whether options are priced expensively or cheaply relative to historical norms, which directly affects your strategy selection.
- Starting with liquid, well-known stocks when practicing is the fastest way to build pattern recognition, because the data is cleaner and the spreads are tighter.
DISCLAIMER: Traders Agency does not offer financial advice. The information provided is for educational purposes only and should not be considered financial advice. Traders Agency is not responsible for any financial losses or consequences resulting from the use of the information provided. Trading carries inherent risks and may not be suitable for all individuals. You are advised to conduct your own research and seek personalized advice before making any investment decisions, recognizing the potential risks and rewards involved.
See more from Traders Agency on Google
Make us a preferred source and our market analysis will appear more prominently in your Google Search, Top Stories, and AI results.
Add to Preferred Sources