
A short squeeze is a rapid increase in a stock's price triggered by short sellers rushing to buy back shares to limit their losses. When you see a GameStop short squeeze explained video or article, you're looking at the ultimate historical example of this market mechanic in action. We've built this guide to show you exactly how these explosive moves happen, how to spot them before they fire, and how to tell the difference between a genuine setup and a social media trap.
You've probably watched a stock skyrocket 400% in a matter of days and wondered how a company with terrible financials could suddenly become the most talked-about asset on Wall Street. The answer lies in market structure rather than company fundamentals.
We'll walk you through the exact data points that create these explosive moves. By the end of this guide, you'll know how to read short interest ratios, calculate days to cover, and identify whether a squeeze setup is real or manufactured hype.
What Are Short Squeeze Mechanics and Why Do They Matter?
Bottom Line: Short squeezes are a product of market structure, not company fundamentals. The GameStop episode is the clearest modern example of how forced covering creates a self-reinforcing price spiral that has nothing to do with business value. Traders who understand short interest ratios, days-to-cover, and strict position sizing can engage with these setups deliberately rather than reactively.
Short squeeze mechanics are the specific market conditions that force traders who bet against a stock to buy shares at rapidly rising prices. They matter because this forced buying loop creates artificial demand, pushing the stock price far beyond its fundamental value and generating extreme volatility for active traders.
To understand this process, we need to look at how short selling works. A trader borrows shares from a broker and sells them on the open market. They hope to buy those shares back later at a lower price, return them to the broker, and pocket the difference.
If the stock price rises instead, those short sellers start losing money. When the price hits a certain threshold, brokers issue margin calls. The short sellers must either deposit more cash into their accounts or buy shares immediately to close their positions.
This sudden surge of buying pressure pushes the price even higher. That upward movement traps more short sellers in a vicious cycle. The combination of high short interest and sudden upward price momentum transforms a regular rally into a violent squeeze.
Key Concept: A short squeeze occurs when rising prices force short sellers to buy back shares, which creates additional buying pressure, which pushes prices even higher. It's a self-reinforcing feedback loop driven by market structure, not fundamentals.
What Made the GameStop Short Squeeze Happen? A Case Study in Forced Covering
We teach our members that historical context is the best way to understand market structure. The 2021 GameStop event provides the perfect template for how these metrics align to create an explosive move.
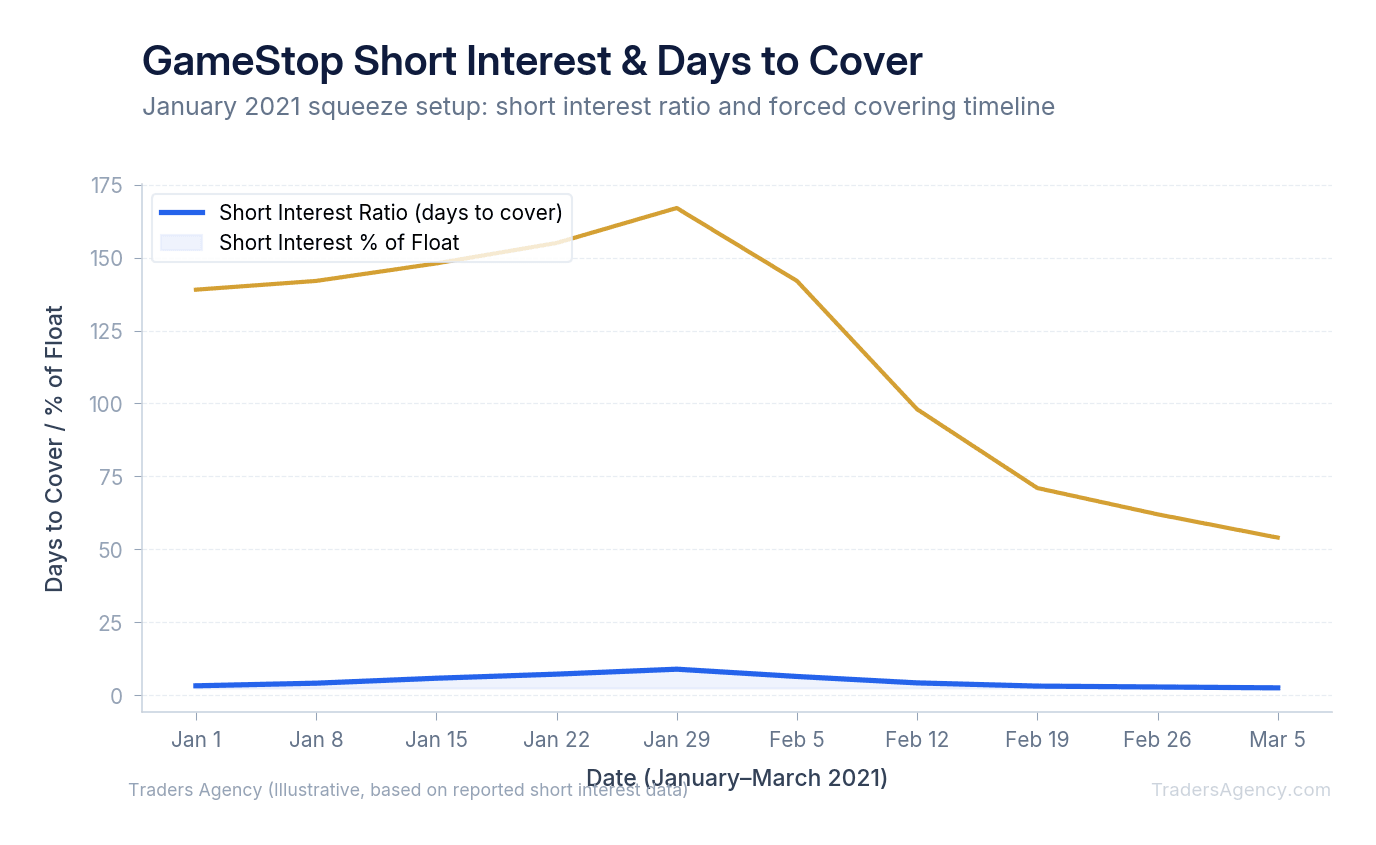
In January 2021, GameStop (GME) had a massive short float percentage of over 140%. This meant hedge funds had shorted more shares than actually existed in the tradable public float. Retail traders noticed this extreme vulnerability and began buying shares aggressively.
To truly grasp the GameStop short squeeze explained mechanics, we have to look at the options market. Retail traders didn't just buy shares. They bought massive amounts of out-of-the-money call options.
This options volume forced market makers to hedge their risk by purchasing actual shares of GME. As the stock price moved from $20 to $40, short sellers started taking heavy losses. The combination of retail buying, market maker hedging, and initial short covering created an unstoppable wave of demand.
Within days, the stock price exploded past $300 per share. The institutional short sellers were trapped. They were forced to buy back shares at any price available just to stop the bleeding.
| Phase | Price Range | Primary Driver |
|---|---|---|
| Initial Accumulation | $4 - $20 | Retail buying based on short interest data |
| Gamma Squeeze | $20 - $80 | Market maker hedging of call options |
| Full Short Squeeze | $80 - $483 | Forced covering by institutional short sellers |
| Collapse | $483 - $40 | Buying restrictions and profit-taking |
How Do You Identify Key Setup Indicators?
You identify a short squeeze before it happens by tracking three primary metrics: short interest as a percentage of the float, the days to cover ratio, and the cost to borrow rate. When all three of these indicators reach extreme highs simultaneously, the stock becomes highly vulnerable to a squeeze.
Here are the specific numbers our team monitors when evaluating a potential setup:
1. Short Interest Percentage
This metric tells you how many tradable shares are currently sold short. We look for a short interest ratio above 20%. Anything above 30% indicates extreme crowding on the short side, meaning a large number of traders will need to buy the stock eventually.
2. Days to Cover
This calculation divides the total shorted shares by the stock's average daily trading volume. It estimates how many trading days it would take all short sellers to close their positions based on typical volume levels. We look for a days to cover ratio of 5 or higher.
3. Cost to Borrow
When a stock is heavily shorted, shares become hard to borrow. Brokers charge a fee to lend them out. A normal borrow fee is around 1% to 3% annually.
When the cost to borrow spikes to 20%, 50%, or even 100%, it signals that short sellers are paying massive premiums just to hold their positions. This daily financial bleeding forces them to close out at the first sign of upward price movement.
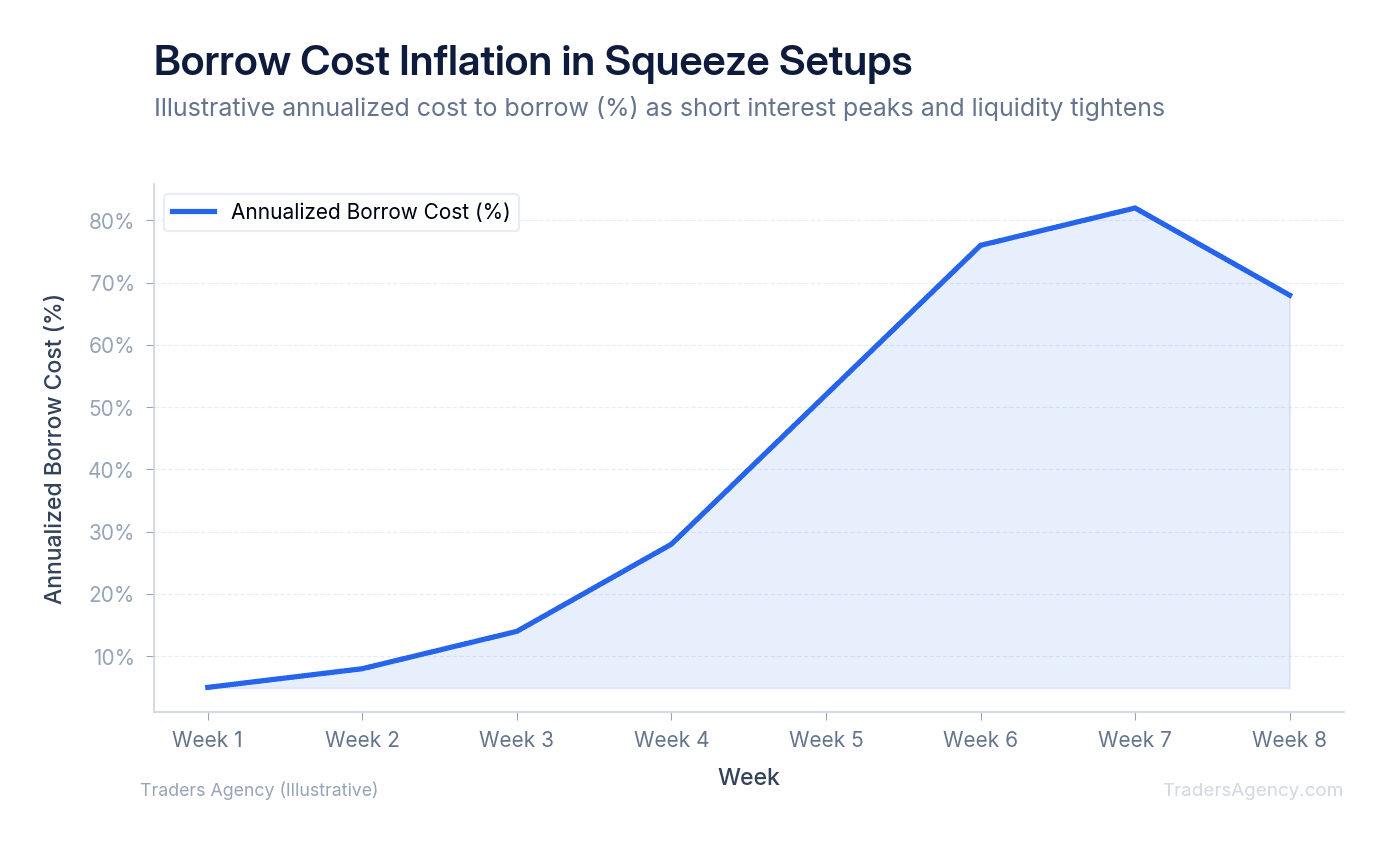
Key Concept: The "squeeze trifecta" is short interest above 20%, days to cover above 5, and cost to borrow rising exponentially. All three conditions must be present simultaneously for a high-probability setup.
How Forced Covering Creates a Self-Reinforcing Price Spiral
The actual explosion in price happens mechanically. It has nothing to do with company earnings or long-term growth prospects. It's pure supply and demand.
Imagine a stock with 10 million shares shorted and an average daily volume of only 1 million shares. If positive news hits the wire, regular buyers step in. The price ticks up 5%.
The short sellers who entered at lower prices hit their maximum risk limits. Their brokers automatically execute market buy orders to close the short positions and protect the brokerage from default risk.
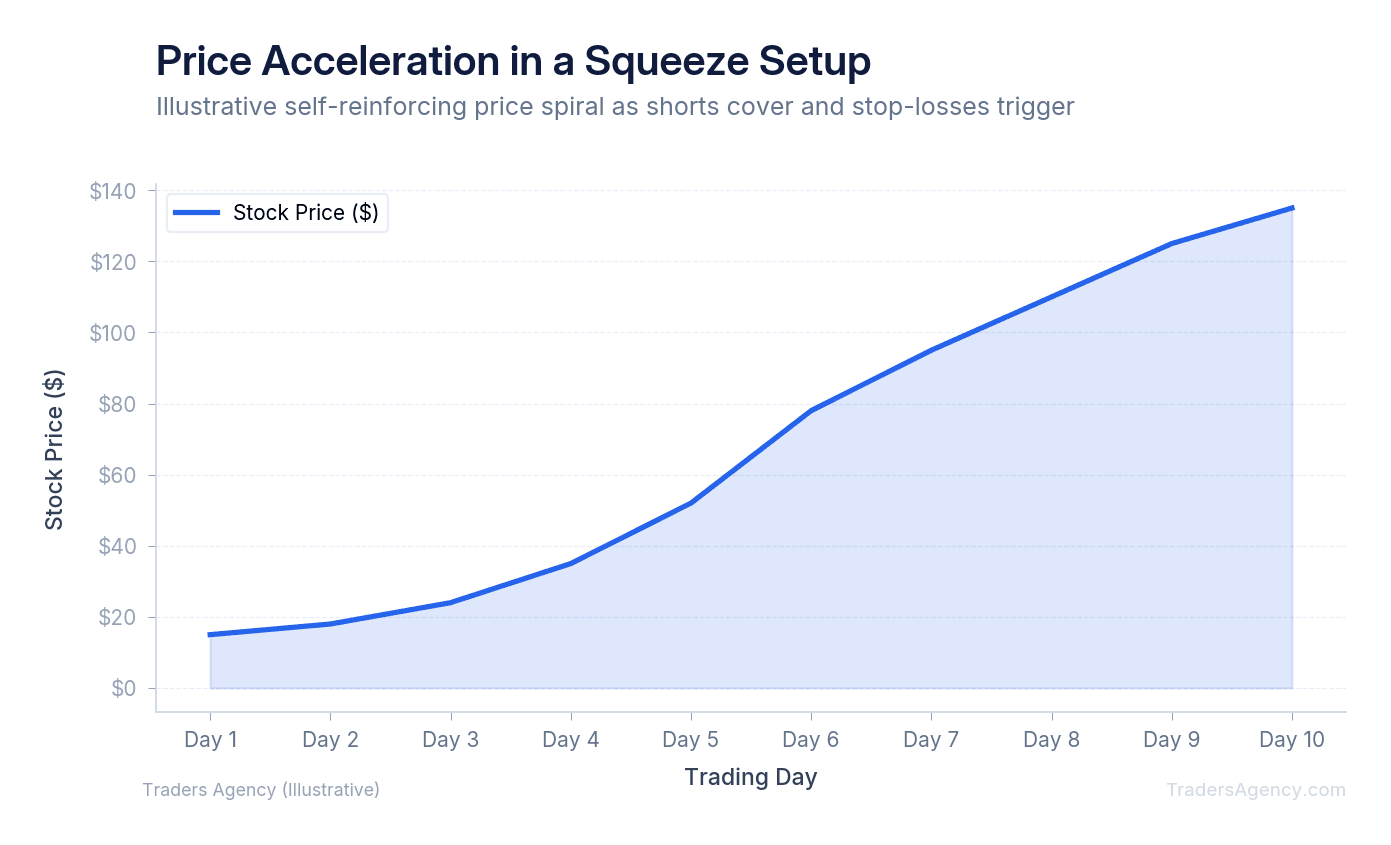
This forced buying eats up all the available sell orders on the order book. Because supply is limited, the price jumps another 10%. Now, a second group of short sellers hits their margin limits.
Their brokers issue more market buy orders. The cycle repeats, accelerating upward until the short interest is finally flushed out of the market.
Want expert trading insights delivered daily?
Join thousands of traders who rely on Traders Agency for market analysis and trade ideas.
Join Traders AgencyWhy Do Most Predicted Short Squeezes Fail?
Most predicted short squeezes fail because they lack the necessary buying volume to trigger the initial margin calls. Without a massive influx of new capital to force the stock price higher, short sellers can comfortably hold their positions or gradually cover them without causing a price spike.
Since 2021, we've seen hundreds of heavily shorted stocks promoted on social media. The vast majority of these setups collapse, leaving retail buyers with heavy losses. Many traders search for the next big runner by studying GameStop short squeeze explained tutorials, but they miss the underlying data that made 2021 unique.
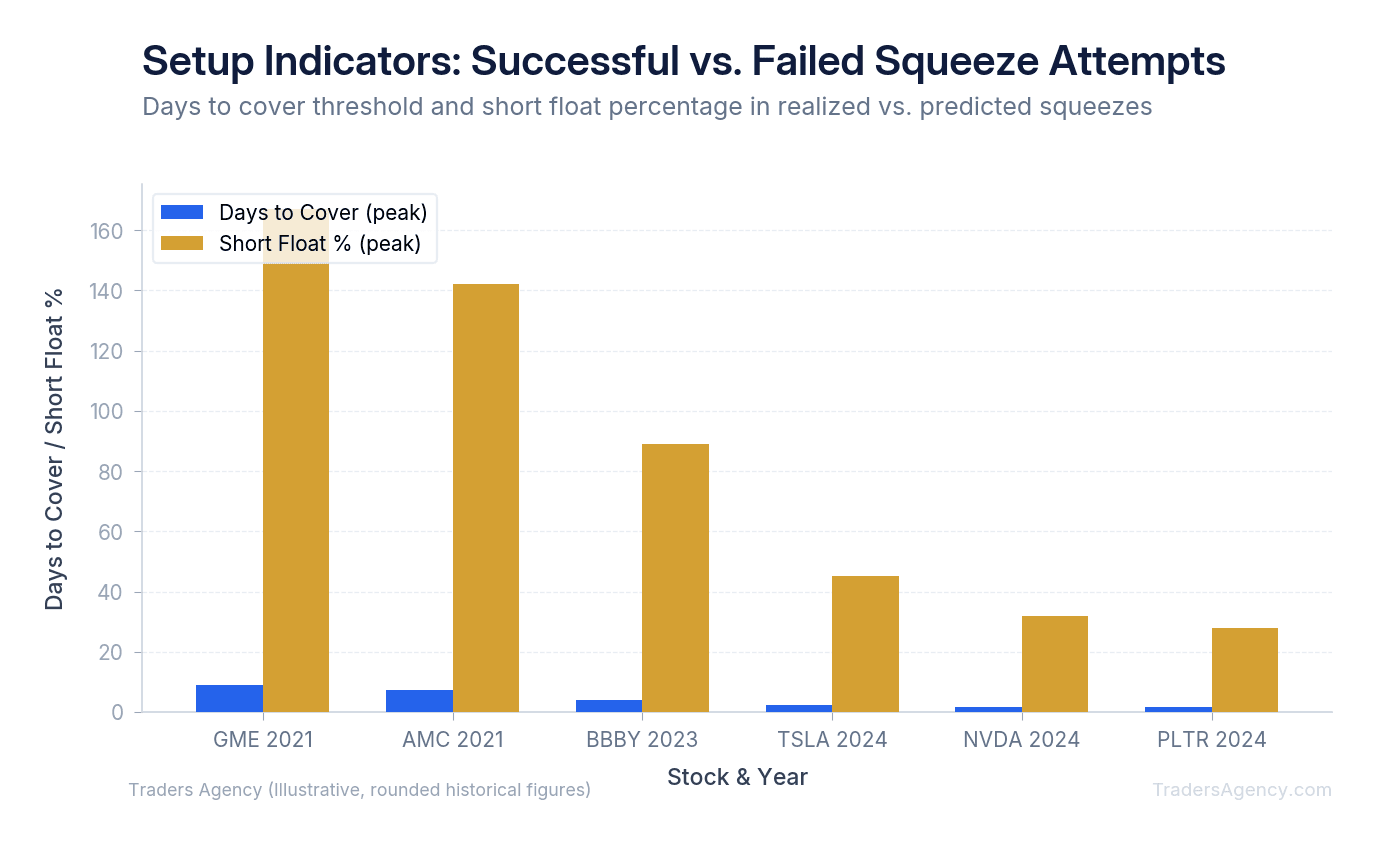
The market dynamics have changed significantly. Institutional short sellers learned expensive lessons from the GameStop event. They now use more sophisticated hedging strategies and rarely allow their exposure to reach 100% of the float.
Additionally, many heavily shorted companies use sudden retail buying interest to issue new shares. This dilution instantly increases the available supply of shares. Short sellers can then buy these newly printed shares to cover their positions easily, killing the squeeze entirely.
Watch Out: Share dilution is the squeeze killer. If a company announces a new stock offering while the price is spiking, the added supply gives short sellers an easy exit. Always check for recent SEC filings related to shelf offerings before entering a squeeze trade. You can review company filings at the SEC EDGAR database.
How Do You Tell a Genuine Short Squeeze Setup from Manufactured Hype?
Our education team teaches traders to separate mathematical realities from internet hype. You cannot trade based on forum posts or social media trends alone.
A genuine setup requires specific structural advantages. You need a low float stock, high institutional ownership, and a legitimate trigger event that brings in organic buying volume.
Here is the exact checklist our team uses to evaluate a potential squeeze:
- Float Size: Is the tradable float under 50 million shares? Smaller floats move faster because supply dries up quickly.
- Options Chain: Is there heavy call option volume? Market makers hedging these calls can accelerate the upward move. You can verify open interest data at the CBOE.
- Borrow Fees: Is the cost to borrow rising exponentially on a daily basis?
- Trigger Event: Is there an actual earnings beat, new product announcement, or buyout rumor driving the initial volume?
Manufactured setups usually feature a dying company with massive debt, a high float, and no fundamental reason for the stock to rise. If the options volume is dead and no institutional money is participating, the squeeze is likely fake.
When Should You Stay Out of a Short Squeeze Trade?
Trading a short squeeze is essentially playing a game of musical chairs. When the music stops, the price collapses just as fast as it rose. You must approach these trades with extreme caution.
We prefer to trade these setups with strict mathematical risk parameters. Here's our step-by-step approach to managing squeeze trades:
- Size Your Position Correctly: Never risk more than 1% to 2% of your total account capital on a single squeeze play. If you have a $10,000 account, your maximum risk on a squeeze trade should be $100 to $200.
- Set Hard Stop Losses: If you buy a stock at $15 hoping for a squeeze to $50, you need to know exactly where you'll exit if the setup fails. We typically place our stops just below the nearest major support level on the daily chart.
- Don't Chase Extended Moves: Do not buy after a stock has already spiked 100% in a single day. The risk-to-reward ratio becomes completely skewed against you at that point. If you miss the initial breakout, let the trade go and wait for the next setup.
- Take Profits Aggressively: You'll rarely catch the exact top of a squeeze. Selling half your position after a 50% gain ensures you walk away with capital, even if the buying pressure suddenly dies and the stock reverses.
Risk Warning: Short squeeze trades are among the highest-risk setups in the market. Prices can reverse 50% or more in minutes once the squeeze exhausts itself. Never trade these setups with money you cannot afford to lose, and always have your exit plan defined before you enter.
| Risk Parameter | Our Guideline |
|---|---|
| Max Position Size | 1-2% of total account |
| Stop Loss Placement | Below nearest daily support level |
| Profit Target (First Half) | 50% gain from entry |
| Chase Threshold | Do not enter after 100%+ single-day move |
| Max Hold Time | 1-3 days (these are not long-term trades) |
Want expert trading insights delivered daily?
Join thousands of traders who rely on Traders Agency for market analysis and trade ideas.
Join Traders AgencyKey Takeaways
- Short interest ratio and days-to-cover are the two core metrics to read before entering a squeeze trade. Days to cover tells you how many days of average volume it would take short sellers to fully exit their positions.
- Position size should never exceed 1-2% of your total account on a squeeze setup, and you should not enter after a stock has already moved 100% or more in a single day.
- The first profit target on a squeeze trade is a 50% gain from entry, with a max hold time of 1-3 days. These are not long-term positions.
- A genuine squeeze setup is driven by measurable market structure data. A manufactured one is driven by social media momentum. Knowing the difference requires checking the underlying short interest data, not the Reddit thread.
- Prices can reverse 50% or more in minutes once a squeeze exhausts itself. Your exit plan must be defined before you enter, not after the move starts.
DISCLAIMER: Traders Agency does not offer financial advice. The information provided is for educational purposes only and should not be considered financial advice. Traders Agency is not responsible for any financial losses or consequences resulting from the use of the information provided. Trading carries inherent risks and may not be suitable for all individuals. You are advised to conduct your own research and seek personalized advice before making any investment decisions, recognizing the potential risks and rewards involved.
See more from Traders Agency on Google
Make us a preferred source and our market analysis will appear more prominently in your Google Search, Top Stories, and AI results.
Add to Preferred Sources