People say you can't time the market. They claim it's impossible to know when we're at the low and it's time to buy. But as the latest analysis shows, URGENT: The Market Just Flashed a RARE Buy Signal… It's Happening Again.
I wholeheartedly disagree. They couldn't be more wrong.
I called the low in April 2025 after the tariff selloff, in June 2022 after the rate hikes. And I'm sounding the alarm again today that this is the time to buy.
There is a telltale sign that shows up at every major market bottom. One signal that the low is in and a big rally is starting. It happened at the bottom of the financial crisis, the COVID selloff, in every bear market over the last two decades.
We just saw this sign again.
It all comes down to one specific concept: divergence.
What Is the Rare Buy Signal the Market Just Flashed?
Bottom Line: The single most reliable market-bottom signal is not a technical indicator or an economic forecast. It is the moment when the worst possible headlines fail to push prices lower and stocks surge instead. When bad news and rising prices collide, that divergence tells you institutions are already buying the discount, and the low is likely in.
Typically, bad news makes stocks go down and good news makes them go up. The Fed is cutting interest rates and GDP is up? We're going up. There's a terrorist attack. Unemployment's at multi-year highs? Market's going lower.
But what about when the opposite happens? What about when big, disappointing financial news is released and stocks go up instead of down? That is the low of the market, and it is the best time to buy.
The market is a discounting mechanism. Investors are constantly trying to price in future news. Everything from how many iPhones Apple will sell next quarter to what bond yields will be in 2028. What you pay for stocks today is a reflection of all those assumptions.
That's why the market makes big moves after unexpected news. This is new information that was not priced in.
The 2025 Tariff Shock
The selloff in the first quarter of 2025, where the S&P fell 21%, was a result of the trade war. Trump imposed massive tariffs on almost all of our trading partners. No one expected any of this. There were all these massive increased costs that were going to push inflation. The market sold off.
Then the news got progressively worse. Trump was imposing tariffs on other countries, especially China. He said, "China, you better back down. You better not retaliate. It's going to get worse."
China retaliated. They met him tit for tat.
In response, Trump came out in a tweet and slapped 100% tariffs on China. We buy hundreds of billions of dollars of goods from China. This was a massively negative piece of news.
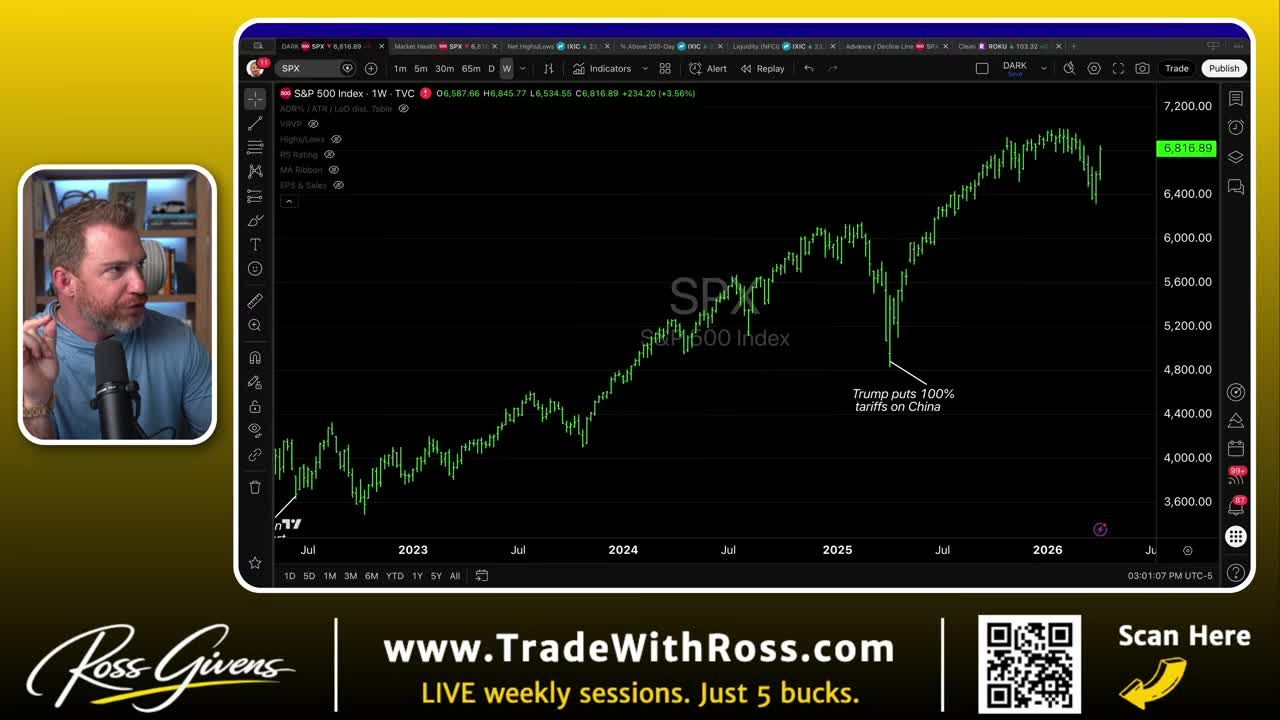
But the market reaction told a completely different story. After that announcement, the stock market went up 10% that month.
When you announce 100% tariffs on the country's largest trade partner, the stock market should not rally 10%. So why did it?
Because it was all fully priced in. The market had sold off to a point where all of this, including the 100%, potentially higher tariffs, was priced into the current value of stocks in that index. When the market goes on a 10% rip in a week after the worst piece of economic news in two years, that means the big shops, the big institutions, the big guys are piling back in. It's all priced in. We're at a discount.
How Did the COVID Crash Prove the Divergence Theory?
The NASDAQ fell 30% in a month during COVID because no one expected a global economic shutdown. We had never seen anything like it.
In late March, the stay-at-home orders started. First it was California. Then 40 other states followed, all in very rapid succession. People had never been told to stay in their homes. They had never been told they weren't allowed to run their businesses or go into work.
There's your signal. That's the low. That is the divergence. Terrible, catastrophic, "what is happening" type news, and stocks go up 10-plus percent.
9.1% Inflation, and Stocks Rallied
To understand the 2022 divergence, you have to look at the setup.
We printed a bunch of money during COVID. Stocks went crazy. Inflation ramped up. Turns out if you print $9 trillion, whatever it was, prices go up.
Inflation, which is measured by the CPI (consumer price index) that the Federal Reserve tries to keep under 2%, was at 3%, then 5%, then 7%. Wall Street's models weren't forecasting an 8% interest rate environment. They had to revise everything down, and stocks sold off as a result.
Then came the worst inflation report in 20, maybe 40 years, in June showing 9.1% inflation. This was the worst news possible for the markets.
Now, a couple of months later, the market came down and undercut that level. It didn't nail the absolute bottom perfectly. But in hindsight, it was still a pretty good buy point. The divergence predicted the shift in momentum.
Get an entire year of live weekly sessions, a weekly newsletter, indicators, bonus reports, and a ton of other stuff for just $5 for the whole year.
Join my Black Ops Trading ClubDid the 2008 Financial Crisis Show the Same Divergence Signal?
This is not a new phenomenon. These divergences have consistently predicted the lows of the market. The low almost always comes within 48 hours of the most devastating news.
The 2018 Pullback
The bottom hit exactly when the Treasury Secretary spooked the markets by making off-hand comments about bank liquidity fears. That very week, the market was up 7%.
The 2009 Financial Crisis
A lot happened during this period, including the Lehman fallout. But the big news was the bailout of AIG. We had never seen anything like this before. The federal government stepping in with tens to hundreds of billions of dollars to bail out banks. People thought, "This is communism. What is going to happen?"
These periods where the market makes a 5 to 10% rally in a week after devastating financial news are the ultimate buy signals.
It's Happening Again Right Now: URGENT: The Market Just Flashed a RARE Buy Signal… It's Happening Again
This exact divergence is playing out in real time.
This most recent selloff produced about a 10% dip from peak to trough, all centered around the Iran situation. This came to a head in April when Trump put a line in the sand with Iran, saying, "You're going to open that strait." He was dropping f-bombs over Twitter on Easter. They went into 21 hours of negotiations with the Vice President of the United States.
They came out and said they couldn't come to terms. Iran wouldn't budge on nuclear. They wouldn't open the strait. So the response was a blockade of the strait, going from a few ships getting through to none.
We lost all progress in Iran. We had nothing to show for it. This was terrible news.
But the market told a completely different story.
When the strait is blockaded and negotiations fail, but the market surges 6.1%, that is money coming off the sidelines. That is the low of the market. This is yet another case where URGENT: The Market Just Flashed a RARE Buy Signal… It's Happening Again, and the pattern is unmistakable.
How to Spot a Market Top
The same principle works in reverse. Just as stocks going up on bad news tend to signal a low, stocks going down on good news typically signals a high.
One of the best examples of this is Nvidia.
Nvidia has gone nowhere for almost a year. After a historic thousand-plus percent rally, it's been a stick in the mud since August of 2025.
For the last three quarters in a row, Nvidia has beat earnings expectations. They've beat revenue estimates. They beat profit estimates. They raised their forward guidance for the coming quarter.
In each and every one of those occurrences, the most liquid, most valuable, most popular stock on God's green earth has gone down after reporting record earnings.
I'm not calling for the collapse of Nvidia. But I think the writing is on the wall that this is near the top for the stock, or at least some kind of short-term top.
The same is true for the broader markets. If you start seeing record GDP, good unemployment numbers, really low inflation, or they're cutting interest rates, and stocks are falling off, that's your sign. You're likely hitting a near-term peak, and you may want to reduce exposure or take a little bit off.
Trust Price Action, Not Headlines
The financial media wants you to react to the news. The price action demands that you react to the divergence.
When the worst possible headlines hit the wire and the market responds by surging higher, ignore the fear and trust the data. The big institutions don't buy the news. They buy the discount.
Whether it's a global shutdown, 9.1% inflation, 100% tariffs on China, or a blockade in the Middle East, the pattern remains identical.
Bad news plus higher prices equals a market bottom. Good news plus lower prices equals a market top.
That's divergence, and that's how you spot the lows of the market.
Get an entire year of live weekly sessions, a weekly newsletter, indicators, bonus reports, and a ton of other stuff for just $5 for the whole year.
Key Takeaways
- Divergence is the core signal: when major negative news hits and stocks rise anyway, that combination has marked every significant market bottom over the past two decades.
- The April 2025 tariff selloff and the June 2022 rate-hike bottom are cited as recent examples where this divergence signal correctly identified the low before a sustained rally.
- The market is a discounting mechanism, meaning prices reflect future expectations, not current headlines. By the time bad news is widely feared, institutions have already priced it in and are buying the discount.
- The inverse is equally important as a warning: when good news fails to push prices higher, that is a classic market top signal, not a buying opportunity.
- The pattern held across 100% China tariffs, 9.1% inflation in 2022, the COVID shutdown, and the 2008 financial crisis, suggesting the divergence signal is durable across very different macro environments.
DISCLAIMER: Traders Agency does not offer financial advice. The information provided is for educational purposes only and should not be considered financial advice. Traders Agency is not responsible for any financial losses or consequences resulting from the use of the information provided. Trading carries inherent risks and may not be suitable for all individuals. You are advised to conduct your own research and seek personalized advice before making any investment decisions, recognizing the potential risks and rewards involved.
See more from Traders Agency on Google
Make us a preferred source and our market analysis will appear more prominently in your Google Search, Top Stories, and AI results.
Add to Preferred Sources