
Options flow tools track institutional trading data to reveal large, urgent market orders. We use these tools to identify unusual options activity, which occurs when contract volume significantly exceeds average daily volume, often signaling major price moves before they happen. By the end of this guide, you'll know how to read sweep orders, filter out institutional hedging, and execute trades based on high-probability flow signals.
You've probably seen a stock suddenly gap up 10% on no news, only to find out later that thousands of call options were purchased the day before. We're going to walk you through exactly how to spot these institutional footprints and, more importantly, how to act on them.
Our team focuses on practical application. We don't just look at raw data. We analyze the intent behind the trades to find actionable setups.
What Is Unusual Options Activity?
Bottom Line: The real edge in trading options flow is not just identifying where large money is moving, but understanding why it is moving and sizing your position to survive being wrong. Institutions can absorb massive drawdowns on speculative positions; retail traders cannot. Treat flow signals as high-probability setups that still require disciplined risk management, not as guaranteed directional bets.
Unusual options activity is a trading scenario where the volume for specific options contracts drastically exceeds their average daily volume. Institutions generate this activity when they take massive positions, particularly in out-of-the-money contracts near expiration, signaling strong conviction about an upcoming price movement.
We look for footprints left by smart money: hedge funds, investment banks, and large proprietary desks. When an entity drops millions of dollars on short-term out-of-the-money (OTM) calls, they expect a rapid directional move. This isn't retail speculation. It's calculated institutional positioning.
Think of the options market as a high-stakes poker game. An options volume spike is the equivalent of a player suddenly pushing all their chips to the center of the table. They either know something the rest of the table doesn't, or they're executing a complex bluff to protect another hand.
Key Concept: Unusual options activity occurs when contract volume dramatically exceeds the average daily volume. It's one of the clearest signals that institutional players are building positions with strong directional conviction.
To verify these trades, we cross-reference data from the Options Clearing Corporation (OCC). The OCC processes millions of contracts daily, and their data feeds help us confirm that the volume is genuine institutional accumulation rather than noise.
Sweep Orders vs. Block Orders: What's the Difference?
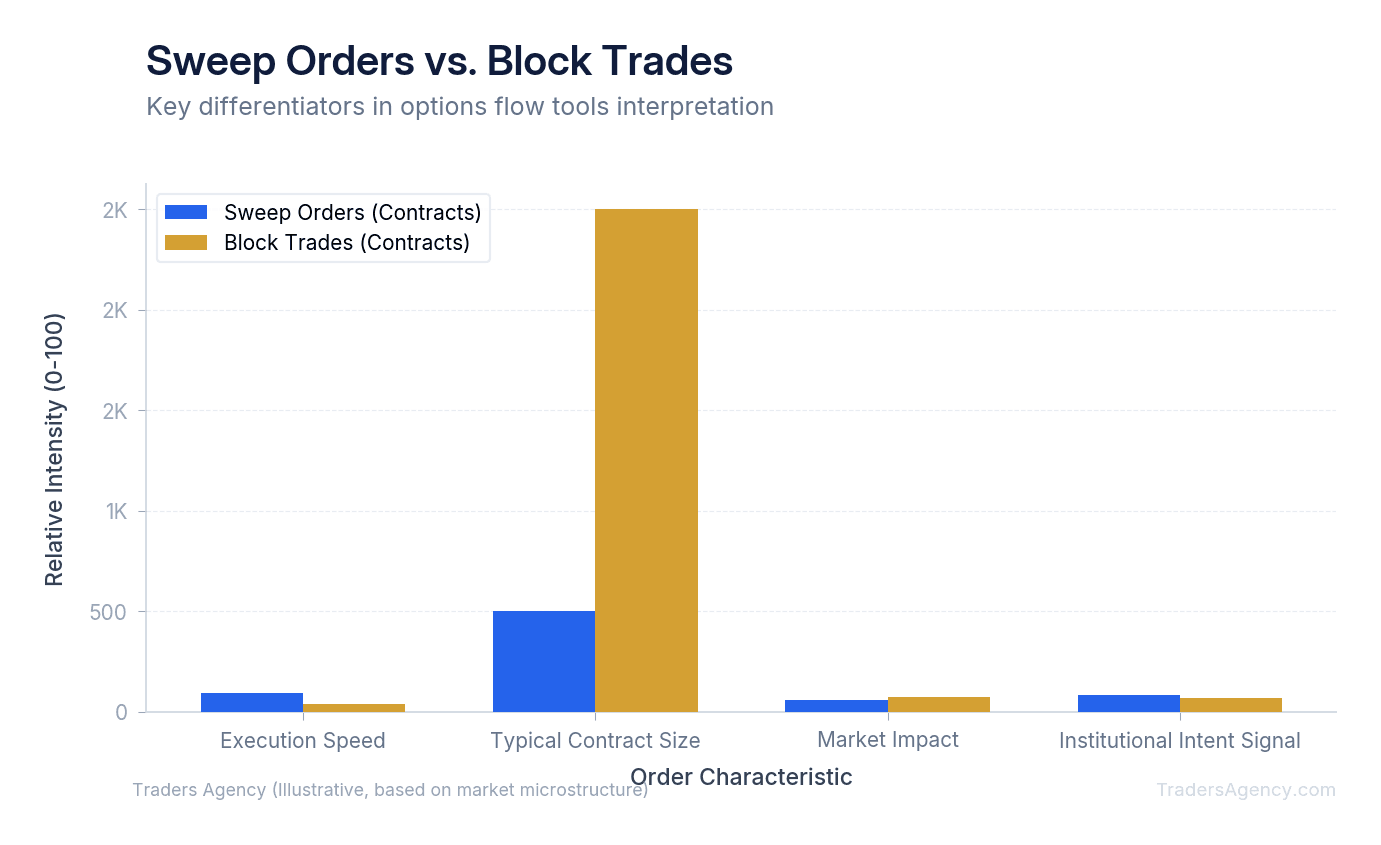
The difference between a sweep and a block order comes down to urgency and routing. A block order is a single, massive trade executed privately, while a sweep order breaks a large trade into smaller pieces routed across multiple exchanges to fill immediately.
When we analyze unusual options flow, urgency is our primary metric. A block trade often indicates a pre-negotiated transaction between two large parties. It's large, but the buyer was willing to wait for a specific price.
Sweep orders tell a completely different story. The buyer wants into the position right now, regardless of the spread. They use Intermarket Sweep Orders (ISO) to clear out the order book across all exchanges, prioritizing speed over price.
This aggressive buying behavior is exactly what we look for when hunting for directional momentum. If an institution is willing to pay the ask price across multiple exchanges simultaneously, they're anticipating an immediate move in the underlying stock.
| Characteristic | Sweep Order | Block Order |
|---|---|---|
| Execution Speed | Immediate, across multiple exchanges | Single fill, often privately negotiated |
| Urgency Signal | Very High | Moderate |
| Price Sensitivity | Low (pays the ask) | High (negotiates price) |
| Routing | Multi-exchange via ISO | Single venue or dark pool |
| What It Tells Us | Buyer expects an immediate directional move | Buyer is building a position but not in a rush |
What Tools Track Unusual Options Activity?
Several platforms track unusual options activity by aggregating real-time exchange data to highlight massive trades. The most effective options flow tools filter out retail noise and focus on institutional sweeps, block trades, and dark pool options activity to reveal where smart money is positioning.
We rely on specialized software because raw exchange data is too massive to parse manually. Without a dedicated scanner, you'll miss the essential signals buried in daily market noise. These platforms connect directly to exchange APIs to monitor every single contract traded in real time. They highlight anomalies based on historical averages, open interest, and volatility metrics.
Comparing the Best Options Flow Tools for Advanced Traders
Not all scanners are created equal. We test and evaluate multiple platforms to find the best edge for our trading strategies.
Here's how we categorize the top platforms currently available to retail and professional traders:
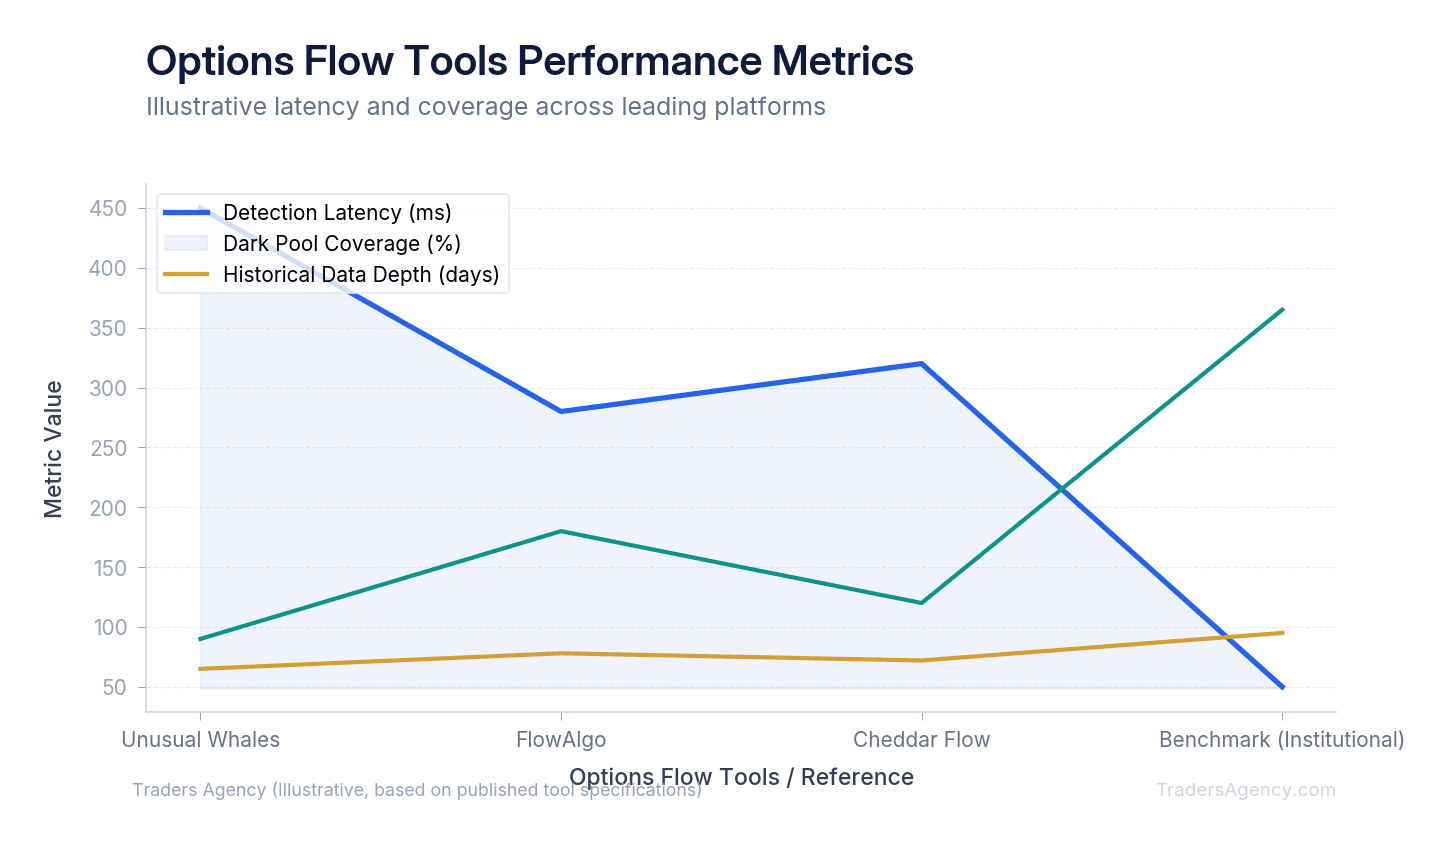
- Unusual Whales: We prefer this platform for deep historical data and complex filtering. It costs around $40 to $50 per month. It excels at showing the bid-ask spread context for every trade, helping you determine if an order was bought or sold.
- FlowAlgo: This is a premium institutional-grade scanner, typically costing over $100 per month. It provides incredibly clean visual data for dark pool options activity and equity blocks. We use it when we need to cross-reference options flow with massive stock purchases.
- Cheddar Flow: We recommend this for traders who need a highly visual, intuitive dashboard. It tracks sweep orders effectively and highlights repeat buying activity. It lacks some of the granular historical backtesting found in Unusual Whales, but it's excellent for real-time day trading.
Want expert trading insights delivered daily?
Join thousands of traders who rely on Traders Agency for market analysis and trade ideas.
Join Traders AgencyHow Do You Interpret Unusual Options Activity?
You interpret unusual options activity by analyzing the order size, urgency, strike price, and expiration date. We look for aggressive sweep orders placed at the ask price for out-of-the-money contracts expiring soon, which indicates a buyer expects an immediate and aggressive directional price move.
Just because you see a massive volume spike in put options doesn't mean the institution is bearish. They could be selling puts to open a bullish position.
We teach our members to look at where the trade filled relative to the spread. If a massive call order fills at the ask price, it's aggressive buying and generally bullish. If it fills at the bid price, it's likely selling to collect premium, which is bearish or neutral.
Another essential metric is the Volume to Open Interest (OI) ratio. If a contract has an open interest of 500, but 10,000 contracts trade in a single hour, we know new positions are being opened. This is a much stronger signal than high volume on a contract that already has massive open interest.
Key Concept: Always check where the trade filled relative to the bid-ask spread. Fills at the ask signal aggressive buying (bullish). Fills at the bid signal selling to collect premium (bearish or neutral). The Volume-to-OI ratio confirms whether new positions are being opened.
Step-by-Step: Trading an Options Volume Spike
Here's a concrete, real-world scenario. You're monitoring your scanner and see a massive volume spike on Apple (AAPL). We'll break down exactly how to evaluate and execute this setup.
- Identify the Setup. AAPL is currently trading at $175. You spot a sweep order for 10,000 contracts of the $180 calls expiring in exactly three days. The premium paid is $1.50 per contract, meaning the institution just spent $1.5 million. The average daily volume for this specific contract is only 400.
- Verify the Conditions. We don't blindly follow the trade. First, check the broader market trend and upcoming news events. If earnings are next week, this might be a volatility play. If there's no scheduled news, this is a pure conviction play. We also review the SEC's educational resources regarding insider trading windows to ensure the flow aligns with legal accumulation periods.
- Execute the Trade. We enter a smaller, risk-defined position. We buy 10 contracts of the same AAPL $180 calls at $1.50. Our total risk is $1,500. Our breakeven price at expiration is $181.50 (the $180 strike plus the $1.50 premium).
- Manage the Outcome. Once in the trade, we prepare for three potential scenarios outlined below.
| Scenario | AAPL Price | Option Value (per contract) | Position P/L |
|---|---|---|---|
| Best Case: Surprise product announcement | $185 | $5.00+ | +$3,500+ (from $1,500 to $5,000+) |
| Most Likely: Institutional momentum drift | $178 | $2.20 | +$700 (sell before expiration) |
| Worst Case: Stock trades flat | $175 | $0.00 (theta crush) | -$1,500 (full loss) |
When Should You Ignore Unusual Options Flow?
Not every million-dollar trade is a directional bet. Institutions use options primarily for hedging and risk mitigation. If a fund holds two million shares of Tesla (TSLA), they might buy 20,000 OTM puts to protect their downside.
If you see massive put buying on a stock that's already up 20% for the month, it's often a protective collar. We filter out these trades by looking for isolated sweeps. If the options flow doesn't align with a corresponding dark pool equity print, we treat it with caution.
You must also watch out for dividend arbitrage. Large volume spikes often occur right before a stock's ex-dividend date. These are complex, delta-neutral trades designed to capture the dividend payout, not directional bets on the stock price. We teach our members to completely ignore flow on dividend-paying stocks within 48 hours of the ex-dividend date.
Finally, beware of multi-leg spreads. A massive block of calls might just be one leg of an iron condor or a butterfly spread. If you only see the call buying and miss the call selling at a higher strike, you'll misinterpret a neutral trade as a highly bullish one.
Watch Out: Not all large options trades are directional bets. Protective hedges, dividend arbitrage, and multi-leg spreads can all generate huge volume spikes that look bullish or bearish on the surface. Always check for corresponding equity prints and nearby ex-dividend dates before acting on flow data.
How Do You Manage Risk When Trading Options Flow?
Following smart money doesn't guarantee a winning trade. Institutions can afford to lose $5 million on a speculative bet. Retail traders can't. You must protect your capital with strict mathematical rules.
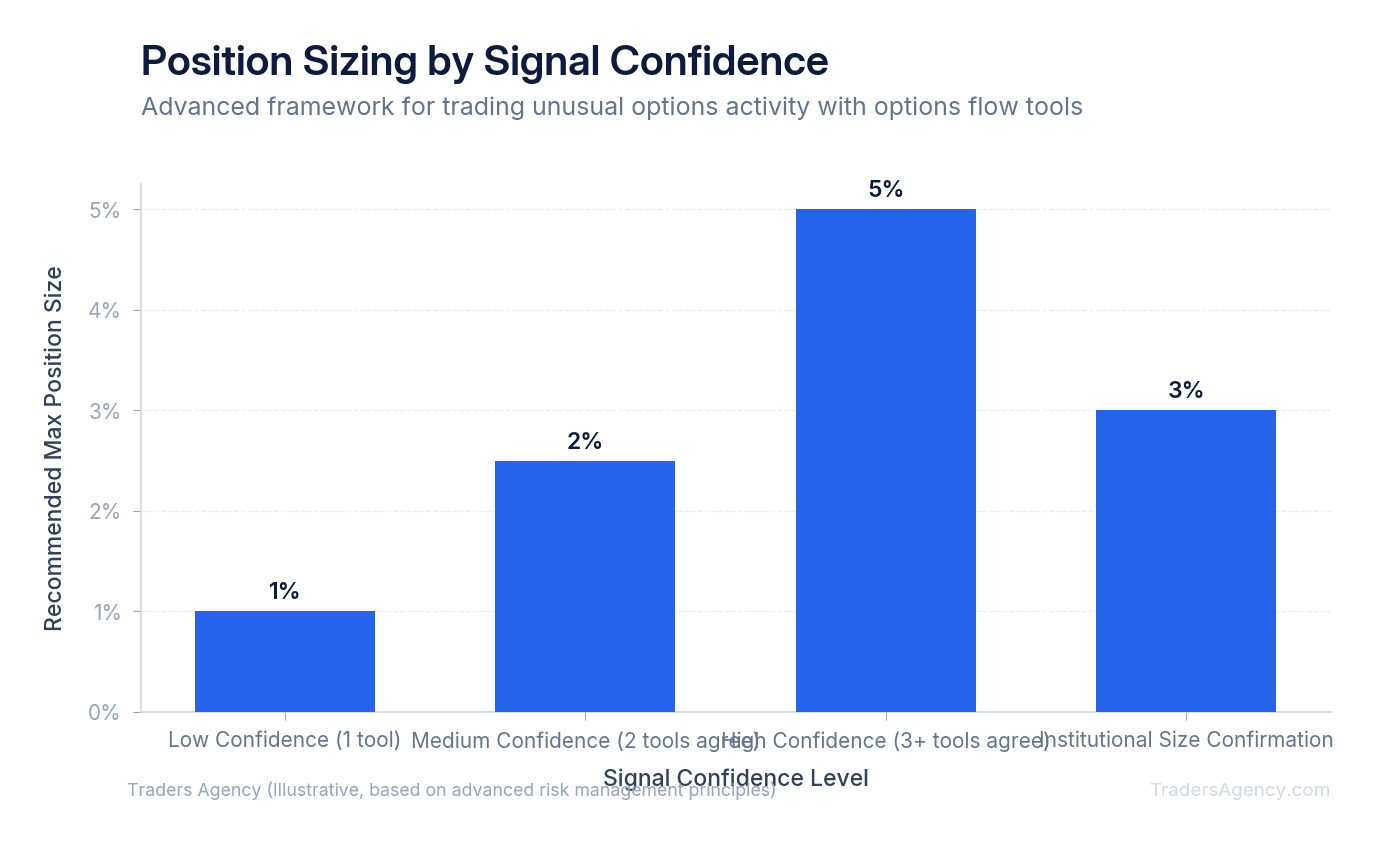
We teach our members to limit any single flow-based trade to 2% of their total options buying power. If your account is $50,000, your maximum allocation for a single unusual flow setup is $1,000. This prevents a single false signal from wiping out your portfolio.
Options flow trades require tight risk controls. We use a technical stop on the underlying stock, not the option premium. Options premiums fluctuate wildly, making premium-based stops unreliable.
Here's the exact framework we use to manage risk on these volatile trades:
- Identify the support level. Find the major technical support level on the underlying stock chart just below the institutional entry price.
- Set a hard price alert. Place the alert for that underlying support level on your charting platform.
- Close on a break of support. If the stock breaks support, close the options position immediately at market price, regardless of the remaining premium.
- Avoid weekend risk on weeklies. Never hold short-dated weekly options through a weekend unless you have a minimum 50% unrealized profit buffer to absorb Monday morning gap-downs.
- Scale out of winners. Sell half your contracts when you reach a 100% return, leaving the rest as a risk-free runner.
Risk Warning: Short-dated options can lose their entire value in a single session. Never risk more than 2% of your options buying power on a single flow-based trade, and always use a technical stop on the underlying stock rather than the option premium.
By combining institutional data with strict retail risk management, you can trade alongside the largest players in the market without exposing yourself to their massive drawdowns. The edge isn't just in spotting the flow. It's in sizing the trade correctly and knowing exactly when to walk away.
Want expert trading insights delivered daily?
Join thousands of traders who rely on Traders Agency for market analysis and trade ideas.
Join Traders AgencyKey Takeaways
- Unusual options activity is confirmed when contract volume significantly exceeds average daily volume, particularly in short-dated, out-of-the-money contracts, which signals strong institutional conviction about an imminent price move.
- Sweep orders are a key signal to track: they indicate urgency, as institutions split large orders across multiple exchanges to fill positions quickly without tipping off the market.
- Not all unusual flow is actionable. Institutional hedging on existing equity positions can mimic bullish or bearish signals, so filtering for intent is as important as spotting the volume spike itself.
- Never risk more than 2% of your options buying power on a single flow-based trade, and use a technical stop on the underlying stock rather than managing risk through the option premium.
- Options flow tools work best when institutional data is combined with technical confirmation on the underlying stock, not used in isolation as a standalone entry trigger.
DISCLAIMER: Traders Agency does not offer financial advice. The information provided is for educational purposes only and should not be considered financial advice. Traders Agency is not responsible for any financial losses or consequences resulting from the use of the information provided. Trading carries inherent risks and may not be suitable for all individuals. You are advised to conduct your own research and seek personalized advice before making any investment decisions, recognizing the potential risks and rewards involved.
See more from Traders Agency on Google
Make us a preferred source and our market analysis will appear more prominently in your Google Search, Top Stories, and AI results.
Add to Preferred Sources