
A MACD strategy for beginners is a technical analysis method that uses the Moving Average Convergence Divergence indicator to identify trend direction and momentum. This strategy involves watching the interaction between moving averages to find precise entry and exit points for your trades. By the end of this guide, we'll walk you through exactly how to read this indicator, spot high-probability setups, and protect your capital in any market environment.
You've probably seen this happen before. A stock looks like it's breaking out, you buy shares, and the price immediately reverses against you. You're left holding a losing position, wondering what went wrong.
This usually happens because traders buy when momentum is already exhausted. Our team recommends using momentum indicators to prevent buying at the exact wrong time. The MACD is one of the most reliable tools for solving this problem, and we're going to show you exactly how to use it.
What Is MACD and How Does It Work?
Bottom Line: MACD is most valuable not as a standalone buy or sell signal, but as a momentum filter that tells you whether the move you are seeing has real strength behind it. Beginners who combine MACD crossovers with divergence signals and consistent stop-loss discipline will avoid the most common trap of entering trades just as momentum runs out. Practice on historical charts first, then apply what you see to live markets with defined risk.
MACD is a trend-following momentum indicator that shows the relationship between two moving averages of a security's price. It works by subtracting a longer-term moving average from a shorter-term moving average. This calculation helps traders visually identify whether bullish or bearish momentum is accelerating or slowing down.
The full name is Moving Average Convergence Divergence, and it relies on three primary components that you'll see on your charting platform.
Key Concept: MACD is built from three components: the MACD line (12-period EMA minus 26-period EMA), the signal line (9-period EMA of the MACD line), and the histogram (the visual difference between those two lines).
The MACD line is calculated by taking the 12-period Exponential Moving Average (EMA) and subtracting the 26-period EMA. The signal line is simply a 9-period EMA of the MACD line itself. The histogram appears as vertical bars above and below a center zero line, measuring the distance between the MACD line and the signal line.
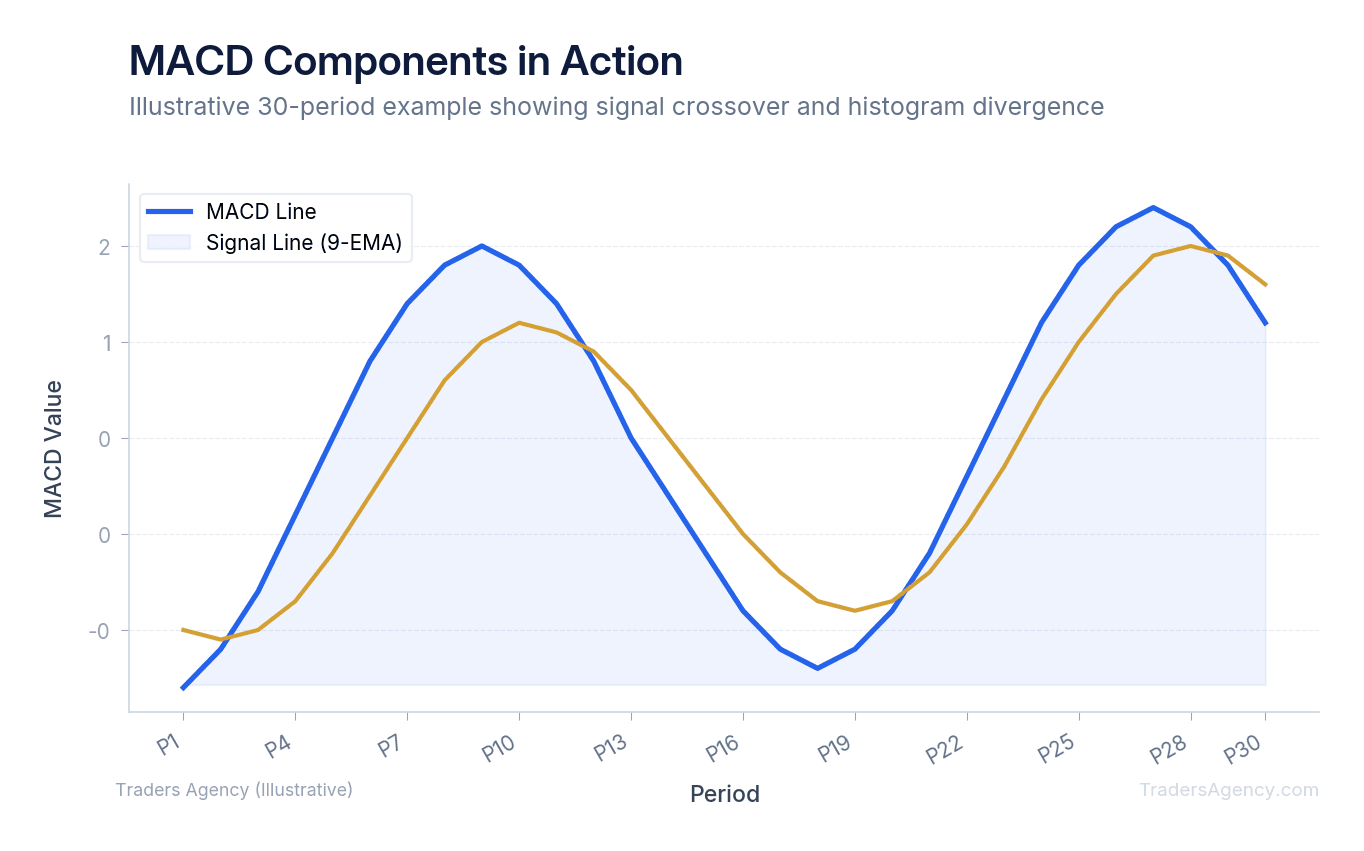
When the MACD line moves away from the signal line, the histogram bars grow taller. This indicates that momentum is increasing. When the lines converge, the bars shrink, showing that momentum is fading.
Our education team teaches members to leave the default settings at 12, 26, and 9 when first starting out. These standard settings work exceptionally well on daily charts for stocks and exchange-traded funds.
How Do You Read MACD Signal Line Crossovers?
You read MACD signal line crossovers by watching when the faster MACD line crosses the slower signal line. A bullish crossover occurs when the MACD line crosses above the signal line, generating a buy signal. A bearish crossover happens when it crosses below, creating a sell signal.
This crossover is the most common entry technique in a MACD strategy for beginners. It provides a clear, visual trigger to enter or exit a position.
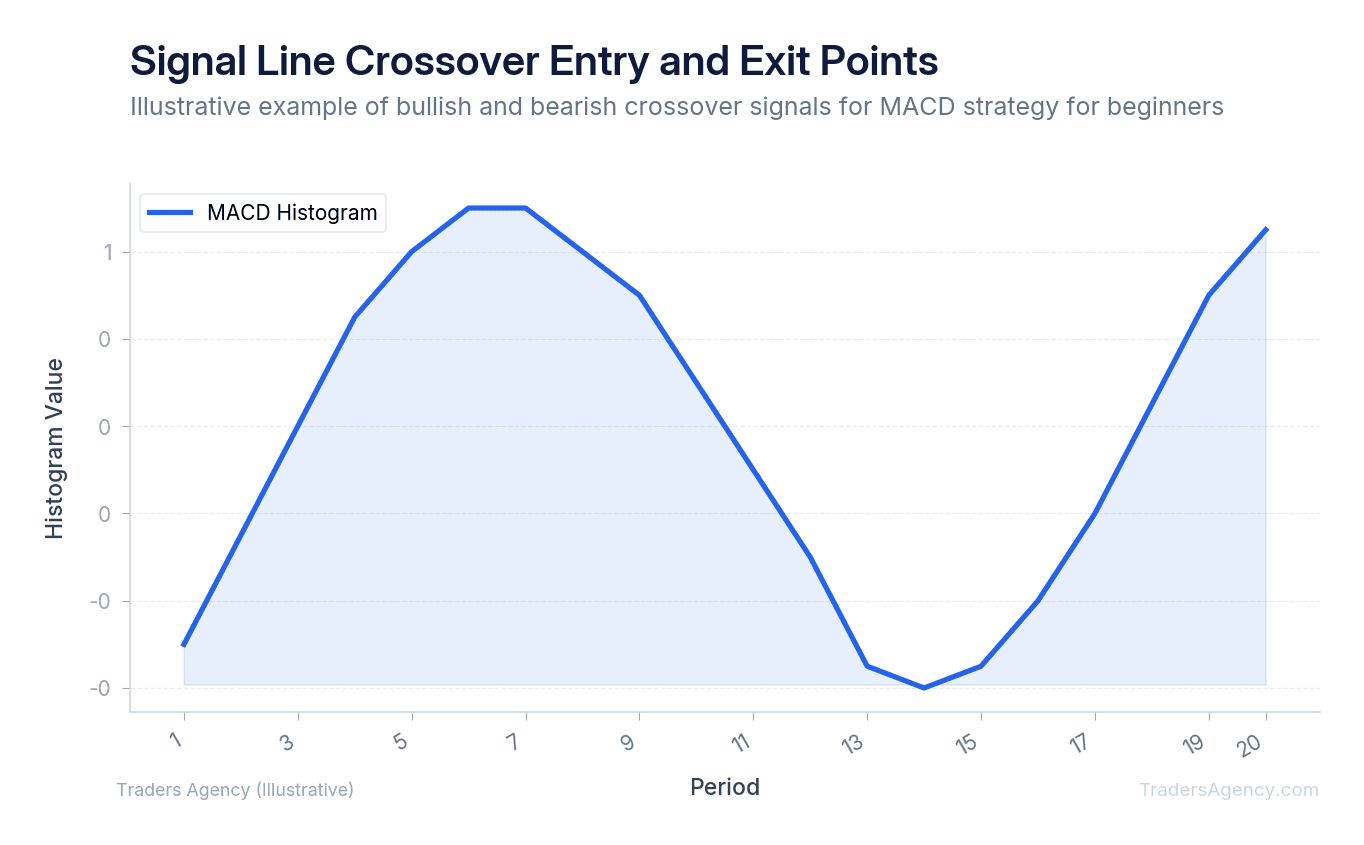
Here's a step-by-step example of a bullish crossover trade. Imagine you're watching a stock like Apple (AAPL) trading at $150 per share.
- Identify the Setup: You notice the stock has been in a short-term downtrend. The MACD line is currently sitting below the signal line in negative territory. You're waiting for momentum to shift before risking your capital.
- Wait for the Trigger: On Tuesday, the MACD line crosses up and over the signal line. The histogram prints its first positive bar. This is your mechanical entry signal.
- Execute the Trade: You buy 100 shares of AAPL at $150. You immediately place a stop-loss order at $145, just below the recent swing low. Your risk is strictly defined at $5 per share.
- Alternative Options Execution: If you prefer trading options, you can use this exact same setup. Instead of buying shares, you could buy a call option. See the trade parameters below.
- Manage the Outcome: The stock rallies to $165 over the next two weeks. The MACD line eventually crosses back below the signal line. This bearish crossover serves as your mechanical exit signal, prompting you to sell your shares for a $15 per share profit or close your options contract for a gain.
Options Alternative: Call Option Trade Parameters
| Parameter | Value |
|---|---|
| Underlying Stock | AAPL at $150 |
| Option Type | Call option, $150 strike |
| Expiration | 45 days out |
| Premium Cost | $5.00 per contract ($500 total) |
| Breakeven at Expiration | $155 ($150 strike + $5.00 premium) |
| Maximum Loss | $500 per contract (premium paid) |
| Maximum Gain | Theoretically unlimited as the stock rises |
This approach removes emotion from your trading. You simply wait for the lines to cross and follow the rules.
What Does a MACD Zero Line Crossover Mean?
A MACD zero line crossover means that the short-term moving average has crossed the long-term moving average. When the MACD line crosses above the zero line, the overall trend has shifted to positive. When it crosses below zero, the longer-term trend has turned negative.
While signal line crossovers give you early entry points, zero line crossovers confirm the broader trend direction. We prefer to use the zero line as a filter for our trades.
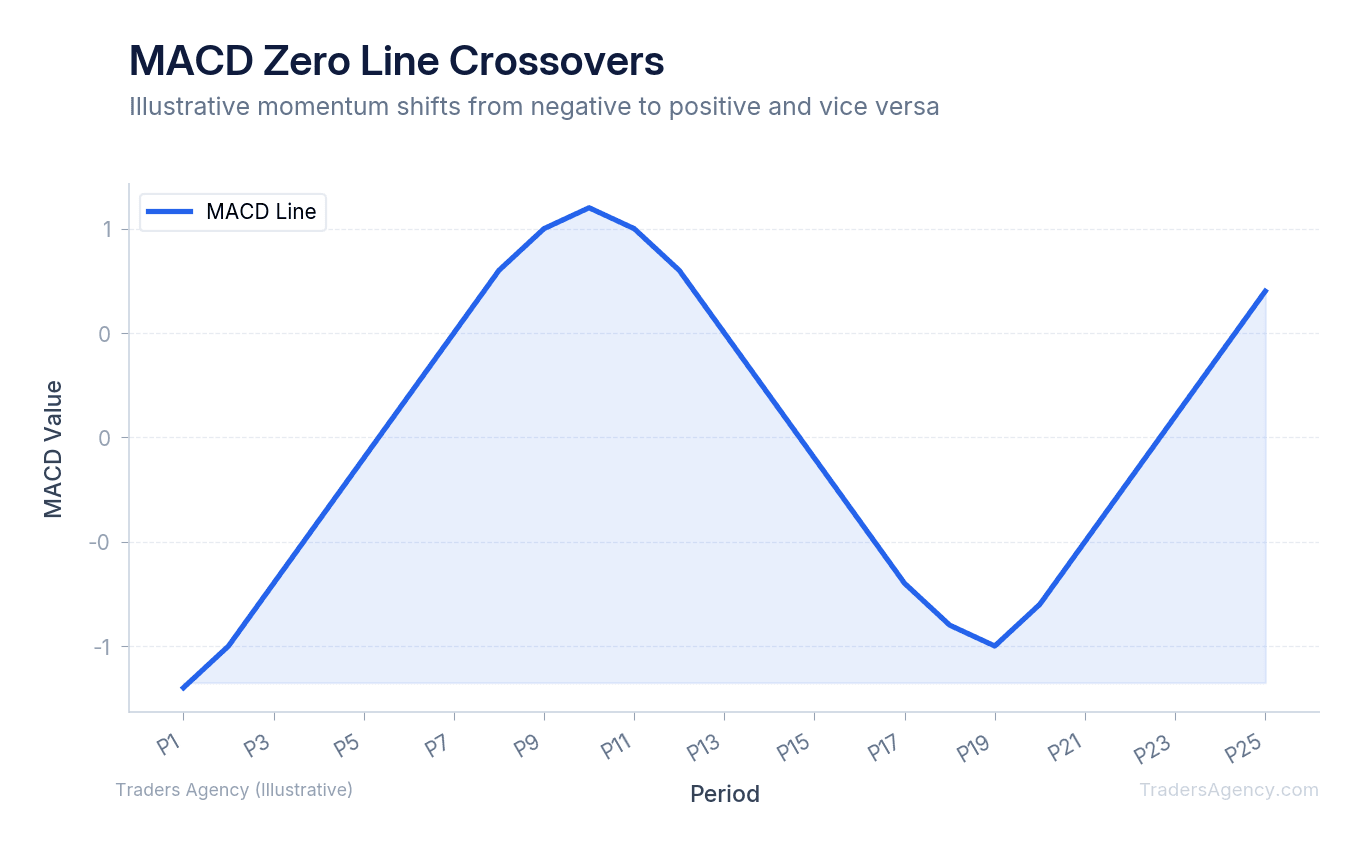
If the MACD line is above zero, the 12-period EMA is trading higher than the 26-period EMA. This is a structurally bullish environment. In this scenario, we only want to look for buying opportunities.
Conversely, if the MACD line falls below zero, the bears are in control. Beginner traders frequently make the mistake of fighting strong downtrends. When the indicator is below zero, we teach our members to avoid buying dips. The SEC's Investor.gov educational resources reinforce this same principle: always understand the prevailing trend before committing capital.
Key Concept: A bullish signal line crossover that occurs while the MACD line is already above the zero line is one of the strongest buy signals you can find. Both the short-term momentum and the broader trend are working in your favor.
Want expert trading insights delivered daily?
Join thousands of traders who rely on Traders Agency for market analysis and trade ideas.
Join Traders AgencyHow Do You Use MACD to Spot Trend Reversals?
Once you master basic crossovers, you can learn to spot divergence. Divergence happens when the price of an asset moves in the opposite direction of the momentum indicator. This is an incredibly powerful tool for anticipating trend changes before they happen.
To spot divergence, you need to draw trendlines on your chart. Here's the process:
- Draw a line connecting the recent price peaks on your main price chart.
- Draw a corresponding line connecting the peaks on the MACD histogram.
- Compare the two lines. If the price line points up but the histogram line points down, you've found bearish divergence. If the price line points down but the histogram line points up, you've found bullish divergence.
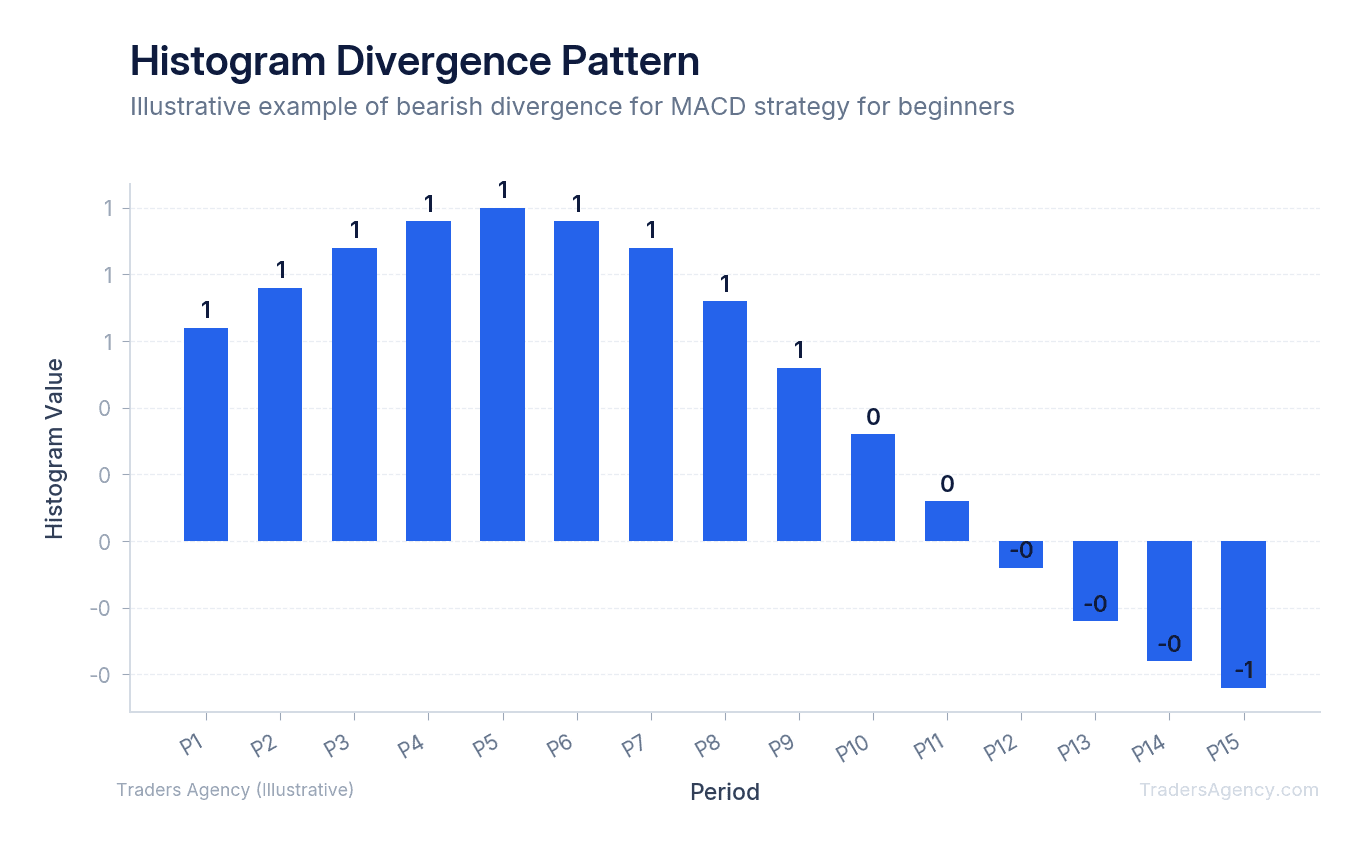
Bearish Divergence Example
Say the SPDR S&P 500 ETF (SPY) is hitting new all-time highs at $510. The price chart looks incredibly bullish. However, you look down at your indicator. The MACD histogram is making lower highs, printing smaller green bars than it did during the previous price peak.
This is bearish divergence. The price is rising, but the upward momentum is actually slowing down. We use this warning sign to tighten our stop losses or take partial profits off the table.
Bullish Divergence Example
The opposite is also true. Imagine a stock is crashing to new lows at $50 per share. The crowd is panicking and selling. You check the histogram and notice the red bars are getting shorter and closer to the zero line. The price made a lower low, but the indicator made a higher low.
This bullish divergence tells you the selling pressure is exhausted. It often precedes a strong rally, giving you a chance to buy near the absolute bottom.
Watch Out: Divergence is a warning signal, not an immediate entry trigger. Always wait for a confirming crossover or price action signal before entering a trade based on divergence alone. Acting too early can put you on the wrong side of a trend that still has momentum.
How Do You Use MACD with Other Indicators?
You use MACD with other indicators by pairing it with tools that measure different market variables, like volume or price extremes. Combining MACD with the Relative Strength Index (RSI) or a 200-day moving average helps filter out false signals and provides higher conviction for your trade entries.
No single indicator is perfect. In choppy, sideways markets, moving average crossovers will generate false signals. You might buy a bullish crossover only to see the price immediately reverse. To fix this, our team pairs a MACD strategy for beginners with a long-term trend filter.
Here is the exact checklist we use to validate a trade:
- Check the 200-day Simple Moving Average (SMA) to determine the macro trend.
- Only look for long positions if the price is trading above the 200-day SMA.
- Wait for the MACD line to cross above the signal line. This is your entry trigger.
- Verify that the RSI is not in overbought territory (above 70). If RSI is already overheated, skip the trade.
By requiring multiple conditions to align, you drastically reduce your false signals. You'll take fewer trades, but the trades you do take will have a much higher probability of success.
How Do You Apply MACD in Real Trades While Managing Risk?
Knowing how to read a chart is only half the battle. You must also know when to apply these tools and how to protect your account.
This strategy works best in trending markets. If a stock is trading in a tight, flat range, moving averages will constantly cross back and forth. We recommend avoiding this indicator entirely during periods of low volatility.
Timeframes also matter. While the default 12, 26, 9 settings work great on daily charts, day traders often struggle with them on 5-minute charts. If you're day trading, you might need to test faster settings to reduce lag.
Most importantly, you must manage your risk on every single trade. Here are our strict risk management rules:
- Never risk more than 1% to 2% of your total account equity on a single trade.
- Always place a hard stop-loss order the moment you enter a position.
- If the MACD generates a reverse crossover against your position, exit the trade immediately. Do not hold and hope.
- Size your positions based on the distance between your entry price and your stop-loss price.
Position Sizing Example
| Parameter | Value |
|---|---|
| Entry Price | $100 |
| Stop-Loss Price | $95 |
| Risk Per Share | $5 |
| Maximum Account Risk | $500 |
| Position Size | 100 shares ($500 ÷ $5) |
Risk Warning: No indicator guarantees profitable trades. MACD generates false signals in sideways and choppy markets. Always use a stop-loss, never risk more than you can afford to lose, and practice on historical charts before trading with real capital.
Mastering a MACD strategy for beginners takes practice. Start by looking at historical charts to spot past crossovers and divergence. Once you train your eyes to see the patterns, you can start applying them in live markets with strict risk limits. Our education team publishes new strategy guides and market analysis every week to help you keep building your skills.
Want expert trading insights delivered daily?
Join thousands of traders who rely on Traders Agency for market analysis and trade ideas.
Join Traders AgencyKey Takeaways
- MACD is calculated by subtracting a longer-term moving average from a shorter-term moving average, making it useful for spotting whether momentum is accelerating or fading before you enter a trade.
- One of the most common beginner mistakes is buying when momentum is already exhausted. MACD helps you avoid this by showing the strength behind a price move, not just the direction.
- The indicator has three core components visible on any charting platform: the MACD line, the signal line, and the histogram.
- Divergence between price and the MACD indicator is a key setup to watch for trend reversals, covered under the 'How to Spot Trend Reversals' section.
- Before trading live, the article recommends practicing on historical charts to train your eye to recognize crossovers and divergence patterns with strict risk limits in place.
DISCLAIMER: Traders Agency does not offer financial advice. The information provided is for educational purposes only and should not be considered financial advice. Traders Agency is not responsible for any financial losses or consequences resulting from the use of the information provided. Trading carries inherent risks and may not be suitable for all individuals. You are advised to conduct your own research and seek personalized advice before making any investment decisions, recognizing the potential risks and rewards involved.
See more from Traders Agency on Google
Make us a preferred source and our market analysis will appear more prominently in your Google Search, Top Stories, and AI results.
Add to Preferred Sources



