
You have probably seen this scenario play out in the market before. A company reports record revenue, the stock price spikes, and then it suddenly crashes a month later when a debt covenant is breached. Learning how to spot balance sheet red flags is what separates traders who get blindsided by bankruptcies from those who actively protect their capital.
We will walk you through exactly how to analyze a company's balance sheet, calculate key liquidity ratios, and identify warning signs before the broader market catches on. Our team relies on these fundamental metrics to filter out high-risk trades and find companies with true staying power. By the end of this guide, you will know how to read these filings like a professional and apply the data directly to your trading strategy.
What Is a Balance Sheet and Why Does It Matter?
Bottom Line: A company's revenue headline tells you almost nothing about its survival odds. The balance sheet, and specifically its footnotes, is where hidden liabilities, covenant risks, and liquidity problems actually live. Traders who build the habit of checking these filings before entering positions are the ones who avoid getting caught in sudden collapses that the broader market never saw coming.
A balance sheet is a foundational financial statement that provides a snapshot of what a company owns and what it owes on a specific date. It reveals the true financial health and solvency of a business, allowing investors to determine if the company can survive economic downturns.
Our team recommends reviewing this document before placing any long-term fundamental trade. The entire statement rests on the balance sheet equation:
Key Concept: Assets = Liabilities + Shareholders' Equity. This formula is the bedrock of corporate accounting. Every single transaction a business makes affects this balance, and understanding it lets you immediately see how a company funds its growth.
Think of it like a scale that must always remain perfectly balanced. If a company buys a new factory (an asset), it must pay for it somehow. It will either take on debt (a liability) or use cash raised from investors (equity).
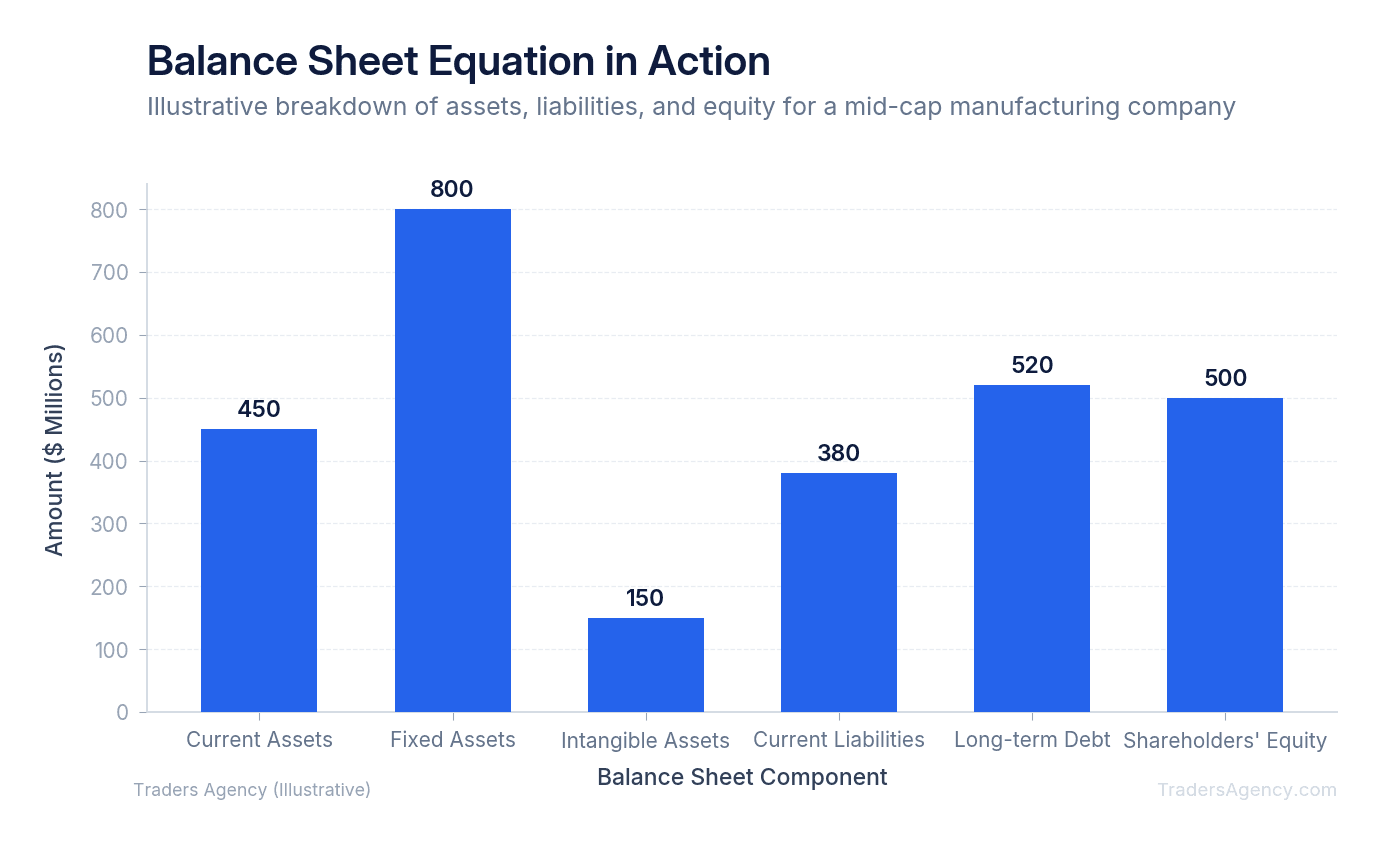
When you understand this equation, you can immediately see how a company funds its growth. A business that grows its assets primarily through massive amounts of debt is taking on significant financial risk. A business that grows its assets through retained earnings demonstrates sustainable operational strength.
How to Read and Interpret a Company Balance Sheet
You read and interpret a company balance sheet by breaking it down into three main sections: assets, liabilities, and equity. Then you compare current figures to historical data. This process helps you understand how the business funds its operations and whether it relies too heavily on outside debt.
We teach our members to start at the top of the document. The assets section lists everything the company owns, ordered strictly by liquidity. Liquidity simply means how fast an asset can be converted into cash.
Assets
- Current assets are items that can be converted to cash within one year. This category includes cash equivalents, short-term investments, accounts receivable, and physical inventory.
- Long-term assets include property, plant, equipment, and intellectual property, which take much longer to sell.
Liabilities
- Current liabilities are bills the company must pay within the next 12 months. This includes accounts payable to suppliers and short-term debt obligations.
- Long-term liabilities represent obligations like ten-year corporate bonds or long-term lease agreements.
Shareholders' Equity
Shareholders' equity represents the net worth of the company. It is the exact amount of money left over if the business sold all its assets today and paid off all its debts. If this number is consistently growing, the company is generally creating value for its shareholders.
The Key Ratios We Use to Analyze a Balance Sheet
The key ratios we rely on include the current ratio, the quick ratio, and the debt-to-equity ratio. These formulas allow traders to measure a company's short-term liquidity, its ability to pay immediate obligations, and its overall financial leverage compared to industry peers.
We prefer to calculate these numbers manually rather than relying on free stock screeners. Third-party websites often use delayed data or miscategorize specific line items.
1. The Current Ratio
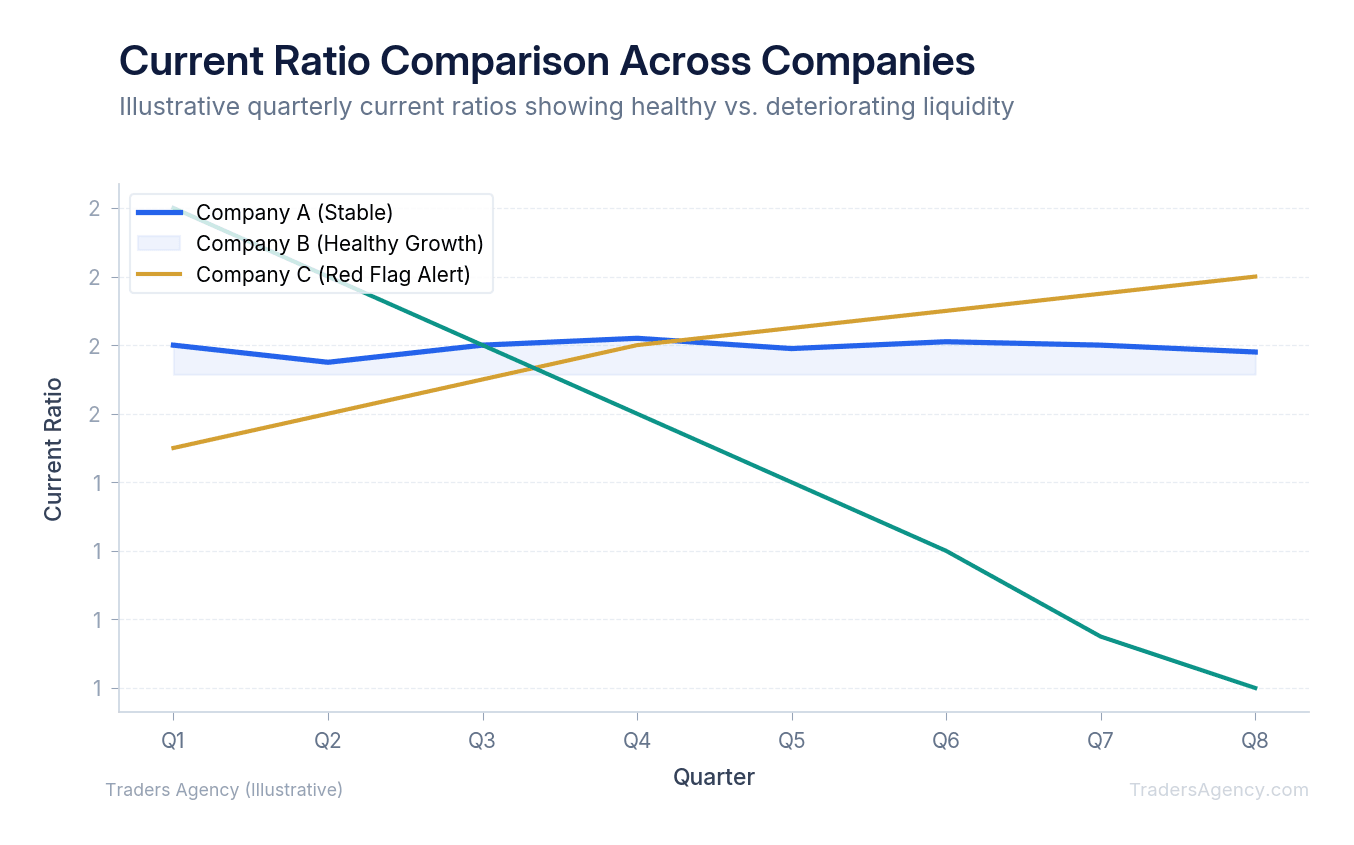
This metric measures basic short-term liquidity. You calculate it by dividing total current assets by total current liabilities. A ratio above 1.0 means the company currently has enough short-term assets to cover its short-term debts. If a company has $2 billion in current assets and $1 billion in current liabilities, its current ratio is 2.0.
2. The Quick Ratio (Acid-Test Ratio)
This is a much stricter measurement of financial health. You take current assets, subtract inventory, and then divide by current liabilities. We use this formula because physical inventory can be incredibly difficult to sell quickly during an economic recession.
3. The Debt-to-Equity Ratio
This ratio shows how much a company relies on borrowed money. You divide total liabilities by total shareholders' equity. A high number indicates that the company is aggressively financing its growth with debt, which can become dangerous if interest rates rise.
| Ratio | Formula | What It Tells You |
|---|---|---|
| Current Ratio | Current Assets / Current Liabilities | Can the company cover short-term debts? |
| Quick Ratio | (Current Assets - Inventory) / Current Liabilities | Can it pay bills without selling inventory? |
| Debt-to-Equity | Total Liabilities / Shareholders' Equity | How much growth is funded by debt? |
Want expert trading insights delivered daily?
Join thousands of traders who rely on Traders Agency for market analysis and trade ideas.
Join Traders AgencyWhat Do Good and Bad Balance Sheet Values Look Like by Sector?
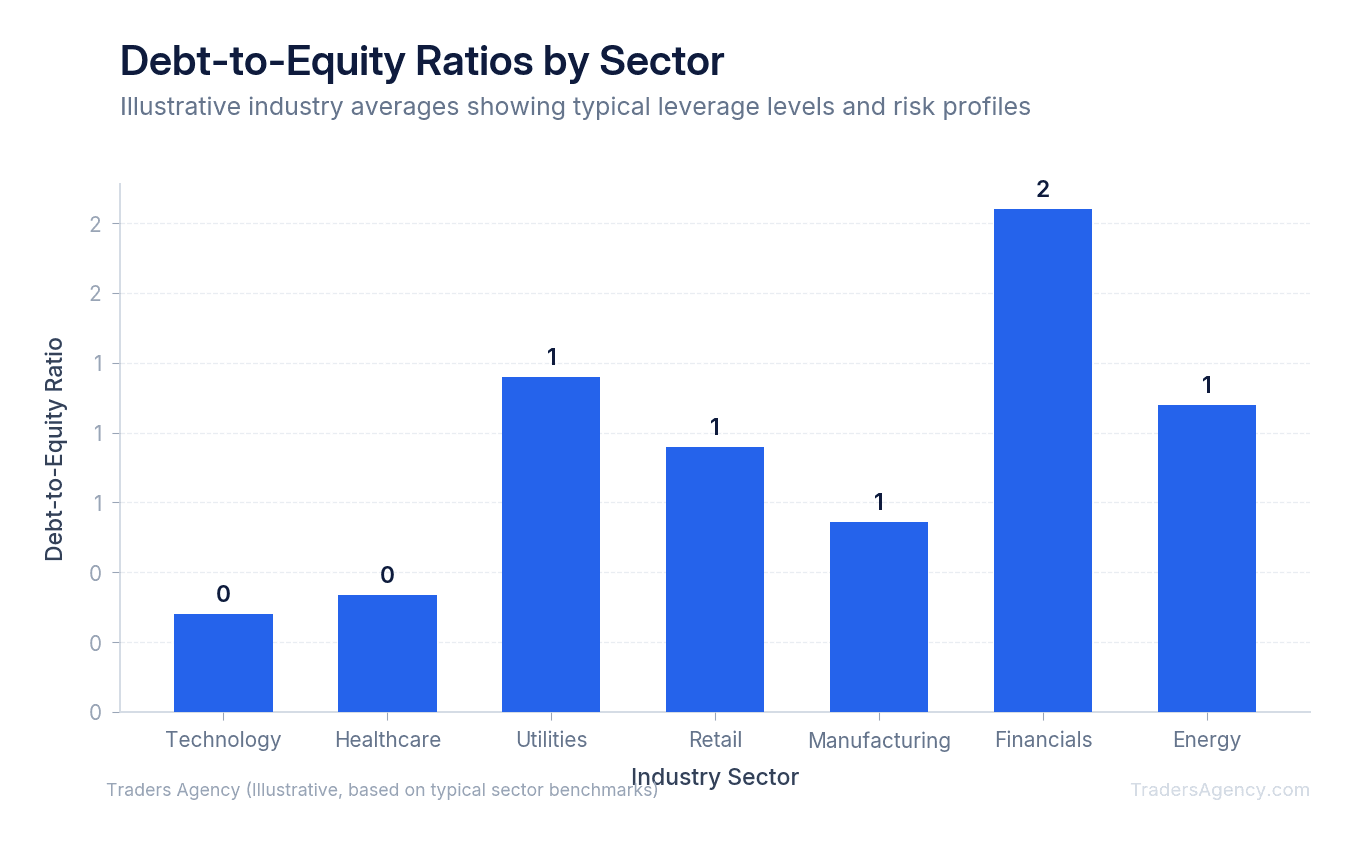
A common mistake new traders make is applying the exact same ratio benchmarks to every single stock they analyze. What looks like a terrible financial metric in one industry might be perfectly normal in another. You must compare companies to their direct sector peers.
For example, a software-as-a-service (SaaS) company typically carries very little debt. A healthy tech company might have a debt-to-equity ratio of 0.2 or lower. These companies do not need to build massive factories or buy fleets of delivery trucks, so they naturally operate with low leverage.
On the other hand, utility companies and telecom providers require massive upfront infrastructure investments. A healthy utility company might operate with a debt-to-equity ratio of 1.5 or even 2.0. Because they have highly predictable recurring revenue from customer energy bills, they can safely service much higher debt loads.
Retail businesses present another unique sector challenge. A retail company will naturally have a massive portion of its assets tied up in inventory. When analyzing retail stocks, we place much more emphasis on the quick ratio than the current ratio to ensure the company can survive a sudden drop in consumer spending.
Watch Out: Never apply a single "good" or "bad" threshold across all industries. A debt-to-equity ratio of 1.5 could signal danger for a tech company but is completely standard for a utility. Always compare against direct sector peers.
What Are the Biggest Red Flags on a Company Balance Sheet?
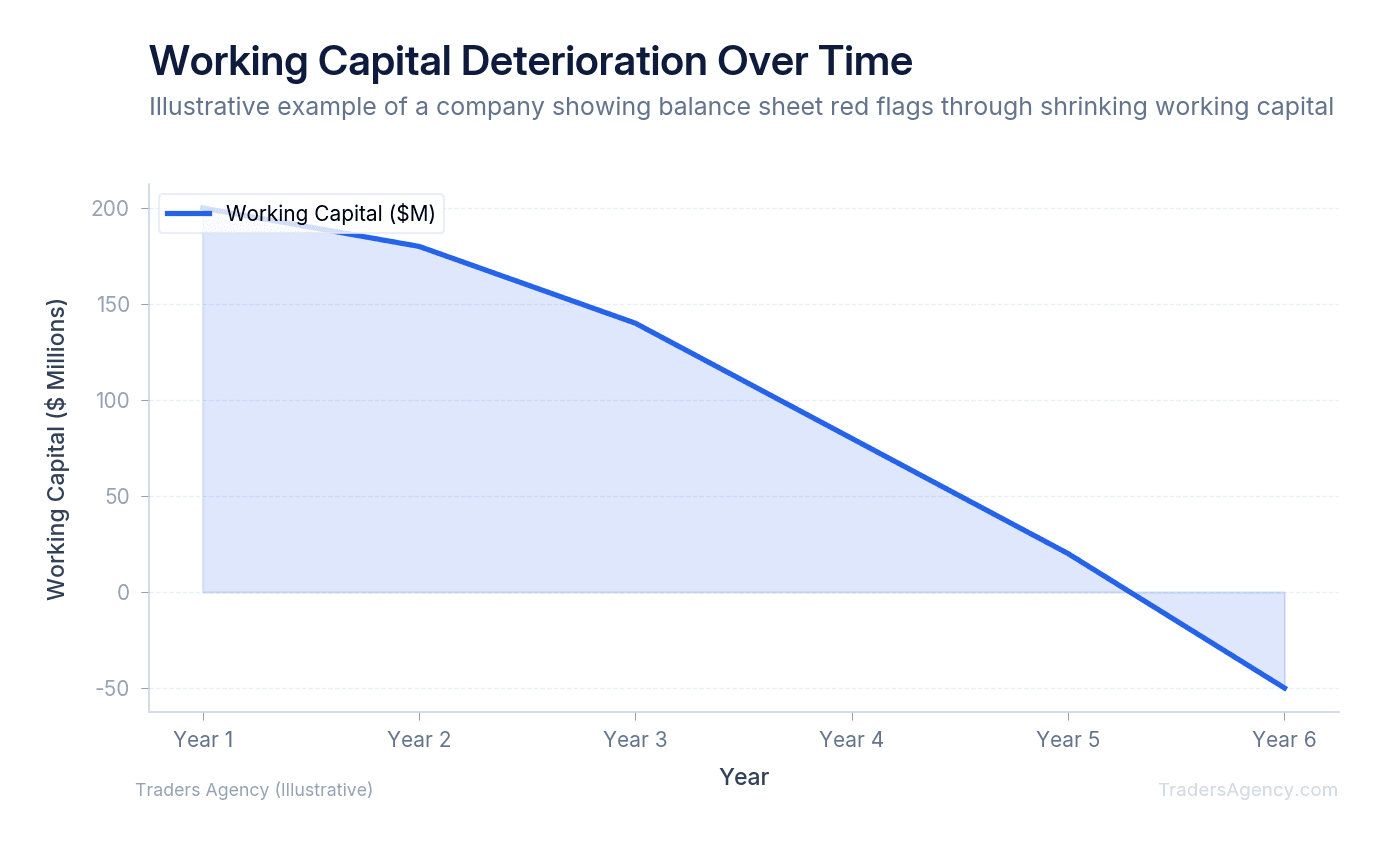
Red flags to look for on a balance sheet include rapidly declining cash reserves, ballooning short-term debt, negative working capital, and unusually high levels of goodwill or intangible assets. These warning signs often indicate that a company is struggling to maintain its operations and may face imminent liquidity issues.
Finding balance sheet red flags early can save you from catastrophic portfolio losses. We look for specific patterns that indicate a business is hiding financial distress.
- Unexplained spike in accounts receivable: If sales are flat but accounts receivable are skyrocketing, the company might be shipping products to customers who cannot actually pay for them.
- Declining or negative working capital: You calculate working capital by subtracting current liabilities from current assets. Positive working capital means the business can fund its day-to-day operations. A multi-year decline is a massive warning sign.
- Massive goodwill figures: Goodwill is an intangible asset recorded when a company pays more than the fair value of the net identifiable assets of an acquired business. If the acquired business underperforms, the parent company must eventually write down that goodwill, resulting in a sudden hit to reported assets and equity.
How Do You Spot Balance Sheet Red Flags in Real Time?
Here is a concrete example of how we evaluate a potential long position. Assume we are analyzing a fictional retail company trading under the ticker symbol RETL.
- Step 1: Check the Setup. RETL is currently trading at $50 per share. The stock is down 20% this year, and financial news outlets are calling it a deep value bargain. Before buying the dip, we pull up the latest quarterly filing to verify the actual health of the underlying business.
- Step 2: Execute the Analysis. We look directly at the assets section. RETL reports $500 million in total current assets. However, upon closer inspection, $400 million of that total is tied up in physical inventory. They only have $50 million in cash and $50 million in accounts receivable. Next, we check liabilities: RETL currently has $300 million in current liabilities due within the next year. We calculate the current ratio: $500M / $300M = 1.66. On the surface, this looks completely healthy. Then we calculate the quick ratio: ($500M - $400M) / $300M = 0.33.
- Step 3: Evaluate the Outcome. This discrepancy is one of the most common balance sheet red flags in the retail sector. The quick ratio of 0.33 exposes the truth: RETL cannot actually pay its short-term bills unless it manages to liquidate its massive stockpile of inventory immediately.
| Scenario | What Happens | Our Decision |
|---|---|---|
| Best Case | Consumer demand spikes, RETL sells inventory at full price, cash position improves | Still risky. Too dependent on external demand. |
| Most Likely | RETL heavily discounts inventory to generate emergency cash, crushing profit margins for 3+ quarters | Avoid. Margin compression ahead. |
| Worst Case | Inventory is obsolete, cannot sell at all, company forced into bankruptcy | Strict avoid. Capital preservation first. |
Key Concept: A "healthy" current ratio can hide serious liquidity problems. Always calculate the quick ratio alongside the current ratio, especially for retail and manufacturing companies with large inventory positions.
Practical Application: Integrating Balance Sheet Analysis Into Your Trading
We teach our traders to use balance sheet analysis specifically for long-term investments, swing trades lasting several months, and dividend growth portfolios. This data tells you if a company has the financial staying power to survive a broad market correction.
However, you should not use this strategy in isolation for short-term day trading. A company with a terrible balance sheet can still experience a massive short squeeze or a momentum rally over a two-day period. Fundamentals dictate long-term price action, while technicals and volume dictate short-term moves.
To properly integrate this analysis into your trading routine, our team follows these strict risk management rules:
- Never allocate more than 5% of your total account capital to a single stock, regardless of how pristine the financials look.
- Always set a hard stop loss below the nearest technical support level to protect against sudden, unexpected fundamental shifts.
- Review the company's financial statements every single quarter when new earnings reports drop.
- Cross-reference balance sheet health with the cash flow statement to ensure the company is actually generating real cash from its operations.
Watch Out: A strong balance sheet means very little if the company is burning through its cash reserves every single month. You must look at the complete financial picture before risking your capital.
Where to Find a Company's Balance Sheet
You can find a company's balance sheet for free on the SEC EDGAR database, the investor relations page of the company's official website, or through major financial data platforms. The most accurate and complete versions are always located within the official 10-Q (quarterly) and 10-K (annual) filings.
We highly recommend going straight to the source. The SEC provides educational resources reminding investors to always read the footnotes accompanying official financial statements. These footnotes often reveal off-balance-sheet liabilities and complex derivative risks that standard stock screeners completely ignore.
When you open a 10-K annual filing on the SEC website, look specifically for "Item 8: Financial Statements and Supplementary Data." This section contains the fully audited numbers you need to make informed, professional trading decisions.
Our education team publishes new strategy guides and market analysis every week. If this guide helped you understand balance sheet analysis, share it with a fellow trader who could use the edge.
Want expert trading insights delivered daily?
Join thousands of traders who rely on Traders Agency for market analysis and trade ideas.
Join Traders AgencyKey Takeaways
- The balance sheet equation (Assets = Liabilities + Shareholders' Equity) governs every transaction a company makes, and any distortion in this relationship is your first signal that something is wrong.
- Debt covenant breaches can trigger sudden stock collapses even after record revenue reports, making balance sheet analysis a critical step before entering any long-term fundamental trade.
- Standard stock screeners miss off-balance-sheet liabilities and derivative risks entirely. You need to read the footnotes in the actual 10-K filing to catch these exposures.
- When pulling SEC filings, go directly to Item 8: Financial Statements and Supplementary Data for the fully audited numbers rather than relying on third-party data aggregators.
- Balance sheet health benchmarks vary by sector, so a debt level that signals danger in one industry may be completely normal in another. Context is required before drawing conclusions.
DISCLAIMER: Traders Agency does not offer financial advice. The information provided is for educational purposes only and should not be considered financial advice. Traders Agency is not responsible for any financial losses or consequences resulting from the use of the information provided. Trading carries inherent risks and may not be suitable for all individuals. You are advised to conduct your own research and seek personalized advice before making any investment decisions, recognizing the potential risks and rewards involved.
See more from Traders Agency on Google
Make us a preferred source and our market analysis will appear more prominently in your Google Search, Top Stories, and AI results.
Add to Preferred Sources



