
How to read an income statement begins with understanding its core purpose: tracking a company's profitability over a specific period. The income statement lists revenue at the top, subtracts the cost of goods sold to find gross profit, and deducts operating expenses to reveal operating income. Finally, it accounts for taxes and interest to calculate the bottom-line net income.
You have probably seen a stock drop 10% or more immediately after an earnings report, even when the company seemingly made billions of dollars. We are going to walk you through exactly why that happens. Financial reports can look like a wall of intimidating numbers to new traders, but they do not have to stay that way.
By the end of this guide, you will know how to evaluate a company's financial health just like our team does. We prefer to focus on practical application rather than dense accounting theory. You will learn to spot the difference between a company that is actually growing and one that is just burning through cash.
What Is an Income Statement and Why Does It Matter?
An income statement is a financial document that shows a company's revenues and expenses over a specific period. It matters because it reveals whether a business is actually making money. Traders use this statement to evaluate profitability, track growth trends, and determine if a stock represents a sound investment.
Think of it as a financial report card for a quarter or a full year. While a balance sheet takes a snapshot of what a company owns at one specific moment, the income statement acts like a video recording. It tracks the flow of money coming in and going out over three months or twelve months.
Key Concept: The income statement measures profitability over a period of time (a quarter or a year), while the balance sheet captures a company's financial position at a single point in time. Start with the income statement when researching any new stock.
Our team recommends looking at the income statement first when researching a new stock. If a company cannot consistently generate a profit or show a clear path to profitability, the underlying stock carries significantly higher risk.
How Do You Read an Income Statement Line by Line?
When you look at an income statement, you are reading a top-to-bottom math problem. You start with all the money the company brought in, and you slowly subtract different types of costs until you reach the final profit.
We teach our members to read this statement in a specific order. This top-to-bottom flow is often called the earnings waterfall.
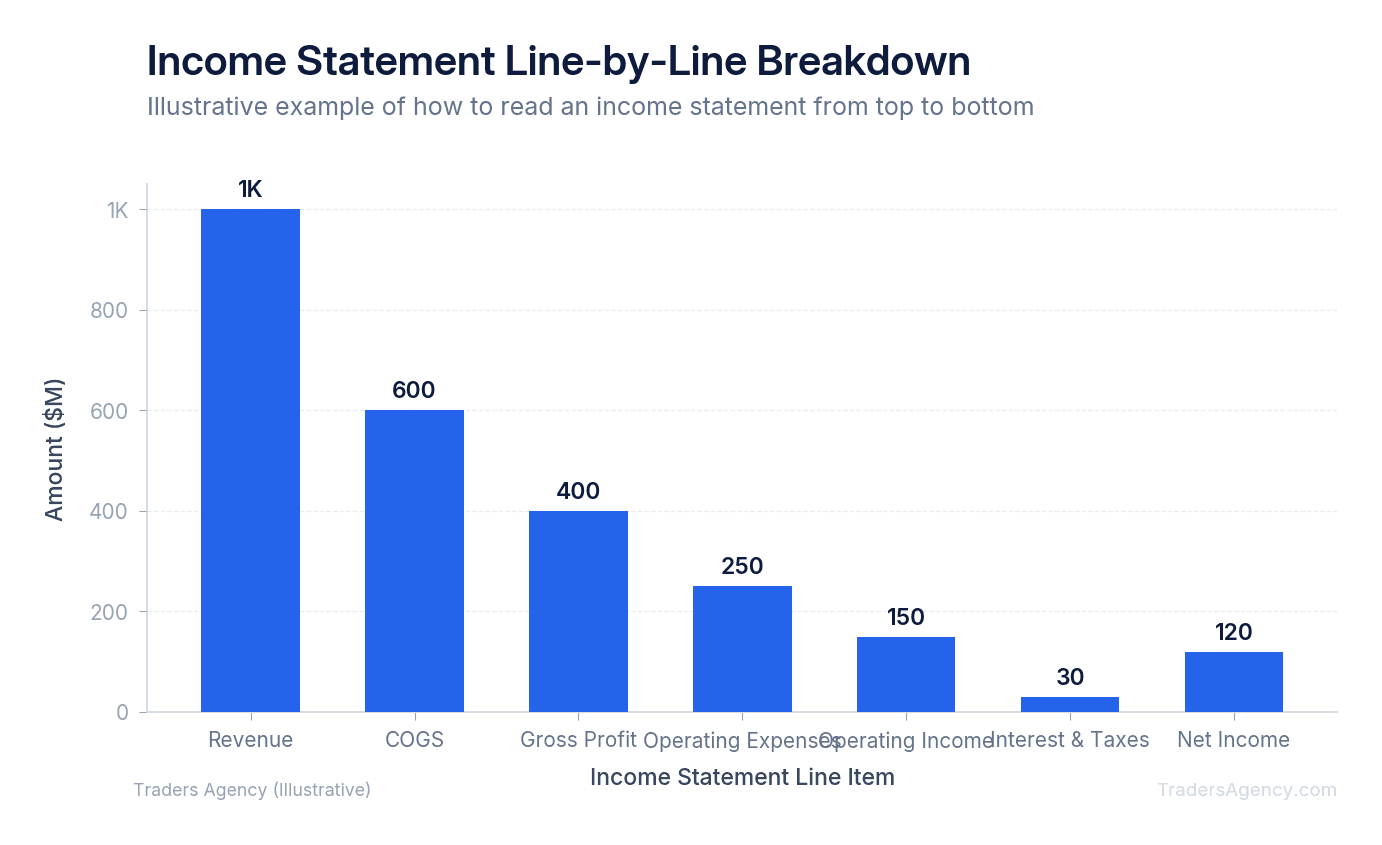
Here is exactly how we break down the most important line items using a hypothetical business we will call TechCorp.
1. Revenue (The Top Line)
Revenue is the total amount of money brought in by selling goods or services. You will often hear traders call this the "top line" because it sits at the very top of the statement. If TechCorp sells software subscriptions and they collect $1,000,000 from customers this quarter, their revenue is $1,000,000.
2. Cost of Goods Sold (COGS)
Cost of Goods Sold represents the direct costs required to produce the product. For a physical product company, this includes raw materials and factory labor. For TechCorp, this might include server hosting costs and customer support wages. If those direct costs total $400,000, we subtract that from the revenue.
3. Gross Profit
Gross profit is simply your revenue minus your COGS. In our TechCorp example, we subtract the $400,000 in costs from the $1,000,000 in revenue. This leaves us with a gross profit of $600,000. This number tells you how profitable the core product is before paying for corporate overhead.
4. Operating Expenses (OpEx)
Operating expenses are the costs of running the business that are not directly tied to making the product. This includes rent for the corporate headquarters, marketing campaigns, and executive salaries. If TechCorp spends $350,000 on these overhead items, we must deduct this from the gross profit.
5. Operating Income
Operating income is the profit made from normal business operations. We take the $600,000 gross profit and subtract the $350,000 in operating expenses. TechCorp now has an operating income of $250,000. This is a highly reliable indicator of a company's core business health.
6. Net Income (The Bottom Line)
Net income is the final profit after absolutely all expenses are paid, including taxes and interest on debt. If TechCorp pays $100,000 in taxes and interest, we subtract that from the operating income. The final net income is $150,000. Traders call this the "bottom line" because it sits at the bottom of the page.
| Line Item | Amount | Calculation |
|---|---|---|
| Revenue | $1,000,000 | Total sales collected |
| COGS | $400,000 | Direct production costs |
| Gross Profit | $600,000 | Revenue - COGS |
| Operating Expenses | $350,000 | Overhead and admin costs |
| Operating Income | $250,000 | Gross Profit - OpEx |
| Taxes & Interest | $100,000 | Government and debt obligations |
| Net Income | $150,000 | Operating Income - Taxes & Interest |
How Do You Calculate and Interpret Profit Margins?
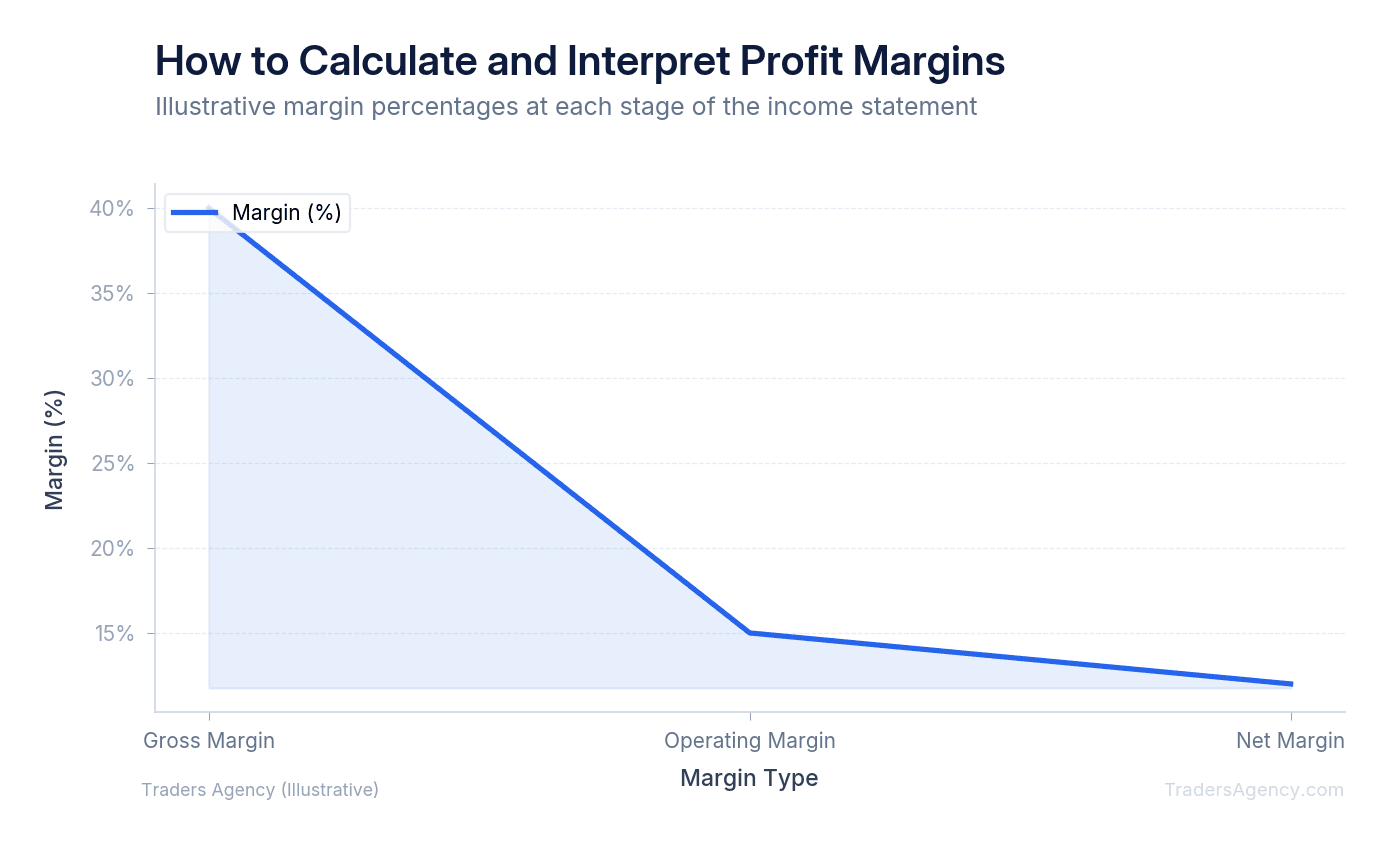
You calculate profit margins by dividing a specific profit metric by total revenue, then multiplying by 100 to get a percentage. These margins tell you how efficiently a company converts sales into actual cash. Higher margins generally indicate a stronger business model with better pricing power and cost control.
Raw numbers can be misleading. A company making $10 million in net income sounds great, but if it took $1 billion in revenue to generate that profit, the business is barely scraping by. This is why our team relies heavily on margin percentages.
Gross Margin
To find the gross margin, divide gross profit by total revenue. Using our TechCorp example, we divide the $600,000 gross profit by the $1,000,000 revenue. This gives us a gross margin of 60%. This means for every dollar TechCorp brings in, it costs them 40 cents to deliver the product, leaving 60 cents to cover overhead.
Operating Margin
To calculate the operating margin, divide operating income by total revenue. We divide TechCorp's $250,000 operating income by the $1,000,000 revenue, resulting in a 25% operating margin. This shows how efficiently the management team runs the corporate side of the business.
Net Margin
To find the net margin, divide net income by total revenue. TechCorp's $150,000 net income divided by $1,000,000 revenue equals a 15% net margin. This is the ultimate measure of profitability. Out of every dollar collected from a customer, TechCorp gets to keep 15 cents as pure profit.
| Margin Type | Formula | TechCorp Result |
|---|---|---|
| Gross Margin | Gross Profit / Revenue × 100 | 60% |
| Operating Margin | Operating Income / Revenue × 100 | 25% |
| Net Margin | Net Income / Revenue × 100 | 15% |
Want expert trading insights delivered daily?
Join thousands of traders who rely on Traders Agency for market analysis and trade ideas.
Join Traders AgencyHow Do Year-Over-Year Comparisons Help You Spot Trends?
Reading a single income statement only gives you a snapshot of one specific time period. To make smart trading decisions, you must compare the current statement to previous ones to identify growth trends. We prefer to use Year-Over-Year (YoY) comparisons rather than looking at consecutive quarters.
Comparing the fourth quarter to the third quarter can be highly misleading due to seasonal shopping habits. A retail company will almost always show massive growth in Q4 because of the holidays. Instead, you should compare Q4 of the current year to Q4 of the previous year to get an accurate picture.
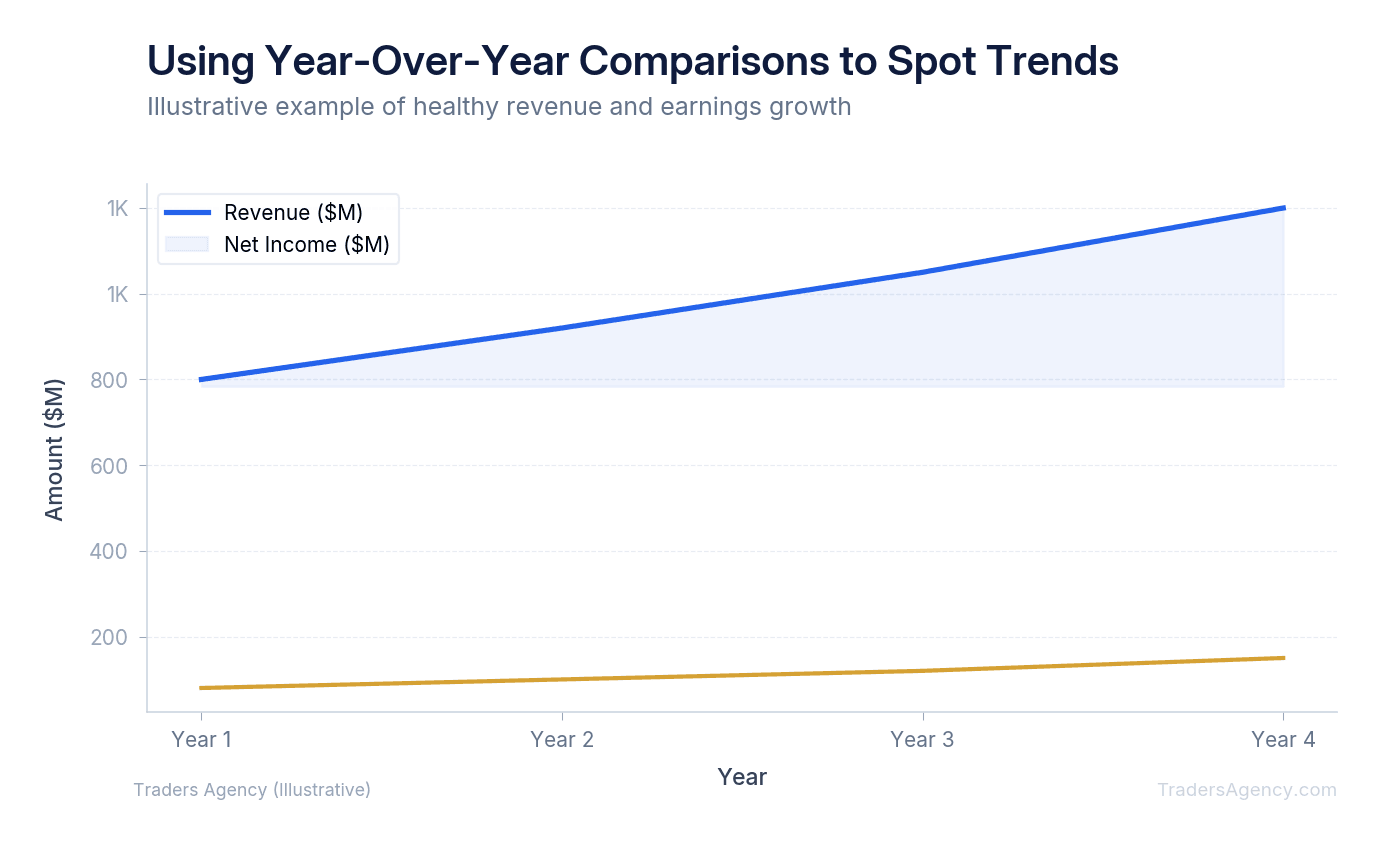
When analyzing these trends, we look for revenue and net income to grow at similar rates. If a company grows its revenue by 20% YoY but its net income only grows by 2%, that is a major warning sign. It means the company is spending way too much money to acquire those new sales, and their profit margins are shrinking.
Watch Out: Revenue growth without corresponding profit growth is a red flag. If a company's top line is expanding but margins are compressing, the business may be sacrificing profitability to chase market share. Always check that both revenue and net income are trending in the same direction.
Where Does Stock Go on an Income Statement?
Stock does not actually go on an income statement. Shares outstanding and equity are recorded on a company's balance sheet. However, the income statement does display Earnings Per Share (EPS), which divides the total net income by the number of outstanding shares to show profitability on a per-share basis.
Many beginners get confused when they cannot find stock price or share count data in the revenue and expense lines. The income statement strictly measures business operations. The balance sheet handles ownership, assets, and liabilities.
You will usually find the Earnings Per Share (EPS) listed at the very bottom of the income statement, right below net income. If a company has $10 million in net income and 5 million shares outstanding, the EPS is $2.00. Traders watch EPS closely because it directly impacts the stock's valuation.
How to Compare Income Statements Across Sectors
A common mistake new traders make is comparing the profit margins of companies in completely different industries. What qualifies as a fantastic profit margin in one sector might be a sign of terrible management in another. You must always compare a stock to its direct competitors.
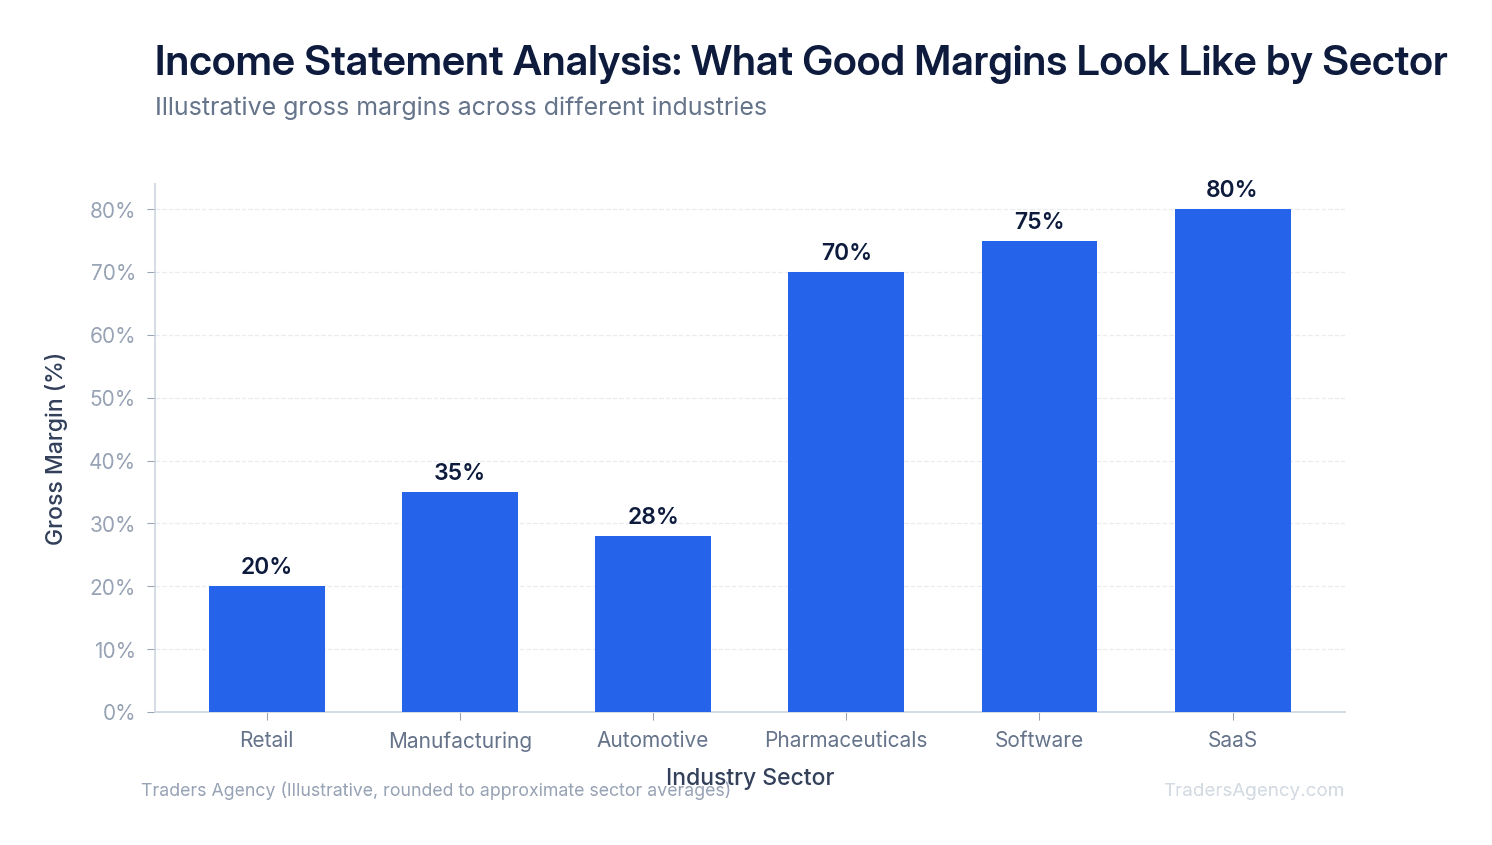
Software and technology companies typically have very high gross margins, often between 70% and 85%. Once a software program is built, it costs almost nothing to duplicate and sell it to another customer. If you see a software company with a 40% gross margin, that business is likely struggling.
Conversely, grocery stores and traditional retail operate on razor-thin margins. A successful grocery chain might have a gross margin of just 25% and a net margin of 2%. They make their money through massive sales volume rather than high markups. If you expect a retail stock to produce software-level margins, you will be disappointed.
| Sector | Typical Gross Margin | Typical Net Margin |
|---|---|---|
| Software / SaaS | 70% - 85% | 15% - 30% |
| Pharmaceuticals | 60% - 80% | 10% - 25% |
| Manufacturing | 25% - 40% | 5% - 12% |
| Retail / Grocery | 20% - 30% | 1% - 4% |
How Do You Find and Use Income Statement Data for Trading?
Now that you understand how to read an income statement, you need to know where to find accurate data. While many financial websites provide summaries, we teach our members to go straight to the official source. Public companies are required by law to file their financial statements with the government.
You can find these official documents in the SEC EDGAR database, which is a free public resource provided by the Securities and Exchange Commission.
Here are the specific steps to find a company's income statement:
- Go to the SEC EDGAR search page online at sec.gov/edgar.
- Type in the company's name or stock ticker symbol (like AAPL for Apple).
- Look for the 10-K filing (annual report) or the 10-Q filing (quarterly report).
- Open the document and click on the section titled "Item 8: Financial Statements."
- Locate the page labeled "Consolidated Statements of Operations" (this is the formal accounting name for the income statement).
Adjusting for Non-Recurring Items
When you review the income statement, look closely for "non-recurring items" or "one-time charges." These are unusual events that will not happen again, such as a massive legal settlement or the sale of a factory building.
If a company reports a net income of $50 million, but $40 million of that came from selling a warehouse, their actual operating business only made $10 million. You must mentally subtract these one-time events to understand the true earnings power of the business. Do not buy a stock based on an artificial profit spike.
Watch Out: One-time gains can inflate net income dramatically. Always check for non-recurring items like asset sales, legal settlements, or restructuring charges before drawing conclusions about a company's profitability. Strip these out to see what the business actually earns from its core operations.
Risk Management and Position Sizing
Fundamental analysis is a powerful tool, but it should never override basic risk management. Even a company with a flawless income statement can experience a severe stock price drop due to broader market conditions or unexpected news.
We recommend keeping your position sizing strictly controlled. Never allocate more than 5% of your total trading capital to a single stock, regardless of how strong their profit margins look. Always use stop losses to protect your account if the market moves against your analysis.
Remember This: An income statement tells you about the past three months. Your risk management plan protects you for the next three months. Strong fundamentals reduce risk, but they never eliminate it. Size your positions accordingly.
Our education team publishes new strategy guides and market analysis every week. If you found this breakdown helpful, there is much more where it came from.
Want expert trading insights delivered daily?
Join thousands of traders who rely on Traders Agency for market analysis and trade ideas.
Join Traders AgencyKey Takeaways
- The income statement follows a specific top-down structure: revenue minus cost of goods sold equals gross profit, minus operating expenses equals operating income, minus taxes and interest equals net income.
- A stock can drop 10% or more after earnings even when a company reports billions in profit, which is why understanding the context behind the numbers matters more than the headline figure.
- Year-over-year comparisons reveal whether growth is real or a one-time event, making them more useful than a single quarter read in isolation.
- Income statement analysis varies by sector, so comparing margins across industries without adjusting for sector norms will produce misleading conclusions.
- Risk management applies even when fundamentals look strong: limit single-stock exposure to 5% of total trading capital and always use stop losses regardless of how healthy the profit margins appear.
DISCLAIMER: Traders Agency does not offer financial advice. The information provided is for educational purposes only and should not be considered financial advice. Traders Agency is not responsible for any financial losses or consequences resulting from the use of the information provided. Trading carries inherent risks and may not be suitable for all individuals. You are advised to conduct your own research and seek personalized advice before making any investment decisions, recognizing the potential risks and rewards involved.
See more from Traders Agency on Google
Make us a preferred source and our market analysis will appear more prominently in your Google Search, Top Stories, and AI results.
Add to Preferred Sources