
If you've ever stared at your trading platform and felt overwhelmed by the flashing numbers next to your options chain, you're not alone. We see this happen all the time when traders transition from buying simple stock shares to trading derivative contracts. Learning how to read Greeks in options is the key to making sense of those numbers, and by the end of this guide, you'll know how to set up your platform, evaluate individual trades, and manage your overall portfolio risk using these essential metrics.
What Are the 5 Option Greeks?
Bottom Line: The Greeks are not just abstract math: they are a practical dashboard that tells you exactly how your options position will behave as price, time, and volatility shift. Reading them correctly at both the individual trade level and the portfolio level is what separates reactive traders from prepared ones. Set up your platform columns, check your exposure before every trade, and pair the Greeks with disciplined position sizing to get real use out of them.
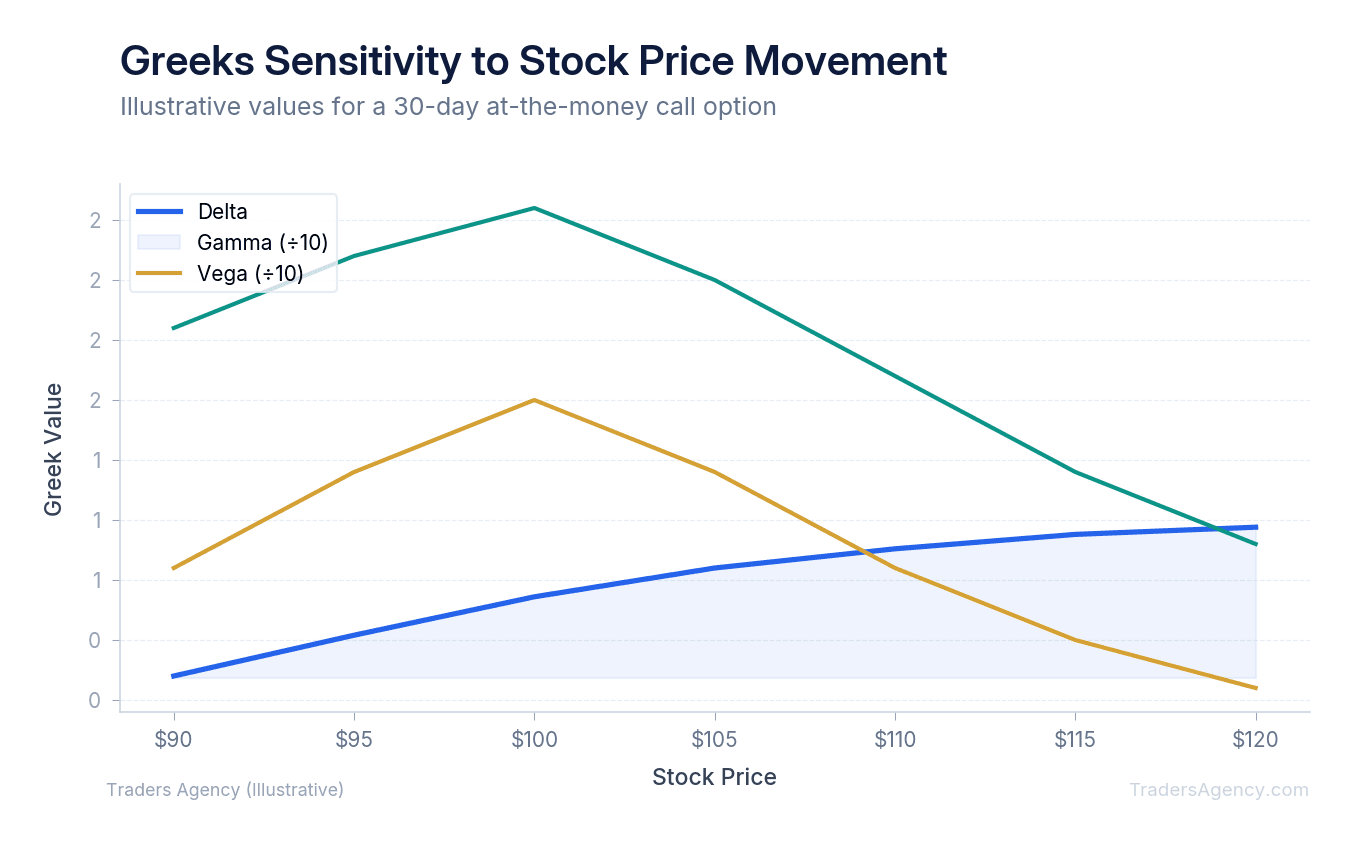
The five option Greeks are Delta, Gamma, Theta, Vega, and Rho. Together, they measure an option contract's sensitivity to market variables like price movement, time, volatility, and interest rates.
Our team recommends memorizing these five metrics before placing your next trade. Think of them like the dashboard of a car. Delta is your speedometer, Gamma is your acceleration, Theta is your fuel gauge slowly emptying, and Vega is your suspension reacting to bumpy roads.
Key Concept: The Greeks are mathematical risk measures that tell you exactly how an option's price will change based on stock movement, time passing, volatility shifting, and interest rate changes. Master these five numbers and you'll have a clear read on any options position.
Here's what each Greek measures:
- Delta: How much the option price changes for a $1.00 move in the underlying stock.
- Gamma: How much Delta itself changes for that same $1.00 move. This is the rate of change of your directional exposure.
- Theta: How much value the option loses each day due to time passing.
- Vega: How much the option price changes for a 1% shift in implied volatility.
- Rho: How much the option price changes for a 1% move in interest rates.
Vega primarily tracks changes in implied volatility rather than the stock's actual price movement. It reflects market fear and uncertainty. When traders panic, implied volatility spikes, and higher IV causes option premiums to inflate rapidly. Vega tells you how much that inflation affects your position.
Rho is the least discussed Greek because interest rates typically move slowly. During periods of aggressive central bank rate hikes, however, Rho becomes a measurable factor for long-term options like LEAPS. For technical documentation on how these values are calculated, the CBOE provides excellent resources on options pricing models.
How Do You Read Greeks on an Options Chain?
You read Greeks by customizing your trading platform's options chain to display Delta, Gamma, Theta, and Vega as columns next to the bid and ask prices. This setup lets you instantly evaluate the risk and potential reward of any strike price before entering a trade.
Most default broker layouts hide these metrics. We teach our members to manually adjust their column settings immediately upon opening a new brokerage account. On major platforms like ThinkOrSwim, Tastytrade, or Interactive Brokers, you can customize your options chain by right-clicking the column headers.
We suggest arranging your columns in this exact order:
| Column Position | Metric | Purpose |
|---|---|---|
| 1 | Bid | Current selling price |
| 2 | Ask | Current buying price |
| 3 | Volume | Daily trading activity |
| 4 | Open Interest | Total outstanding contracts |
| 5 | Delta | Directional sensitivity |
| 6 | Theta | Daily time decay |
| 7 | Gamma | Rate of Delta change |
| 8 | Vega | Volatility sensitivity |
This specific layout groups your pricing data together and your risk metrics together. It trains your eyes to scan from left to right, evaluating the cost first and the mathematical risk second.
When you look at your customized options chain, you'll see positive and negative numbers. A positive Delta (like 0.50) means the option gains value when the stock goes up. A negative Theta (like -0.05) means the option loses $5.00 of real money per contract every single day.
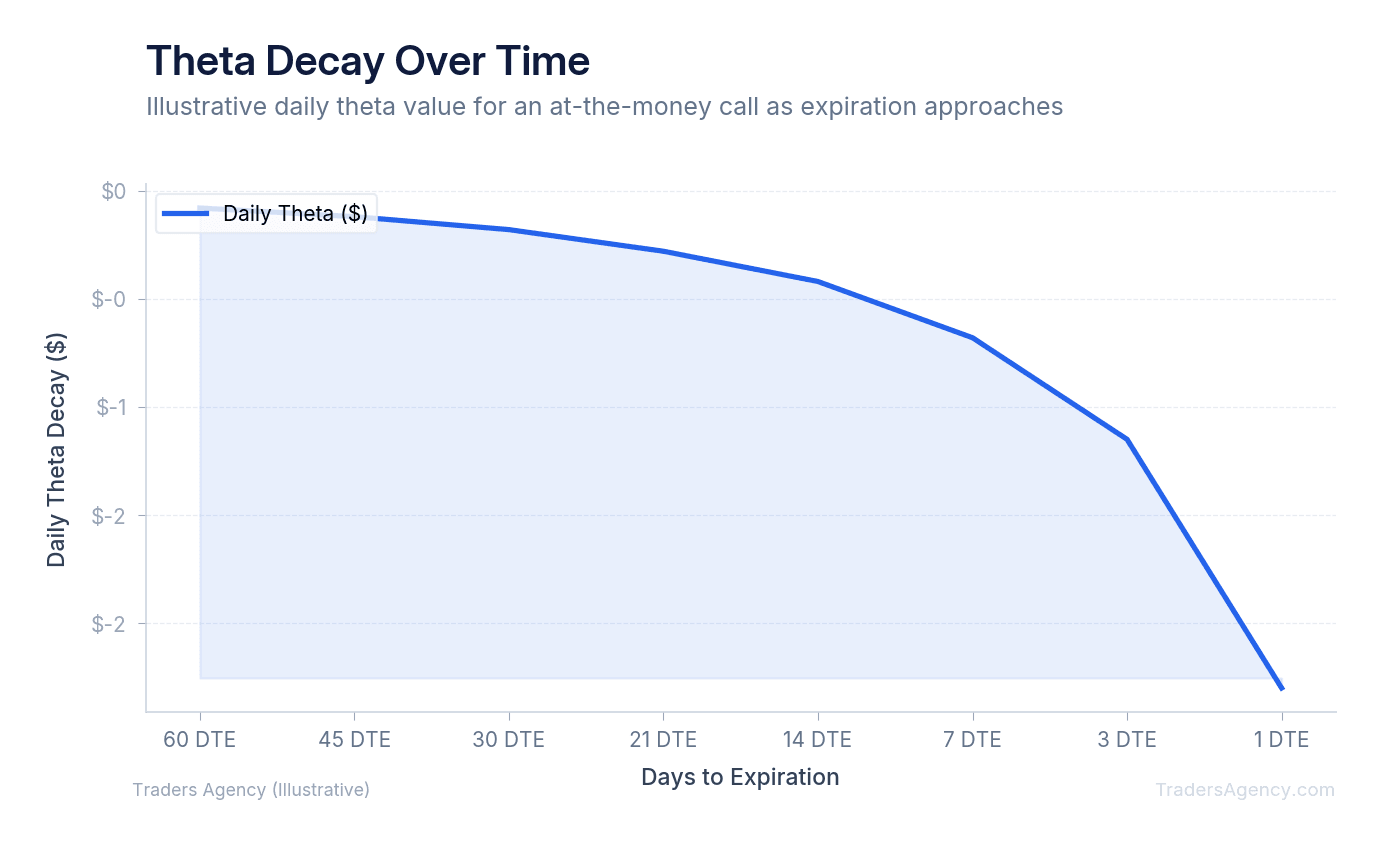
Many traders use an options Greeks calculator to simulate these changes before risking capital. By plugging in different stock prices and dates, you can forecast exactly how your position will behave. We prefer to run these simulations on every single trade.
Interpreting the Risk Graph Alongside Your Greeks
A risk graph is a visual representation of your trade's potential profit and loss across different stock prices and timeframes. It translates the raw Greek numbers into a clear, visual profit zone.
When you combine your Greeks with a standard risk graph, you can see exactly where your trade makes money. The slope of the line on your graph represents your Delta. The curvature of that line represents your Gamma.
As time passes, the profit line on your graph will shift. This shift represents Theta decay in action. You'll literally see the line drop lower on the profit axis as expiration approaches.
Most platform risk graphs display two distinct lines. The first line shows your profitability today, based on current Greeks. The second line shows your profitability at expiration, when all time value has decayed to zero.
Key Concept: The gap between the "today" line and the "expiration" line on your risk graph represents your remaining Theta and Vega exposure. As days pass, the "today" line slowly morphs into the "expiration" line. Study this gap to understand exactly how much time value you're paying for or collecting.
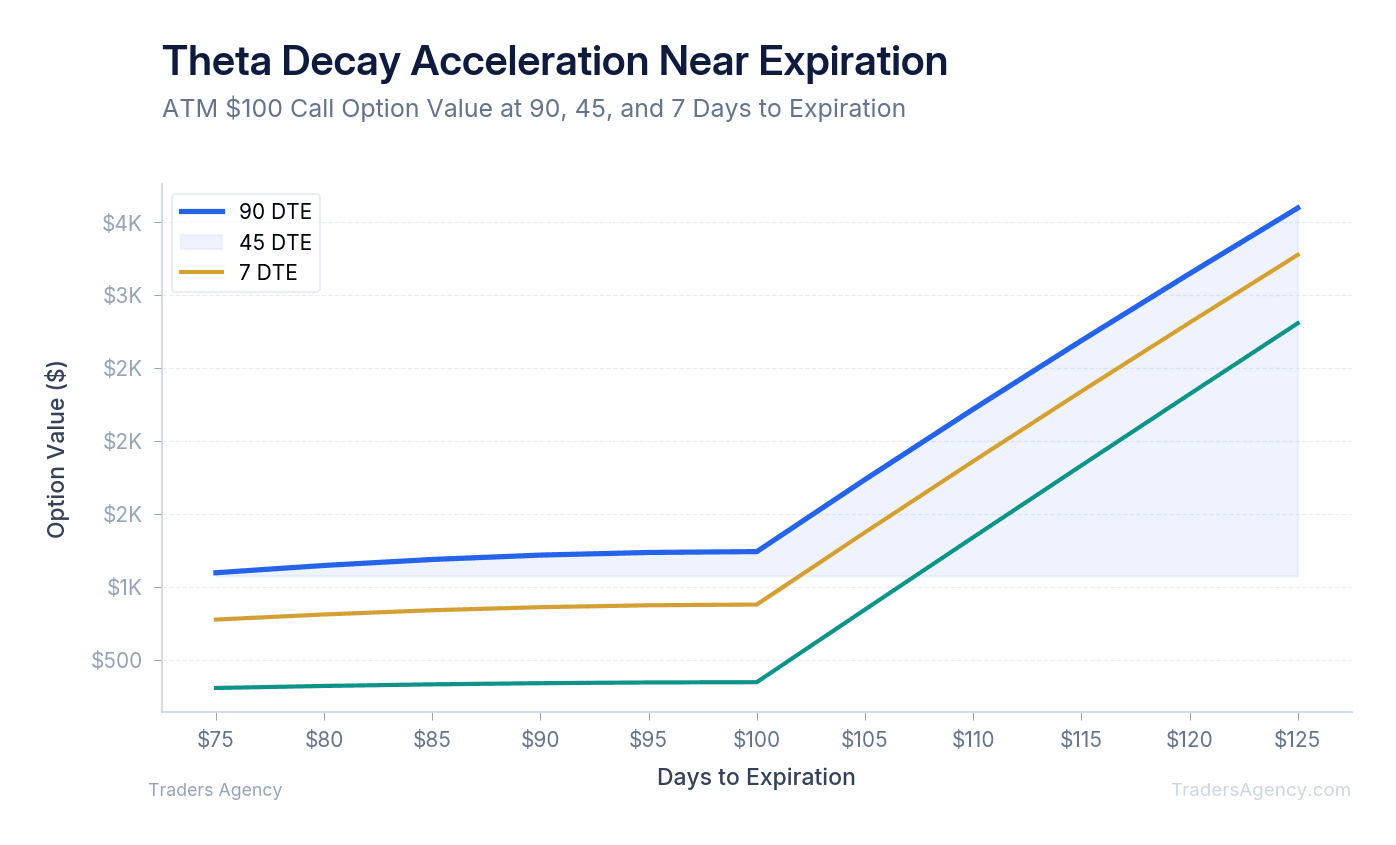
We always check the risk graph to make sure the visual representation matches our mathematical expectations. If the Greeks suggest a low-risk trade but the graph shows a steep drop-off in profitability, you've likely misread the data.
Want expert trading insights delivered daily?
Join thousands of traders who rely on Traders Agency for market analysis and trade ideas.
Join Traders AgencyStep-by-Step Example: Setting Up a Covered Call
Here's a practical example of how to read Greeks using a standard covered call strategy. We prefer to use highly liquid stocks for these examples.
Imagine you own 100 shares of Apple (AAPL), currently trading at $175.00. You want to generate income, so you decide to sell a call option expiring in 30 days.
| Parameter | Value |
|---|---|
| Stock | AAPL at $175.00 |
| Shares Owned | 100 |
| Call Sold | $180.00 strike, $2.50 premium |
| Delta of Short Call | 0.30 (approx. 30% probability ITM) |
| Theta of Short Call | -0.04 (you collect $4.00/day) |
| Max Profit | $750 ($250 premium + $500 stock appreciation) |
| Breakeven | $172.50 (stock price minus premium collected) |
- Select the Strike Price: Look at the options chain and focus on the $180.00 strike price. The premium is $2.50 (or $250 total per contract).
- Check the Delta and Theta: The Delta is 0.30, meaning there's roughly a 30% mathematical probability the option expires in the money. The Theta is -0.04, meaning the buyer of this option loses $4.00 a day, which means you collect that value as the seller.
- Execute the Trade: Sell one contract of the $180.00 call. Your maximum gain is the $250 premium plus the $5.00 per share capital appreciation if AAPL reaches $180.00. Your breakeven point on the stock drops by the $2.50 premium collected.
- Monitor the Outcome: If AAPL stays at $175.00, Theta works in your favor. The option slowly loses value, and you keep the premium. If AAPL spikes to $185.00, your short call's negative Delta offsets your stock's positive Delta, capping your gains at the $180.00 strike.
- Plan Your Exit Strategy: We never hold short options all the way to expiration. Our team prefers to buy back the short call when it reaches 50% of its maximum profit. In this AAPL example, if the option value drops from $2.50 to $1.25, we buy it back. This locks in a $125 profit and frees up capital for the next trade, while eliminating the Gamma risk associated with expiration week.
What Is the Difference Between Position Greeks and Individual Option Greeks?
This distinction trips up many new traders. Individual option Greeks measure the risk of a single contract, while position Greeks multiply those individual metrics by the total number of contracts you hold.
If you buy an option with a Delta of 0.50, the individual Greek is 0.50. But if you buy 10 contracts, your position Delta is 5.00.
Position Greeks tell you your actual dollar risk. A position Delta of 5.00 means your account balance will increase by $500 for every $1.00 the underlying stock moves upward, because each contract controls 100 shares.
The same multiplier effect applies to Vega. If a single contract has a Vega of 0.15, buying 20 contracts gives you a position Vega of 3.00. This means if implied volatility drops by just 5 percentage points, your position loses $1,500 in value.
Watch Out: Always configure your trading platform to show both individual and position Greeks. We see traders blow up their accounts because they look at a small individual Greek and ignore their massive position size. A Delta of 0.10 looks harmless until you realize you're holding 50 contracts.
How Do You Manage Greek Exposure Across an Entire Options Portfolio?
Once you master individual trades, you need to learn portfolio-level Greek management. This involves aggregating the Greeks from every single options position in your account to understand your total market exposure.
If you have five different bullish trades, your portfolio Delta might be dangerously high. We teach our members to beta-weight their portfolio Delta to a major index like the SPY.
Beta-weighting translates all your different stock and option positions into one standardized metric. It tells you exactly how much money your entire portfolio will make or lose if the S&P 500 moves by one point.
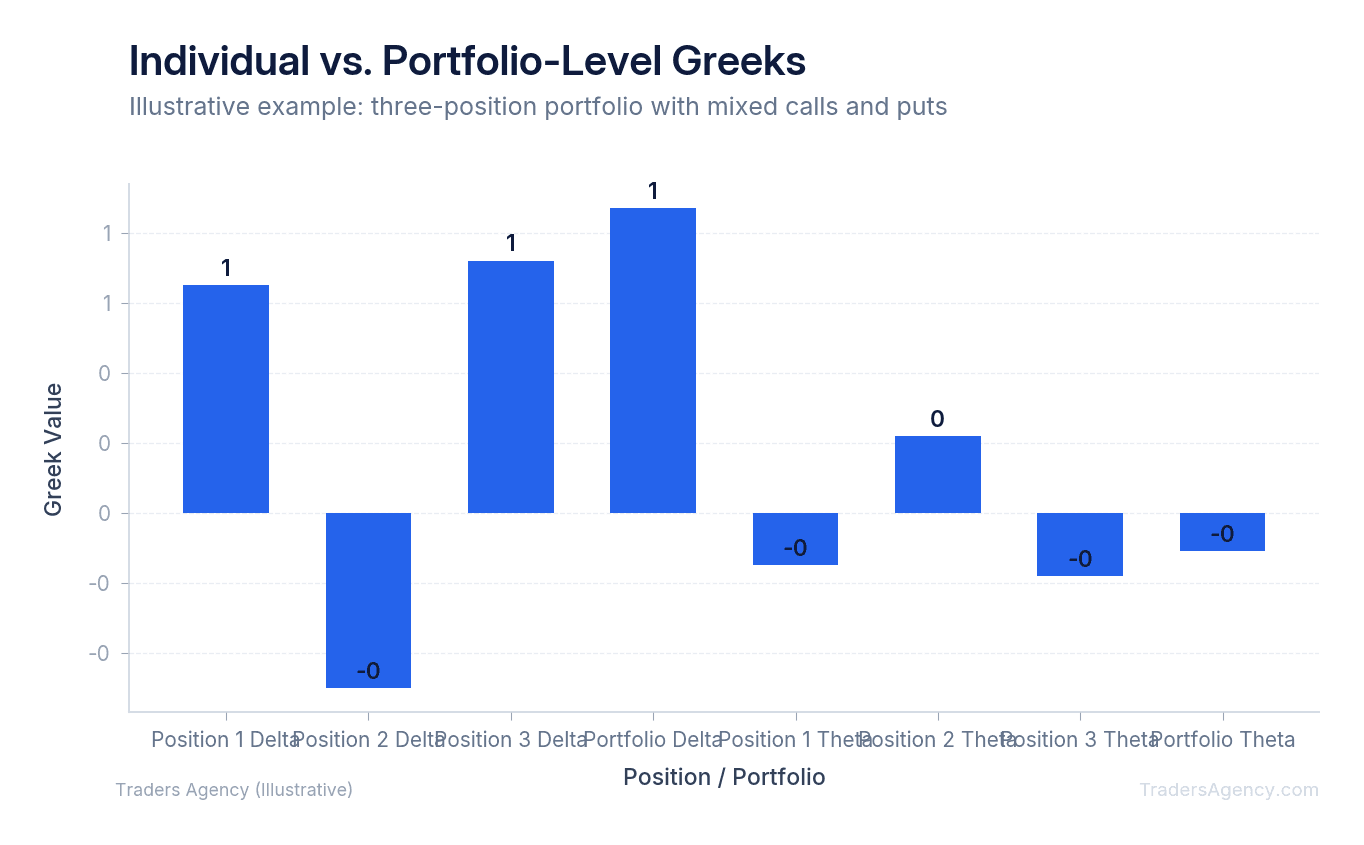
By monitoring your aggregate Greeks, you can deploy specific hedging strategies to manage risk. If your portfolio Delta gets too positive, you might buy a put option on an index to bring your overall exposure back to neutral. This keeps your account stable during sudden market corrections.
Portfolio Theta is another metric we watch closely. A positive portfolio Theta means your account generates income from time decay every single day. We aim to keep our portfolio Theta positive by selling premium, which offsets the natural time decay of any long options we hold.
If you see a negative portfolio Theta, your account is bleeding cash daily. You must rely purely on directional stock movement to overcome this mathematical headwind.
When Should You Avoid Relying on Option Greeks?
Greeks are outputs of theoretical pricing models, not absolute guarantees. They're based on standard models like Black-Scholes that assume continuous trading and log-normal price distributions. During extreme market events, actual price behavior can deviate significantly from these assumptions. Here are three scenarios where we recommend looking beyond the Greeks:
- Expiration Week: Gamma risk explodes during the last five days of a contract. A tiny stock move can flip your Delta from 0.10 to 0.90 instantly.
- Illiquid Markets: If a stock has wide bid-ask spreads, the Greeks displayed on your screen are based on the midpoint price, which you likely cannot actually trade at.
- Pending Earnings Announcements: Vega will remain artificially high right before earnings, making Theta calculations completely unreliable until the event passes.
Another time to look beyond the Greeks is when dealing with dividend-paying stocks. Standard Greek values on your dashboard don't directly warn you about early assignment risk. If a stock pays a large dividend, call options with a Delta near 1.00 are at high risk of early exercise by the buyer. You must track the ex-dividend date manually. No single Greek metric on your dashboard will flash a warning sign about an impending dividend assignment.
Risk Warning: Always use standard risk management alongside your Greeks. We recommend risking no more than 2% to 5% of your total account capital on any single options trade, regardless of how favorable the mathematical probabilities look.
The Greeks are powerful tools that give you a real edge when reading your options dashboard. But they work best when combined with disciplined position sizing, a clear exit plan, and an honest assessment of market conditions. Set up your platform columns, study the numbers before every trade, and always check your portfolio-level exposure. That's the approach we use every single day.
Want expert trading insights delivered daily?
Join thousands of traders who rely on Traders Agency for market analysis and trade ideas.
Join Traders AgencyKey Takeaways
- The five option Greeks are Delta, Gamma, Theta, Vega, and Rho, and each one measures a specific sensitivity: price movement, rate of Delta change, time decay, volatility, and interest rates respectively.
- Delta tells you how much an option's price moves for every $1.00 change in the underlying stock, making it the most immediately actionable Greek for evaluating directional risk on a single trade.
- Gamma measures how quickly Delta itself changes, which matters most when a position moves close to the strike price and your directional exposure can shift rapidly.
- Portfolio-level Greek management requires checking your combined Delta, Theta, and Vega exposure across all positions, not just evaluating each trade in isolation.
- The article recommends risking no more than 2% to 5% of total account capital on any single options trade, regardless of how favorable the Greeks appear.
DISCLAIMER: Traders Agency does not offer financial advice. The information provided is for educational purposes only and should not be considered financial advice. Traders Agency is not responsible for any financial losses or consequences resulting from the use of the information provided. Trading carries inherent risks and may not be suitable for all individuals. You are advised to conduct your own research and seek personalized advice before making any investment decisions, recognizing the potential risks and rewards involved.
See more from Traders Agency on Google
Make us a preferred source and our market analysis will appear more prominently in your Google Search, Top Stories, and AI results.
Add to Preferred Sources