
Nothing ruins a good thesis faster than an earnings restatement. One filing drops, the stock gaps down 30%, and there's no chance to manage the position. We've watched too many traders get caught on the wrong side of that headline, which is why we teach earnings quality analysis as a defensive skill first and an edge second.
Accounting red flags are warning signs in a company's financial statements that suggest reported earnings don't reflect real economic performance. They show up as gaps between reported profit and actual cash generated, unusual revenue patterns, or aggressive classification of expenses. Spotting them early can mean exiting a position months before the market catches on.
In this guide, we'll walk you through the quantitative tools our team uses to catch these signals before they become news: the accrual ratio, cash-to-earnings divergence, common revenue recognition tricks, and the Beneish M-score. By the end, you'll know how to pull the raw numbers yourself from a 10-K or 10-Q, calculate two professional-grade detection metrics, and interpret them correctly by sector.
What Are Accounting Red Flags in Financial Statements?
Bottom Line: Accounting red flags rarely appear out of nowhere: they build quietly through rising accruals, cash-earnings gaps, and revenue timing tricks well before a restatement hits the tape. Traders who check the accrual ratio and Beneish M-score against sector norms can spot deteriorating earnings quality months ahead of the market and exit before the headline risk materializes.
Accounting red flags are inconsistencies between a company's reported earnings and the underlying economic reality of its business, most often visible in the gap between net income and operating cash flow. They appear across all three statements, and recognizing them early is a core skill in financial statement analysis.
These signals matter because reported earnings involve judgment. Management chooses when to recognize revenue, how to classify expenses, and how to estimate reserves. Most of the time those choices are reasonable. Sometimes they're stretched to hit a number.
| Statement | What the Red Flags Look Like |
|---|---|
| Balance sheet | Ballooning receivables, inventory growing faster than sales, debt reclassified to keep leverage ratios looking clean |
| Income statement | One-time gains dressed up as recurring revenue, operating expenses pushed below the operating line |
| Cash flow statement | Operating cash flow flattening while net income rises, heavy reliance on working capital swings |
We weight cash flow statement red flags most heavily. Cash is significantly harder to manipulate than accruals, so when the cash statement and the income statement disagree, we trust the cash.
Key Concept: Earnings are an opinion. Cash is a fact. Every technique in this guide is ultimately a way of measuring how far a company's opinion has drifted from the facts.
How Do You Calculate and Interpret the Accrual Ratio?
The accrual ratio measures the portion of reported earnings that comes from non-cash accounting adjustments rather than actual cash flow. A rising accrual ratio over consecutive quarters is one of the most tested predictors of future earnings disappointments and downward analyst revisions.
Here's the calculation we use, step by step:
- Step 1: Pull net income from the income statement in the 10-Q or 10-K.
- Step 2: Pull operating cash flow from the top section of the cash flow statement in the same filing.
- Step 3: Pull total assets from the balance sheet. Average total assets across the period also works, as long as you stay consistent.
- Step 4: Apply the formula. Accrual Ratio = (Net Income − Operating Cash Flow) ÷ Total Assets.
- Step 5: Repeat for the last eight quarters so you can see the trend rather than a single snapshot. The trend is the signal.
Reading the Number
| Accrual Ratio | Interpretation |
|---|---|
| Below 1% | Generally healthy, earnings are cash-backed |
| 1% to 3% | Normal range for most industries, worth monitoring |
| 3% to 5% | Elevated, warrants a closer look at receivables and inventory |
| Above 5% | A serious red flag requiring investigation before you touch the stock |
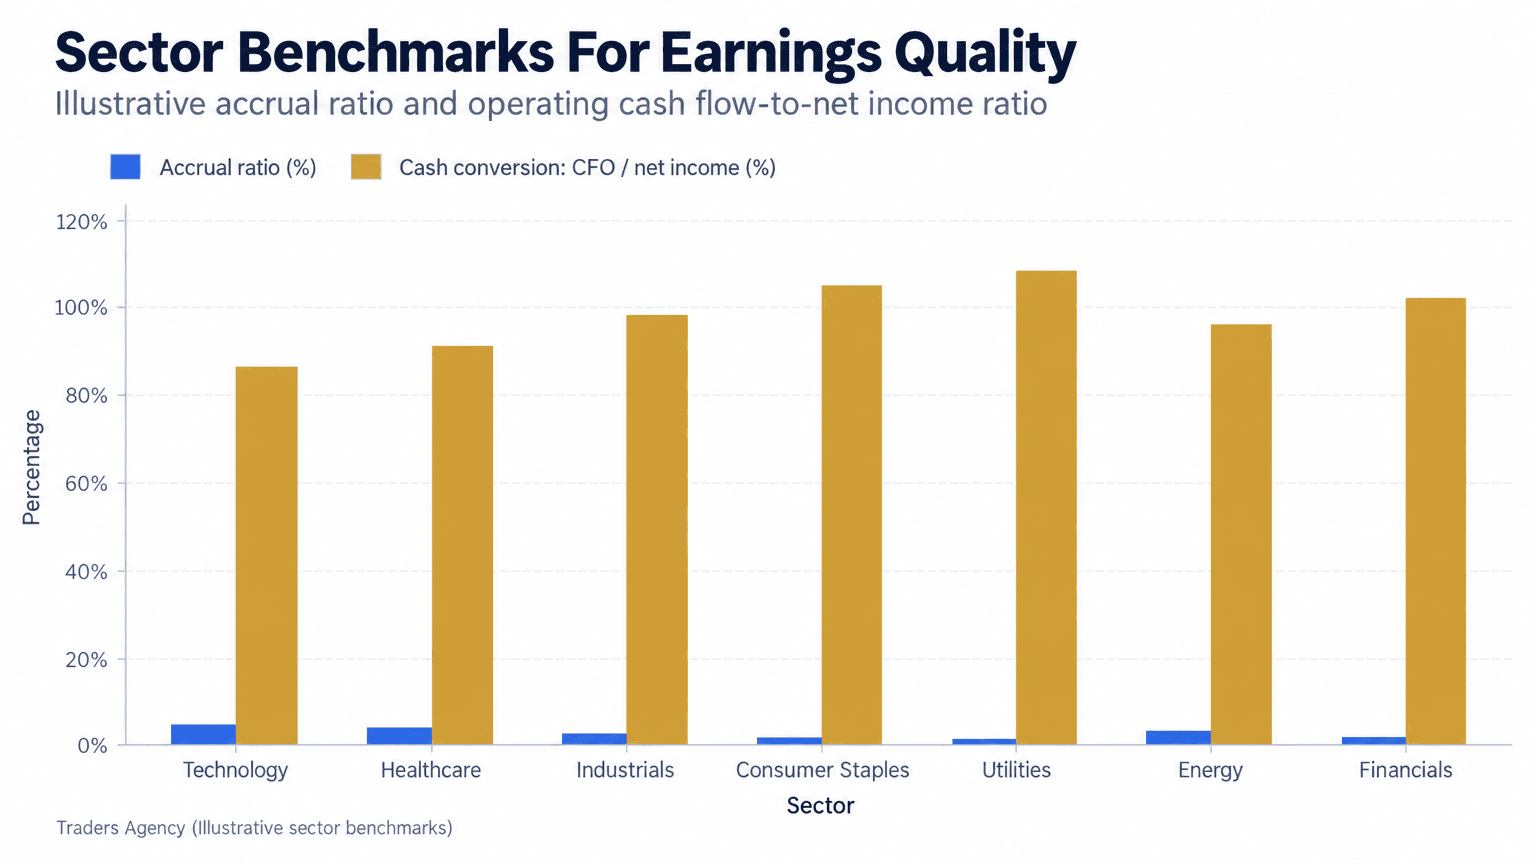
Notice that technology and healthcare companies naturally run higher accrual ratios than utilities or consumer staples. Software firms recognize revenue on contracts before cash arrives, and biotech firms treat research costs differently than a stable, capital-intensive utility. A 4% accrual ratio might be a genuine warning for a utility and completely normal for a growth-stage software company.
Watch Out: Sector context is not optional here. Comparing a software company's accrual ratio to a utility's is the fastest way to generate false alarms and talk yourself out of good positions.
Cash-to-Earnings Divergence as a Warning Sign
Cash-to-earnings divergence occurs when reported net income keeps climbing while operating cash flow flattens or declines. This gap is often the earliest visible symptom of earnings management, often visible several quarters before analysts or the broader market react.
Walking Through an Example
Say a mid-cap industrial company reports the following pattern across eight consecutive quarters:
| Metric | Starting Point | Eight Quarters Later |
|---|---|---|
| Operating cash flow conversion (OCF ÷ net income) | 112% | 68% |
| Accrual ratio | 0.5% | 6.2% |
| Reported net income | Growing | Still growing every quarter |
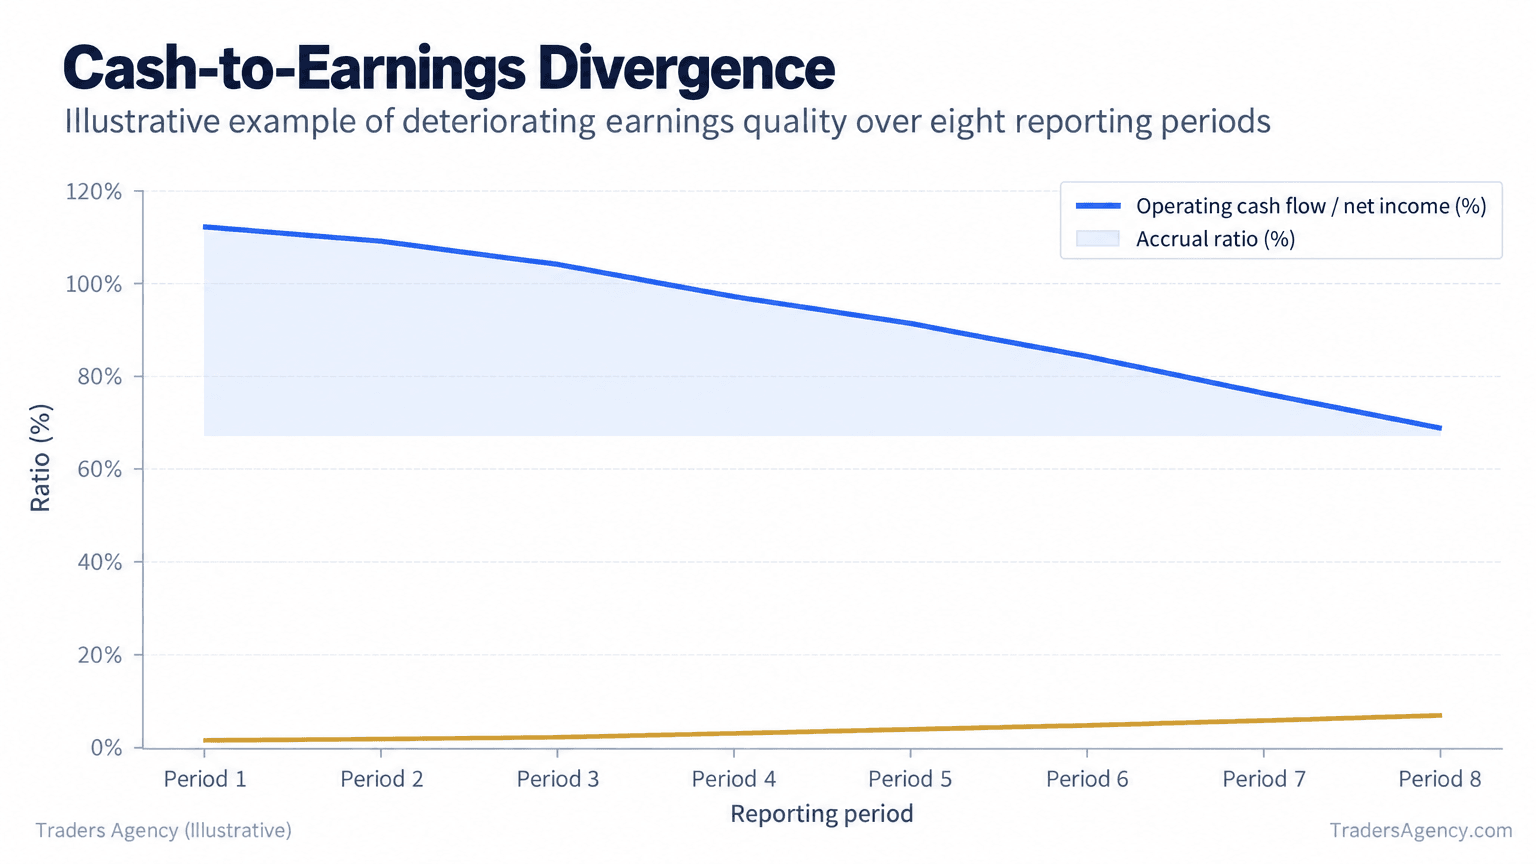
That's the setup that gets traders hurt. Net income looks fine on the headline, so the stock keeps grinding higher while the quality of those earnings quietly erodes underneath.
A cash conversion ratio above 100% means the company collects more cash than it books as profit, which is the healthiest pattern you can find. Once that ratio drops meaningfully below 80% while net income keeps rising, we treat it as a serious red flag. We pull this data straight from the cash flow statement and income statement in each quarterly filing, and we track it on a rolling eight-quarter basis rather than reacting to any single period.
Want expert trading insights delivered daily?
Join thousands of traders who rely on Traders Agency for market analysis and trade ideas.
Join Traders AgencyRevenue Recognition Tricks Companies Use to Inflate Earnings
Revenue recognition manipulation is one of the most common categories of SEC enforcement action against issuers, and the techniques repeat themselves decade after decade. Companies pull forward future sales, book revenue before delivery is complete, or record revenue on transactions with side agreements that effectively reverse the sale.
These are the four patterns we screen for most often:
- Channel stuffing: shipping excess inventory to distributors near quarter-end to book revenue early.
- Bill-and-hold arrangements: recognizing revenue before the customer actually receives the goods.
- Round-tripping: two companies exchange similar-value transactions to inflate both top lines.
- Percentage-of-completion abuse: overestimating project completion on long-term contracts to accelerate revenue recognition.
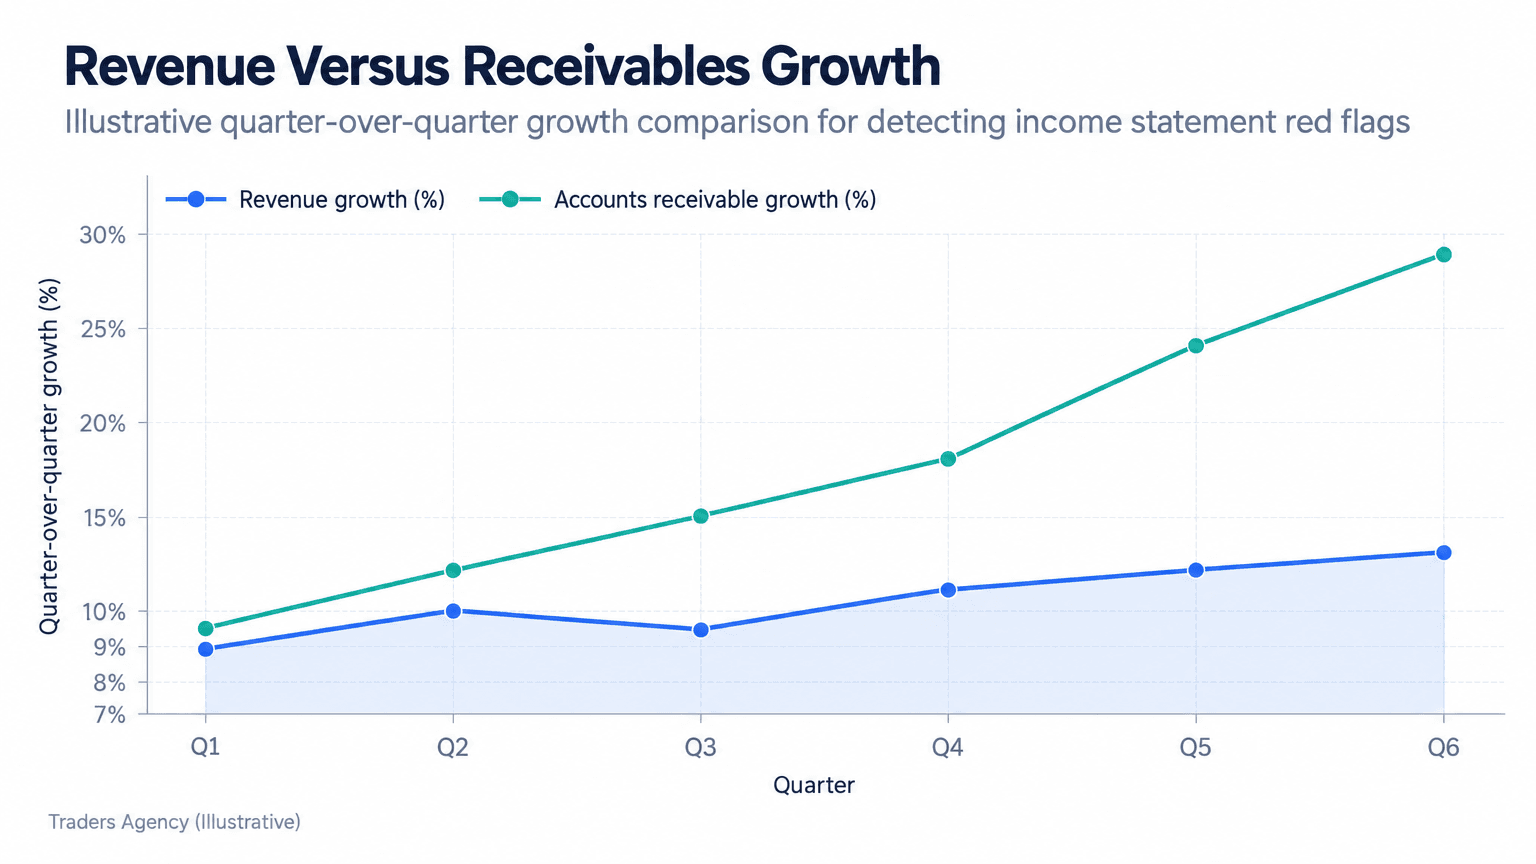
The single most useful screen for all four is comparing accounts receivable growth against revenue growth. If receivables consistently grow faster than sales, either customers aren't paying or the "sales" aren't real yet. Both outcomes end the same way.
Why Does Capitalizing vs Expensing Matter?
Whether a company capitalizes a cost (spreading it over years as an asset) or expenses it immediately (hitting current earnings) has an enormous effect on reported profitability. This is one of the more subtle categories of red flags because it's technically permitted under GAAP, just applied aggressively.
Watch for companies that capitalize costs their peers expense: software development, contract and customer acquisition costs, or routine maintenance are the usual suspects. Doing so inflates current earnings and total assets at the same time while pushing the true cost into future periods.
Our practical test is simple. Compare the company's capitalization policy footnote against two or three direct competitors from the same filing period. If one company capitalizes what the others expense, its margins will look artificially superior, and that gap tends to close eventually, usually through a write-down that nobody has modeled.
How Do You Use the Beneish M-Score to Detect Manipulation?
The Beneish M-score is a statistical model built from eight financial ratios that estimates the probability a company has manipulated its earnings. It remains one of the most widely used quantitative tools in forensic accounting work, and it's straightforward enough to build in a spreadsheet.
The eight inputs are the Days Sales in Receivables Index, Gross Margin Index, Asset Quality Index, Sales Growth Index, Depreciation Index, SGA Index, Leverage Index, and Total Accruals to Total Assets. Each one compares the current period against a prior baseline, so you need two years of filings to run it.
Key Concept: An M-score above −1.78 signals an elevated probability of earnings manipulation. Scores below that threshold fall in the normal range. Because the score is negative, "above" means closer to zero.
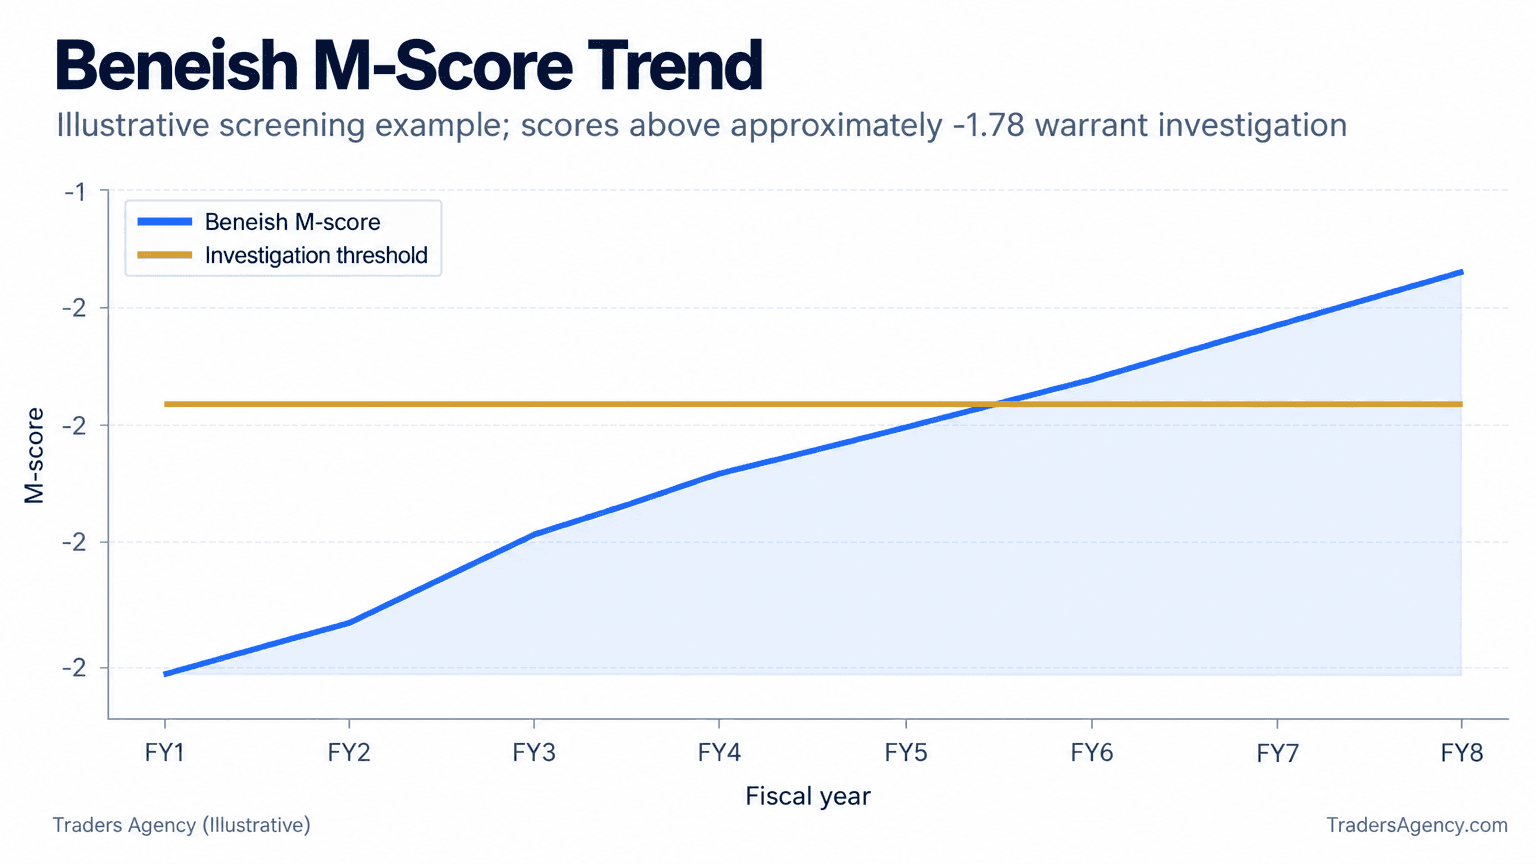
In the illustration above, an M-score climbing from −2.45 to −1.42 and crossing the −1.78 line would have flagged deteriorating earnings quality well before any price weakness showed up on the chart. We calculate it quarterly for any position where the accrual ratio is already elevated, and we treat it as a confirmation tool rather than a standalone trigger.
How Do Accounting Red Flags Differ Across Sectors?
Red flags don't carry equal weight across industries, because different business models generate different natural accrual and cash flow patterns. A metric that screams manipulation in a utility can be routine growth accounting in software or biotech.
- Utilities and consumer staples: tight, predictable cash conversion because revenue is recurring and receivables are short-cycle. Any accrual buildup here deserves immediate attention.
- Technology and healthcare: naturally higher accrual ratios from R&D treatment, deferred revenue accounting, and longer contract cycles.
- Financials: require an entirely separate framework, since loan loss reserves and mark-to-market accounting distort a standard accrual ratio calculation.
This is why we always benchmark a company's accrual ratio and cash conversion against direct sector peers rather than a market-wide average. A troubled retailer's financials look nothing like a troubled pharmaceutical company's.
What Are the Three Golden Rules of Accounting?
The three golden rules come from traditional double-entry bookkeeping, and they govern how debits and credits get recorded across personal, real, and nominal accounts:
- Personal accounts: debit the receiver, credit the giver.
- Real accounts: debit what comes in, credit what goes out.
- Nominal accounts: debit expenses and losses, credit income and gains.
Worth understanding, though, is that most of the red flags in this guide don't involve broken double-entry mechanics at all. The books still balance. The distortion comes from timing choices, estimates, and how a transaction gets classified once it enters the ledger. You don't need to be an accountant to trade well, but knowing where those classification decisions get made tells you where to look.
Practical Application: When to Act on Red Flags
We use these tools as filters, not automatic sell signals. A single elevated accrual ratio doesn't mean fraud. It means "look closer."
When to Escalate a Position Review
- Accrual ratio above 5% for two or more consecutive quarters
- Beneish M-score crossing above −1.78
- Receivables growth outpacing revenue growth by a wide margin for three straight quarters
- Auditor changes or late filings appearing alongside any of the above
Our position sizing rule is straightforward: we size down, not out, when a single red flag appears, and we exit entirely when two or more converge. That keeps us from abandoning good positions on noise while still protecting capital when the evidence stacks up.
Watch Out: The four mistakes we see most often are treating one quarter of divergence as confirmed manipulation, comparing accrual ratios across unrelated sectors, ignoring footnotes on capitalization policy changes, and relying on the M-score without checking the cash flow statement yourself.
Pull your raw data from the 10-K, 10-Q, and 8-K filings on EDGAR, the SEC's public filing database. That's the primary source behind every ratio in this guide, and it's free.
Frequently Asked Questions
What are the five types of errors in accounting?
Errors of omission, errors of commission, compensating errors, errors of principle, and errors of duplication. Only some relate to intentional manipulation. Most are simple bookkeeping mistakes that don't qualify as red flags.
What are red flags when hiring a CPA?
Reluctance to sign returns, guaranteed refund promises, fee structures based on refund size, and no verifiable PTIN. These are unrelated to earnings quality analysis, but they follow the same "look for the inconsistency" principle.
What are the top ten accounting red flags?
Rising accrual ratios, weak cash conversion, receivables outpacing sales, aggressive capitalization, frequent auditor changes, related-party transactions, restated financials, unusual fourth-quarter revenue spikes, off-balance-sheet financing, and Beneish M-scores above −1.78.
What does "red flag" mean in trading terms?
Any data point in a company's financial statements suggesting reported results don't match underlying economic reality, prompting deeper investigation before you commit capital.
Where do I find the data to calculate these ratios myself?
Net income, operating cash flow, and total assets all come directly from the 10-K or 10-Q filed on EDGAR. Most brokerage screeners also carry cash flow and accrual data pre-calculated if you want a faster first pass before verifying the numbers yourself.
Our education team publishes new strategy guides and market analysis every week.
Want expert trading insights delivered daily?
Join thousands of traders who rely on Traders Agency for market analysis and trade ideas.
Join Traders AgencyDISCLAIMER: Traders Agency does not offer financial advice. The information provided is for educational purposes only and should not be considered financial advice. Traders Agency is not responsible for any financial losses or consequences resulting from the use of the information provided. Trading carries inherent risks and may not be suitable for all individuals. You are advised to conduct your own research and seek personalized advice before making any investment decisions, recognizing the potential risks and rewards involved.
See more from Traders Agency on Google
Make us a preferred source and our market analysis will appear more prominently in your Google Search, Top Stories, and AI results.
Add to Preferred Sources