
You've probably seen a stock suddenly gap up or down on seemingly no news. Often, if you look closely at the options market from the days prior, the warning signs were already there. Unusual options activity is a sudden surge in trading volume for a specific options contract that significantly exceeds its historical average or current open interest. We're going to walk you through how to spot these institutional footprints, filter out the noise, and build a structured trading plan around the signals that matter most.
Large funds and institutional traders move massive amounts of capital, and they cannot hide their trades completely. By tracking their options volume, retail traders can gain insight into where the smart money believes a stock is headed. Our team recommends treating these signals as a starting point for your research, not an immediate buy or sell recommendation. By the end of this guide, you'll know exactly how to track institutional intent and act on it with confidence.
What Is Unusual Options Activity?
Bottom Line: Unusual options activity gives retail traders a repeatable way to track where institutional money is positioning before a major price move occurs. The edge is not in blindly following every spike, but in learning to filter sweep orders from block orders, confirm the signal with additional context, and build a structured trade plan around the setups that hold up to scrutiny. Traders who treat this as a research process rather than a shortcut are the ones who use it consistently.
Unusual options activity occurs when the trading volume of a specific call or put contract surges well beyond its normal levels or current open interest. This sudden spike often indicates that institutional investors or hedge funds are positioning themselves for a major upcoming price movement in the underlying stock.
We teach our members to view this activity as a footprint. Large funds cannot hide their massive orders. When they buy 10,000 contracts of a stock that usually trades 500 contracts a day, they leave a visible trail in the market data.
Listed options trade on regulated exchanges such as the Cboe, and trade data is publicly disseminated through the Options Price Reporting Authority (OPRA). This transparency allows retail traders to see exactly where the big money is flowing. In practical terms, unusual options activity is simply a volume anomaly that warrants closer investigation.
Key Concept: Unusual options activity is a volume spike in a specific options contract that far exceeds its historical average or open interest. It often signals that institutional traders are placing large directional bets on a stock's future movement.
What Does It Mean When Options Volume Exceeds Open Interest?
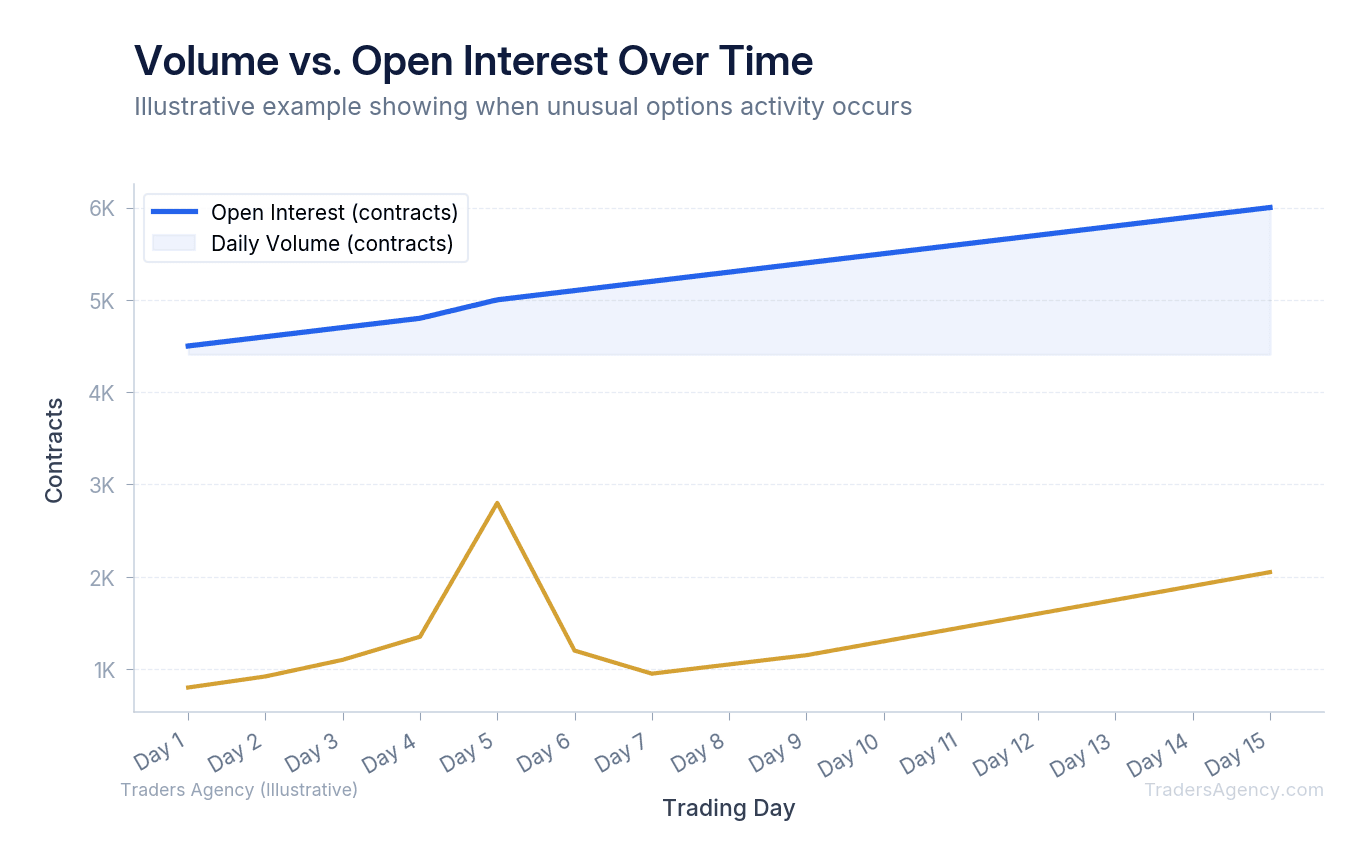
When options volume exceeds open interest, it strongly suggests that new positions are being created in the market rather than existing trades simply being closed. This scenario signals strong conviction from traders who are likely initiating fresh, large-scale bets on the future direction of the underlying stock.
Open interest represents the total number of active contracts currently held by market participants, updated at the end of each trading day. Volume is the number of contracts traded during the current session. If you spot unusual option activity today with a volume of 5,000 contracts and an open interest of only 500, a significant number of new contracts are almost certainly being opened. You cannot pinpoint the exact count intraday because some volume may represent positions opened and closed within the same session, but the sheer ratio confirms strong new interest.
| Metric | Definition | What It Tells You |
|---|---|---|
| Volume | Contracts traded during the current session | How active the contract is right now |
| Open Interest | Total active contracts held by all participants (end-of-day) | How many positions currently exist |
| Volume > OI | Today's volume exceeds total open interest | New positions are very likely being opened with conviction |
| Volume < OI | Today's volume is below open interest | Normal trading activity; no unusual signal on its own |
This ratio is the core signal we watch. High volume with low open interest tells us a new thesis is being formed. Conversely, if volume is high but open interest is much higher, traders might simply be closing out old positions or rolling existing ones. We only want to follow fresh institutional conviction.
What Is the Difference Between Sweep Orders and Block Orders in Options?
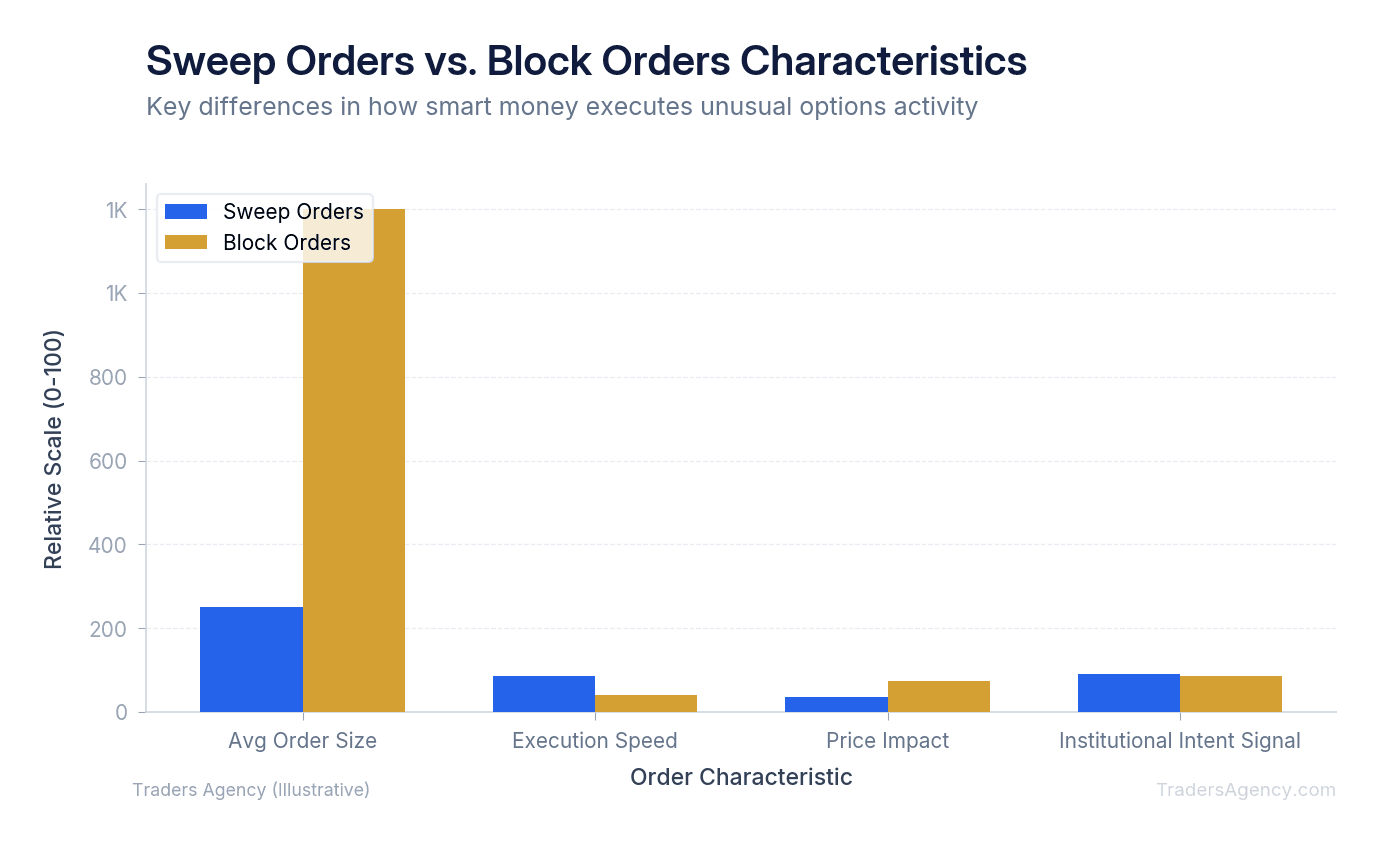
Not all large trades are created equal. We categorize institutional trades into two main types: sweep orders and block orders. Understanding the difference helps you gauge the urgency behind the trade.
Block orders are massive, single trades executed privately between two parties. They show up as one large print on the tape. While they represent significant capital, they do not always indicate urgency.
Sweep orders are much more aggressive. An institution breaks a massive order into smaller pieces and routes them across multiple exchanges to fill the order as fast as possible. They "sweep" the order book, taking every available contract at the current price.
| Characteristic | Block Order | Sweep Order |
|---|---|---|
| Execution | Single large print, often off-exchange | Split across multiple exchanges simultaneously |
| Urgency | Moderate. Negotiated between parties | High. Buyer wants in immediately |
| Price Sensitivity | Often negotiated at a specific price | Buyer pays the ask across all exchanges |
| Signal Strength | Worth watching | Strong directional signal |
When we analyze unusual options activity using public exchange data from the Cboe (Chicago Board Options Exchange), sweeps catch our attention the most. They indicate extreme urgency. The buyer is willing to pay the ask price across multiple exchanges because they want into the position immediately.
How Do You Find Unusual Options Activity?
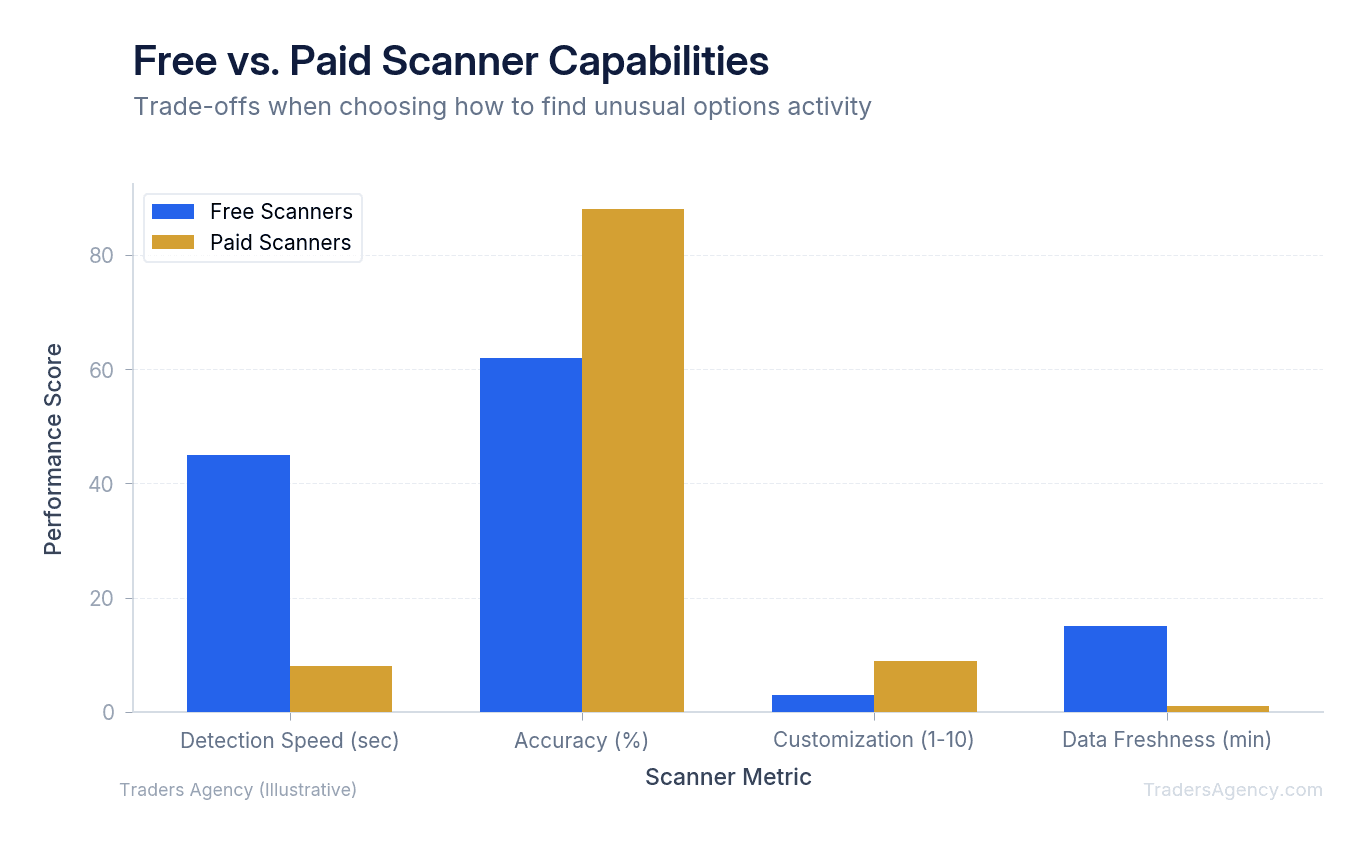
You find unusual options activity by using a dedicated scanning tool that filters the entire options market for high-volume trades, aggressive sweep orders, and volume-to-open-interest ratios above a specific threshold. Traders typically set custom alerts to notify them when these specific institutional footprints appear.
You might wonder how to find unusual options activity without staring at a screen all day. Our team recommends using a scanner with a free trial or a premium tool to automate the heavy lifting. Here is the exact workflow we use to filter the market:
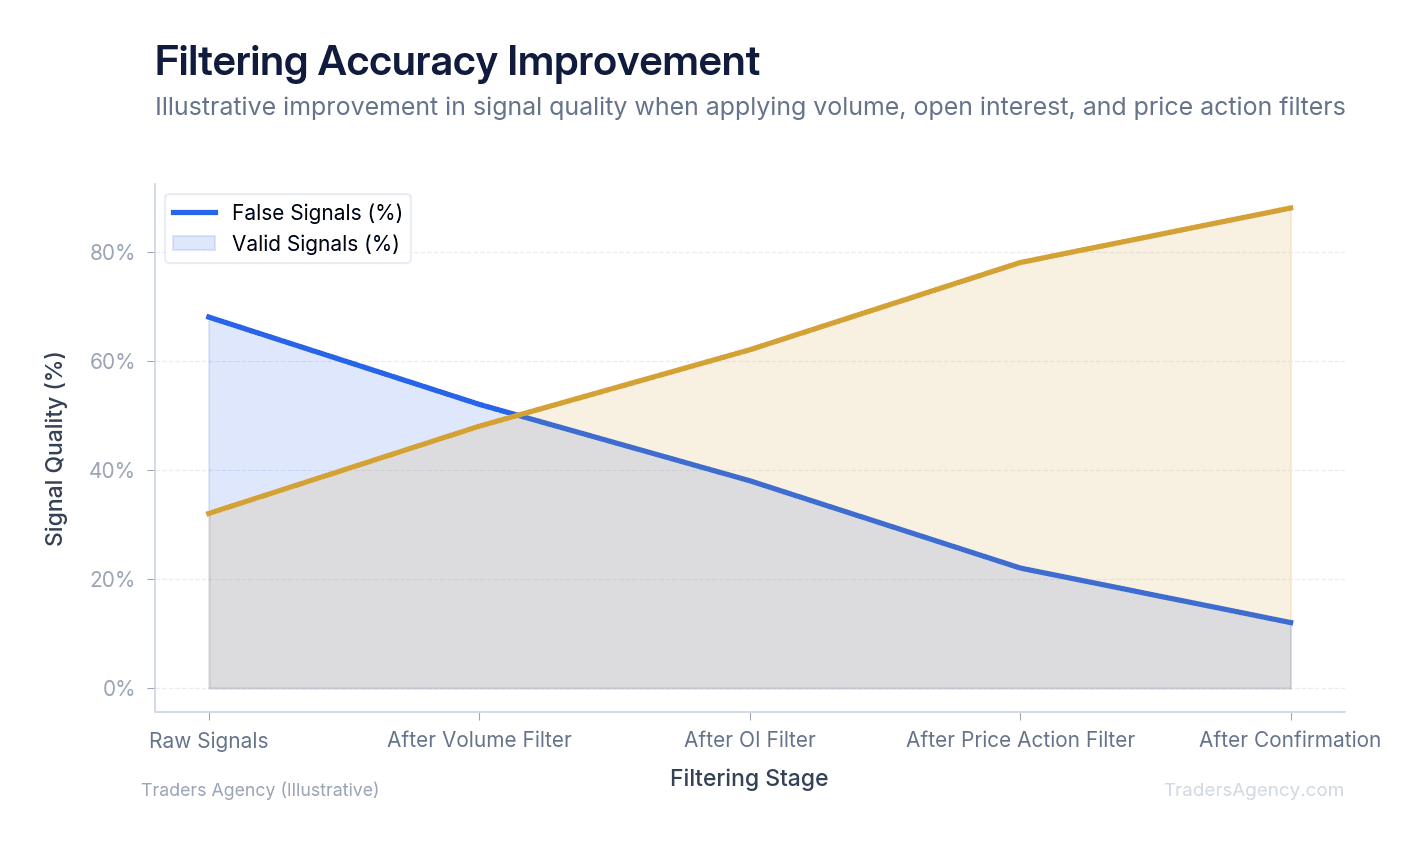
- Set Your Volume Filter. We look for a minimum volume of 2,000 contracts on a single strike. Anything less might just be a retail trader or a minor portfolio hedge. We want to see institutional size.
- Check the Volume-to-OI Ratio. We set our scanners to only show trades where volume is at least 2x the open interest. This confirms new positions are likely being opened. A ratio of 3:1 or higher is even better.
- Filter for Urgency. We filter for trades executed at or above the ask price. This shows the buyer was aggressive. If a trade fills at the bid price, the institution was likely selling the option to collect premium, which changes the entire thesis.
Key Concept: The three-filter workflow (volume threshold, volume-to-OI ratio, and ask-side execution) is how we separate genuine institutional signals from everyday market noise. All three conditions should be met before you investigate further.
Want expert trading insights delivered daily?
Join thousands of traders who rely on Traders Agency for market analysis and trade ideas.
Join Traders AgencyHow Do You Tell If Unusual Options Activity Is Bullish or Bearish?
You can tell if unusual options activity is bullish or bearish by looking at whether the aggressive orders are calls or puts, and where they fill. Calls bought at the ask price are bullish, while puts bought at the ask price indicate bearish sentiment.
Interpreting the data requires nuance, though. A massive put purchase might look bearish, but it could actually be a protective hedge for a massive long stock position. Institutions frequently use options to protect their stock portfolios.
To confirm the direction, we teach our members to look at the execution price. If someone buys 5,000 AAPL calls at the ask price, that is aggressive directional buying. If they sell 5,000 calls at the bid price, they are collecting premium. Selling calls is a neutral or bearish stance.
| Signal | Order Type | Execution | Likely Intent |
|---|---|---|---|
| Bullish | Calls | Bought at the ask | Aggressive directional buying |
| Bearish | Puts | Bought at the ask | Aggressive downside positioning |
| Neutral/Bearish | Calls | Sold at the bid | Premium collection, expects sideways or down |
| Hedge | Puts | Bought at the ask (with large stock position) | Portfolio protection, not a directional bet |
You can also check for TradingView scripts that color-code trades based on whether they hit the bid or the ask. This visual aid helps confirm the true directional intent before you risk your capital.
What Are the Most Common Mistakes Traders Make When Tracking Unusual Options Activity?
Many traders see a massive call order and immediately buy the exact same strike. We strongly advise against this blind following. Institutions have different risk profiles, timelines, and hedging strategies than retail traders.
Here are the most common traps we see traders fall into:
- Ignoring the earnings calendar. A massive trade right before an earnings report is a gamble, not a calculated setup. Institutions often use complex multi-leg strategies around earnings that look like directional bets on a basic scanner.
- Falling for dividend capture plays. Deep in-the-money call volume right before an ex-dividend date is usually just an institutional dividend strategy. It is not a directional bet on the stock going up.
- Using delayed data. Relying on 15-minute delayed data makes you the last person to the party. Finding the best unusual options activity scanner for your specific trading style takes time, but real-time data is non-negotiable for this strategy.
Watch Out: Never copy an institutional trade strike-for-strike without doing your own analysis. Institutions hedge across multiple positions and timeframes. What looks like a simple directional bet on your scanner could be one leg of a complex, multi-leg strategy you cannot see.
How Do You Manage a Trade After Spotting Unusual Options Activity?
Spotting the trade is only step one. Execution and risk management dictate your actual success. We never trade an options signal in isolation. We always pair it with technical analysis on the underlying stock.
- Wait for Technical Confirmation. If we see massive call buying in TSLA, we do not buy instantly. We pull up the stock chart and wait for the price to break a key resistance level. The options order is the thesis. The price action is the trigger.
- Define Your Risk. Institutions have billions of dollars to hedge their bets. You do not. We never allocate more than 2% to 5% of our total account equity to a single options trade. Position sizing keeps you in the game when a signal turns out to be a false alarm.
- Plan Your Exit. Set a firm stop loss based on the underlying stock chart, not the option premium. Options premiums fluctuate wildly due to time decay and implied volatility. If the stock drops below the support level that invalidated your original thesis, close the trade immediately. Do not hold and hope.
Risk Warning: Options trading involves significant risk and is not suitable for all investors. You can lose your entire investment in an options trade. Always define your maximum risk before entering a position, and never trade with money you cannot afford to lose.
The Traders Agency education team publishes new strategy guides and market analysis every week. If you found this guide helpful, consider joining our community for real-time alerts, live training sessions, and in-depth analysis on setups just like these.
Want expert trading insights delivered daily?
Join thousands of traders who rely on Traders Agency for market analysis and trade ideas.
Join Traders AgencyKey Takeaways
- Unusual options activity is defined as a surge in trading volume for a specific contract that significantly exceeds its historical average or current open interest, not just high volume in isolation.
- Institutional traders cannot fully conceal large orders. A single fund buying 10,000 contracts leaves a visible footprint in the options tape that retail traders can track.
- Sweep orders and block orders are distinct signals and require different interpretations. Knowing which type you are looking at changes how you should respond to the activity.
- Unusual options activity should be treated as a starting point for research, not a direct buy or sell trigger. Confirmation from price action and fundamentals is part of the process.
- Defining your maximum risk before entering a position is a non-negotiable step. Options trades can result in a total loss of the capital invested.
DISCLAIMER: Traders Agency does not offer financial advice. The information provided is for educational purposes only and should not be considered financial advice. Traders Agency is not responsible for any financial losses or consequences resulting from the use of the information provided. Trading carries inherent risks and may not be suitable for all individuals. You are advised to conduct your own research and seek personalized advice before making any investment decisions, recognizing the potential risks and rewards involved.
See more from Traders Agency on Google
Make us a preferred source and our market analysis will appear more prominently in your Google Search, Top Stories, and AI results.
Add to Preferred Sources