

The most predictable opportunities among Wall Street stocks show up when forced selling creates artificial supply. A multi-billion dollar hedge fund just blew up, and I turned that panic into a fast profit. Capital is rotating right now, and knowing where it goes next is the whole game.
How Does a Margin Call Create a Trading Opportunity?
Bottom Line: Forced liquidations are mechanical events, not fundamental ones, and that distinction is where the edge lives. The $15,000 profit came from recognizing that a margin call creates artificial supply, not a broken business. With that trade closed, the next opportunity is in the rotation toward copper and gold, where supply and demand mechanics are building a case for a significant breakout.
When a fund is forced to sell, the price stops reflecting reality
A hedge fund margin call happens when an overleveraged fund gets forced to liquidate large positions to cover its debts. That selloff runs on forced supply and demand mechanics, not on the actual health of the companies being dumped.
Leopold Aren Briner's multi-billion dollar hedge fund got into serious trouble. They were overleveraged. The broker issued a margin call and forced them to liquidate, which exacerbated a massive selloff across the entire portfolio.
When billions of dollars in Wall Street stocks hit the market at once, the price mechanism breaks down. During a margin call, the most powerful person in the room isn't the fund manager. It's the broker forcing the liquidation.
These stocks fell much further than they should have, purely because of the liquidation mechanism. That's the setup.
The 10 Stocks I Bought
I made a $100,000 bet on the overcorrection. I identified the 10 stocks I believed were the largest holdings in the portfolio and put $10,000 into each one.
The goal was simple. This was never about catching the biggest move in history. I wanted a predictable 15% to 30% bounce as the forced selling pressure faded.
I held these positions for three and a half trading days. Bought on Thursday, held through Friday and Monday, and evaluated by Tuesday morning.
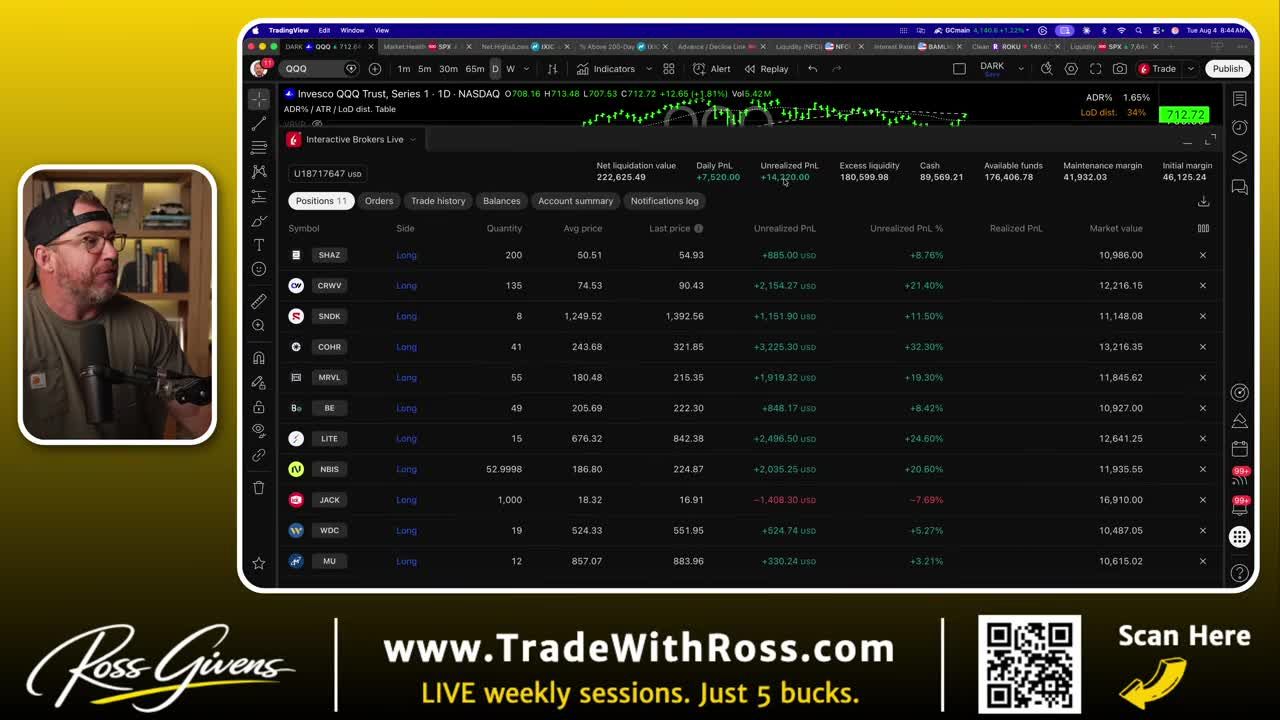
One of the names, core, sold off hard and then ripped right back. Others, like Micron and Western Digital, haven't done much yet.
How Wash Sales Distort Your Numbers
Wash sale rules mess with your average cost basis on paper. Buy a stock, get stopped out for a loss, buy it again, and your broker adjusts your entry price upward. Your real profit looks artificially lower on the platform.
My Jack in the Box position is the perfect example. The platform showed me down $1,400 with an average cost of 18.30.
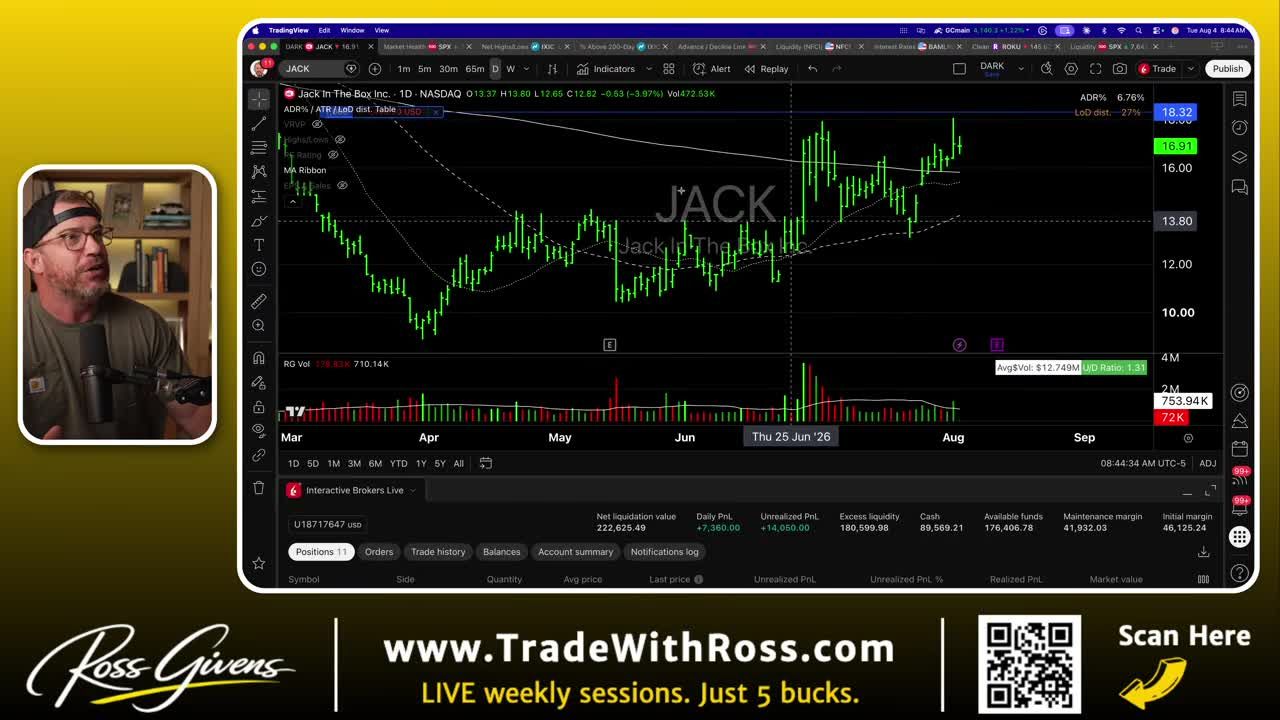
In reality, I wasn't down on Jack in the Box at all. I bought it, got stopped out, and bought it again. The wash sale rule adjusted the cost basis on the screen, even though my actual entry was much lower. Track your real numbers, not the default platform display.
Why I'm Cashing Out Now
After a rapid 15% return, the next step is liquidating and capturing the gain. These stocks are still in downtrends and pushing back into their moving averages. This was a short-term overcorrection play, not a position to hold for years.
I don't want to be greedy here. These names were declining before the liquidation exacerbated the move, and the recent bounce is already running them back into resistance.
I'm liquidating to lock in the $14,000 to $15,000 profit. They may go higher, and I might leave money on the table, but a 15% return in under a week is exactly the pop I was looking for.
Get an entire year of live weekly mentoring sessions, my newsletter, indicators, bonus reports, tons more. Click the link and I'll see you in the next live session.
Join my Black Ops Trading ClubWhy Is Capital Rotating Into Copper Now?
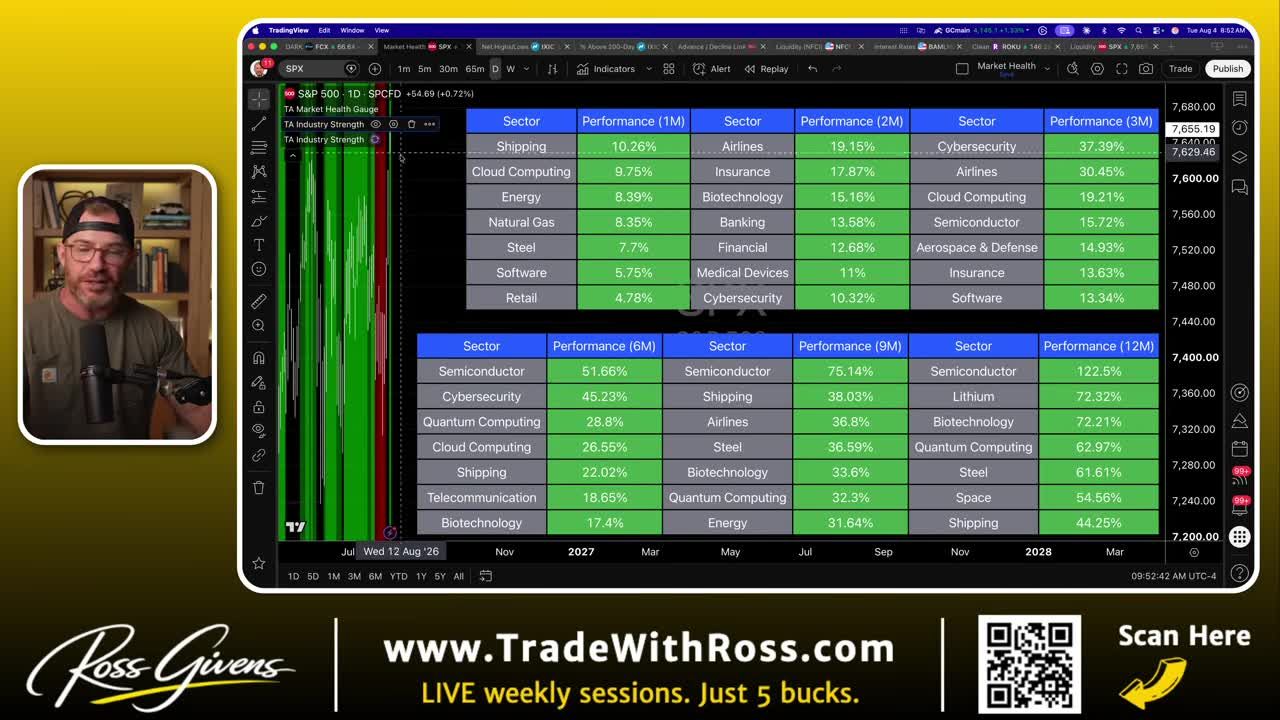
The NASDAQ is coming back, but the price action is still whippy. Capital is rotating out of the AI supply chain names and into new areas. There's no clear leadership right now. Semiconductors were leading, then stopped. Cybersecurity was strong, now it's fading.
This transitional period is pushing me heavily into metals.
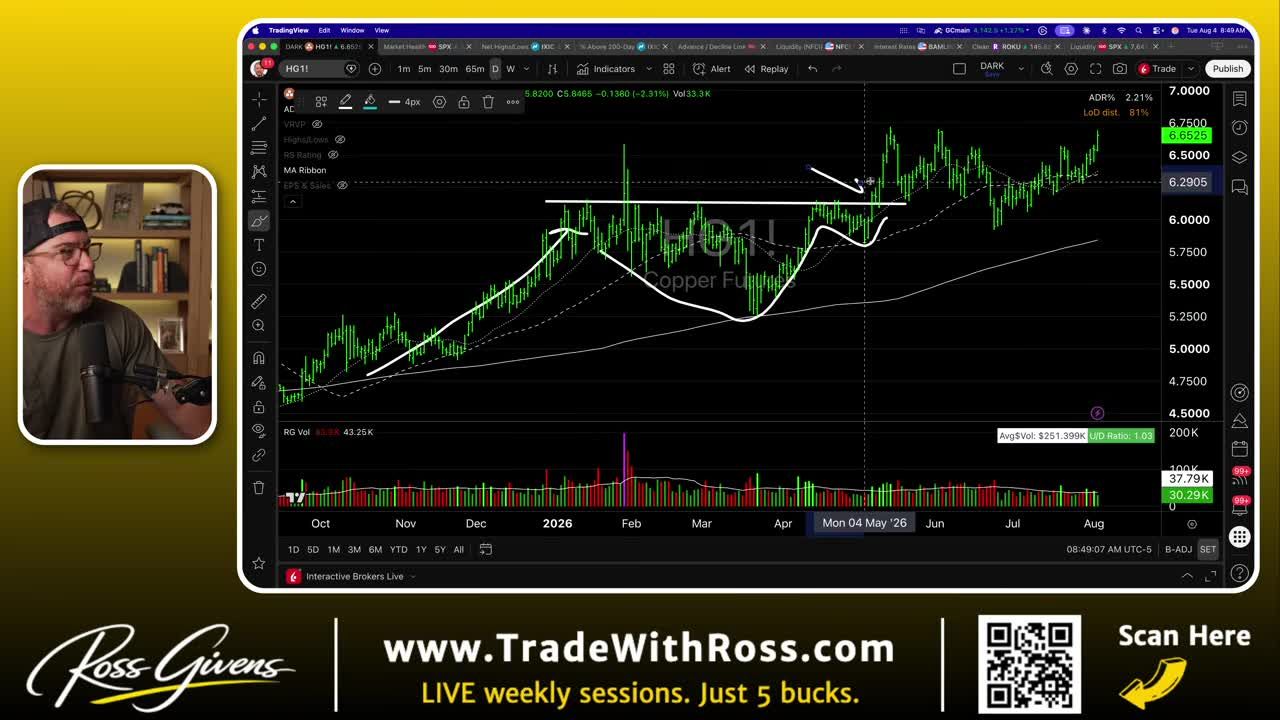
I'm watching copper futures (HG) closely. Copper formed a classic cup with handle and broke out. Then turmoil in Iran made the market risk-off. When tech and the NASDAQ aren't running, copper usually doesn't either, since the big demand story is tied to data center buildouts.
Instead of failing, copper consolidated. It tightened up into a "base on base" pattern: base one, followed by a second base tightening right behind it. That's a breakout on a breakout, and historically it's a very strong setup.
Trading the Copper Super Cycle
You can own copper directly through an ETF like CPER. I prefer the miners. My target is Freeport-McMoRan (FCX), the largest copper producer and miner in the US.
When copper prices rise, miner profits rise in exaggerated form. Run the math. If it costs a miner $3 a pound to extract copper and they sell it for $6, they make $3. Push the price from $6 to $8, roughly a 33% move in the commodity, and their profit jumps from $3 to $5. That's a 70% to 80% gain in actual profit.
When the underlying metal moves 20% to 30%, the miner's profits can climb 40%, 50%, or 60%. The downside works the same way, so these aren't buy-and-hold forever.
The FCX Setup
FCX has been consolidating all of 2026 with a low base forming and a nice gap up. I'm looking to go long from $660.
Trade it tight with a stop at today's low if you want a clean this-is-it-or-it-isn't setup. The easier method is a stop around $60.50, just beneath the 20-day and 50-day moving averages.
The Gold Breakout
Pure supply and demand, no earnings shocks
Metals and commodities trade purely on supply and demand. No earnings surprises, no CEO stepping down. These breakout patterns perform exceptionally well.
Gold had an amazing 2025 and a rough 2026. From its January peak, it pulled back 29% to 30%. That's a healthy retracement.
I wanted to buy gold around the 4,000 level, the last big area of acceptance. Price stalled exactly where I expected. Now the dips are getting lower and shallower, the action is tightening, and it's holding against resistance near 4,200.
How to Trade It
I'm waiting for consolidation to confirm buyers are stepping in for the next leg higher.
For gold futures (GC), the move is a breakout above 4,190 or $4,200. If you prefer a stock, the GLD ETF shows the same pattern, and it's a buy on a breakout above 380 or 383.
On this position you only need to risk about 4% to 5%. If the pattern plays out, the upside should run 10%, 15%, or even 20% plus. You can push it further with leveraged gold ETFs.
Follow the Rotation in Wall Street Stocks
Forced liquidations always create mispricing. Stepping in when a multi-billion dollar fund blew up handed us a fast $15,000 profit in just a few days.
Now the rotation among Wall Street stocks is moving toward hard assets. With tech leadership fading, the supply and demand mechanics in copper and gold are setting up strong breakouts. Keep your risk tight, respect your stops, and follow the capital.
Get an entire year of live weekly mentoring sessions, my newsletter, indicators, bonus reports, tons more. Click the link and I'll see you in the next live session.
Key Takeaways
- A forced margin call liquidation at Leopold Aren Briner's multi-billion dollar hedge fund created artificial selling pressure across its entire portfolio, pushing prices well below fundamental value.
- A $100,000 position was split evenly across 10 stocks identified as the fund's largest holdings, targeting a 15% to 30% bounce from the overcorrection.
- The trade returned $15,000 in profit within a few days, confirming that forced liquidations distort price discovery and create short-term mean-reversion setups.
- Capital rotation is now moving away from tech leadership and into hard assets, with copper and gold showing supply and demand setups that support 10% to 20%+ upside moves.
- Leveraged gold ETFs can amplify exposure to the hard asset rotation for traders willing to accept higher risk alongside tighter stops.
DISCLAIMER: Traders Agency does not offer financial advice. The information provided is for educational purposes only and should not be considered financial advice. Traders Agency is not responsible for any financial losses or consequences resulting from the use of the information provided. Trading carries inherent risks and may not be suitable for all individuals. You are advised to conduct your own research and seek personalized advice before making any investment decisions, recognizing the potential risks and rewards involved.
See more from Traders Agency on Google
Make us a preferred source and our market analysis will appear more prominently in your Google Search, Top Stories, and AI results.
Add to Preferred Sources