
Gold silver ratio trading is a strategy where we track the price of gold relative to silver to identify when one metal is historically overvalued compared to the other. You've probably watched gold and silver prices move in the same direction, only to notice one suddenly outpacing the other. That divergence creates a unique opportunity. Instead of guessing whether the broader precious metals market will rise or fall, you can trade the mathematical relationship between the two assets. In this guide, we'll walk you through how to identify extreme price divergences between these metals, how to structure a mean reversion trade using ETF pairs, and how to manage the associated risks.
What Is the Gold-Silver Ratio and Why Does It Matter?
Bottom Line: Gold silver ratio trading works because it sidesteps the need to predict whether precious metals will rise or fall overall. The edge comes from identifying when the historical relationship between the two metals has stretched to an extreme and then structuring a pairs trade that profits when it normalizes. The risk management rules here, particularly the 5% position cap, the 10-point stop, and the recession avoidance rule, are what separate a disciplined strategy from a speculative bet.
The gold-to-silver ratio measures how many ounces of silver it takes to buy one ounce of gold. If gold trades at $2,000 per ounce and silver trades at $25 per ounce, the ratio is exactly 80 to 1.
Our team recommends viewing this ratio as a stretched rubber band. When the band stretches too far in one direction, it eventually snaps back to its historical average. This snapping back is called mean reversion.
Key Concept: Mean reversion trading on the gold-silver ratio means buying the historically undervalued metal while simultaneously selling short the overvalued metal. You don't need gold to hit a new all-time high to profit. You only need the price relationship between the two metals to return to normal.
This approach removes broad market direction from the equation entirely. Traders use this metric to decide which metal offers better relative value at any given moment. When you buy the undervalued metal and short the overvalued one, you isolate the spread between them as your source of profit.
Is the Gold-Silver Ratio a Good Indicator?
Yes. The gold-silver ratio is a highly effective indicator for precious metals traders. It reliably highlights extreme valuation differences between the two metals. Because gold and silver share similar macroeconomic drivers, significant deviations from their historical average create high-probability mean reversion trading opportunities.
When we look at 100 years of gold-silver ratio data, the historical average sits around 60 to 1. While the metals rarely stay exactly at this baseline, they consistently gravitate back toward it over time.
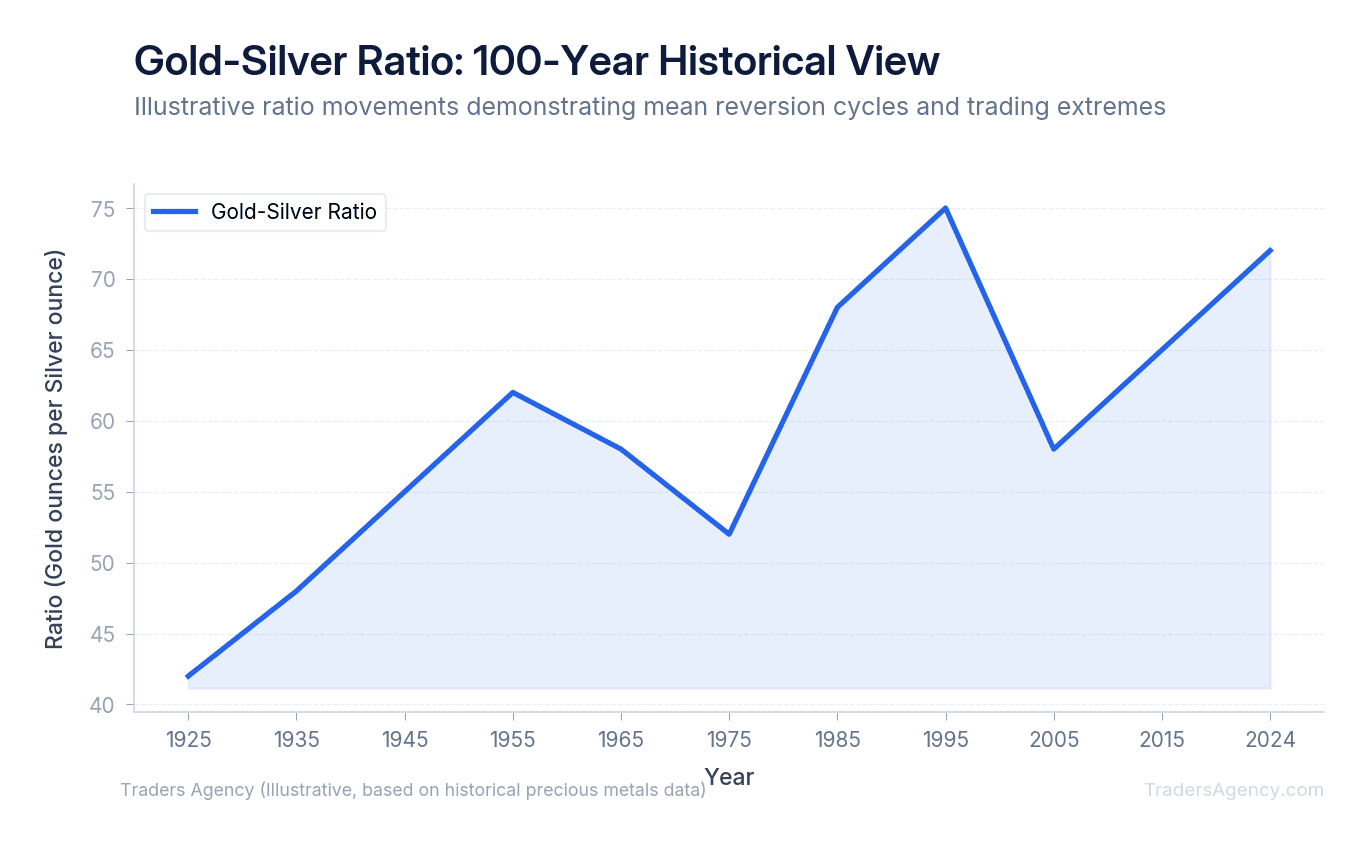
Many professionals check the gold-silver ratio chart daily to see if the current market is approaching historical extremes. Historical data from the Chicago Mercantile Exchange (CME) shows that prolonged periods outside the normal range often precede aggressive price corrections.
For example, during the 2020 market panic, the ratio spiked above 120 to 1. Silver was historically cheap compared to gold. Over the following months, the ratio violently reverted back toward the historical mean, rewarding traders who understood this indicator.
What Is a Good Gold-Silver Ratio to Buy?
A good gold-silver ratio to buy silver is anything above 80 to 1, as silver is considered historically undervalued at that level. Conversely, a good ratio to buy gold is below 50 to 1, indicating gold is cheap relative to silver. These extreme levels offer excellent risk-to-reward setups.
When members ask our team about the right time to enter a ratio trade, we focus strictly on these outer boundaries. Trading in the middle zone between 50 and 80 often leads to choppy, directionless results. We call this the "no trade zone."
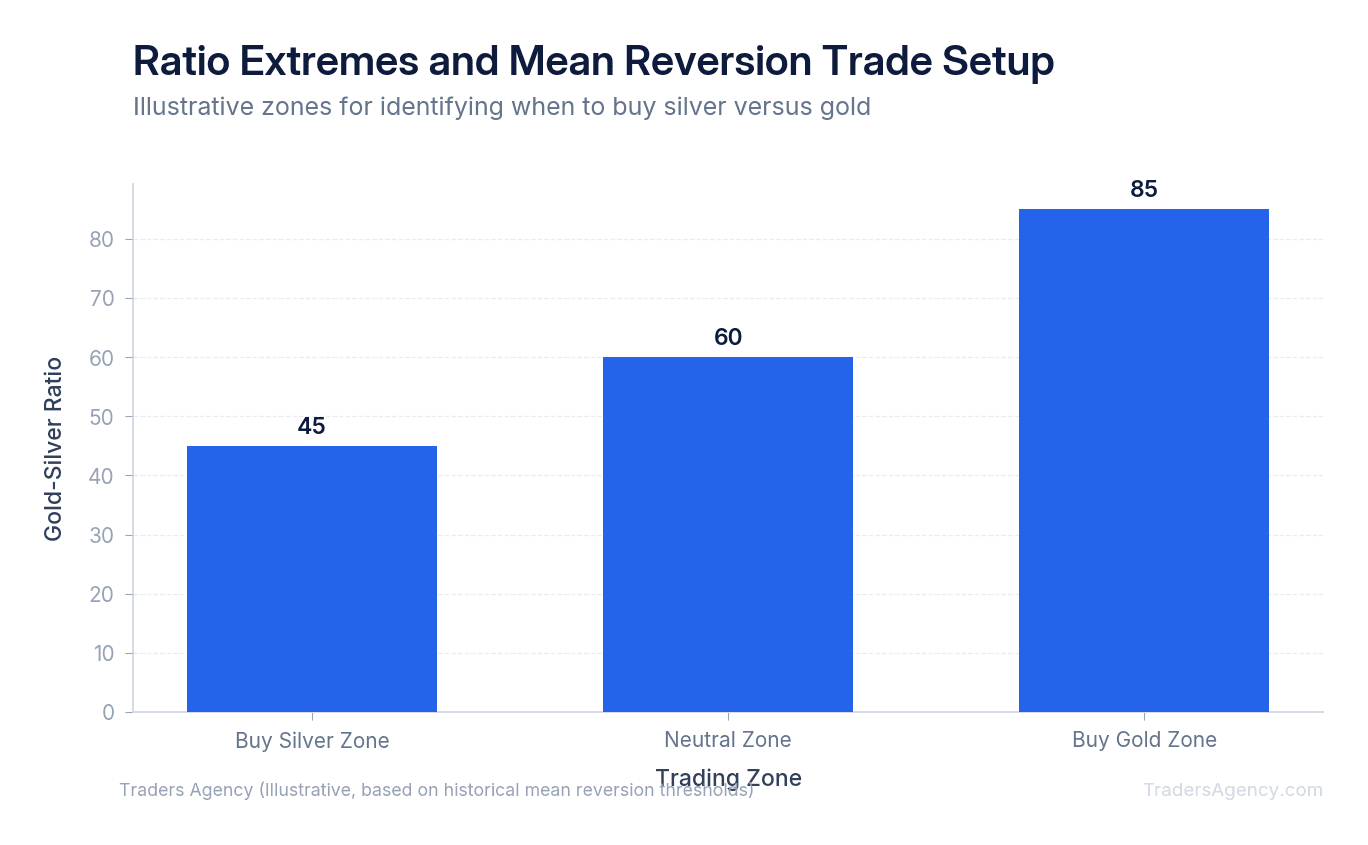
You can calculate the current ratio yourself at any time. Simply divide the current spot price of gold by the spot price of silver. Waiting for the ratio to cross the 80 to 1 threshold before buying silver provides a strong mathematical edge.
Patience is required here. The ratio might only hit these extremes once every few years. However, when it does, it provides one of the clearest signals in the commodities market.
| Ratio Zone | Range | Action |
|---|---|---|
| Buy Silver Zone | Above 80:1 | Buy SLV / Short GLD |
| No Trade Zone | 50:1 to 80:1 | Stay flat, wait for extremes |
| Buy Gold Zone | Below 50:1 | Buy GLD / Short SLV |
How Do You Execute a Mean Reversion Trade with ETF Pairs?
Here's a concrete example of gold silver ratio trading using the most liquid exchange-traded funds. We'll use GLD (SPDR Gold Shares) and SLV (iShares Silver Trust) for this setup.
- Identify the Setup: Assume you check the charts and the ratio hits 85 to 1. Silver is historically cheap, and gold is expensive. The setup dictates that we want to buy silver and short gold.
- Execute the Dollar-Neutral Pair: We prefer to use a dollar-neutral pairs trade. If you allocate $10,000 to this setup, you'll buy $5,000 worth of SLV and short $5,000 worth of GLD. By holding equal dollar amounts, you isolate the relationship between the two metals. You don't care if the broader precious metals market goes up or down. You only care that silver outperforms gold on a percentage basis.
- Manage the Outcome: If the ratio drops from 85 back to the historical average of 60, your trade becomes profitable. Silver will have outperformed gold in relative terms, meaning the net gain on your SLV long exceeds any loss, or the net gain on your GLD short exceeds any loss on SLV. The combined position profits from the convergence regardless of whether both metals moved up or down in absolute terms.
| Trade Parameter | Value |
|---|---|
| Entry Ratio | 85:1 |
| Target Ratio | 60:1 (historical mean) |
| Total Capital Allocated | $10,000 |
| Long Position | $5,000 SLV |
| Short Position | $5,000 GLD |
| Stop Loss | Ratio closes above 95:1 on weekly chart |
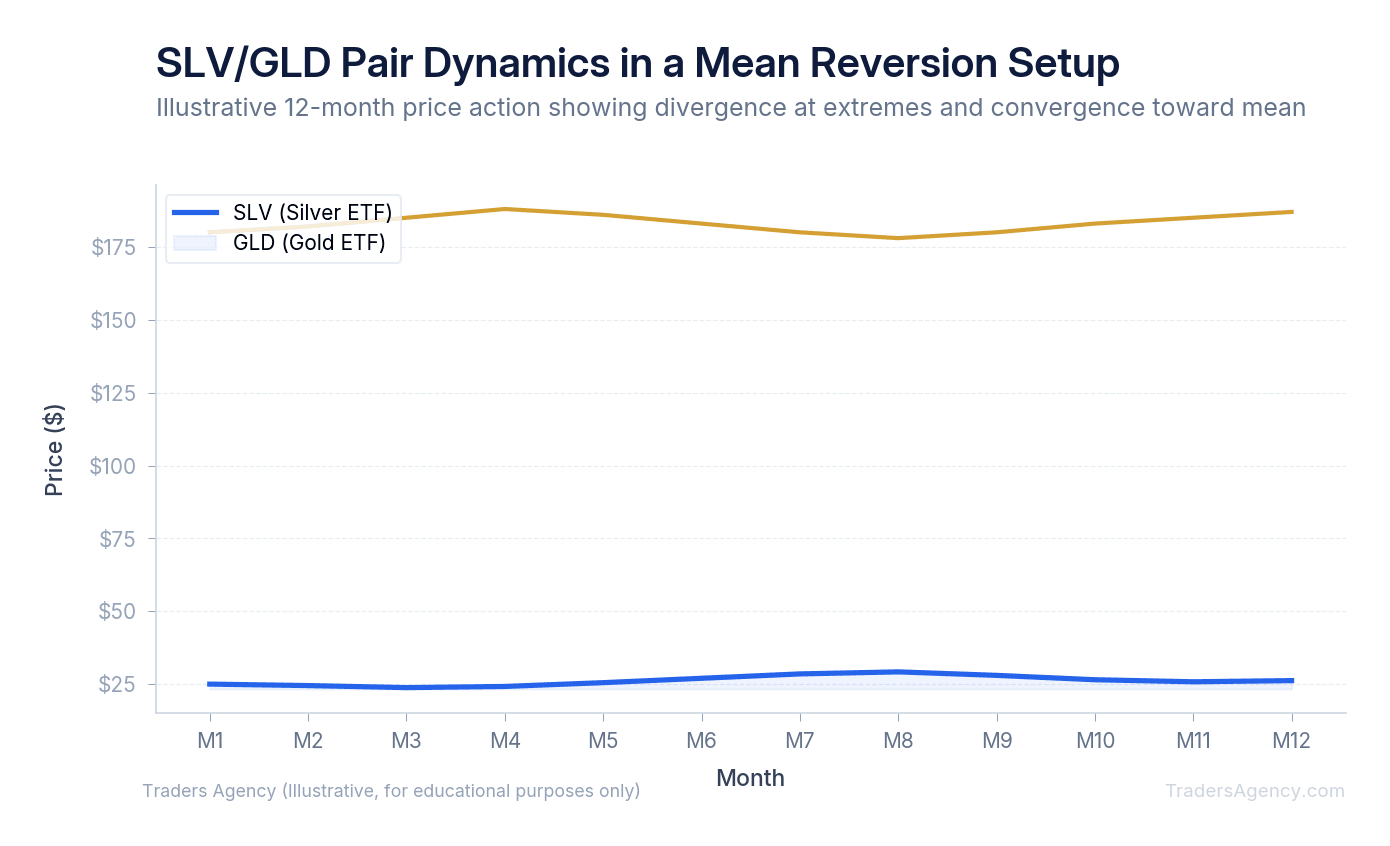
Watch Out: The worst-case scenario occurs if the ratio continues climbing to 100 or higher. This requires strict stop losses to protect your capital. You must also ensure your brokerage account has sufficient margin to hold the short GLD position.
Want expert trading insights delivered daily?
Join thousands of traders who rely on Traders Agency for market analysis and trade ideas.
Join Traders AgencyWhich Trading Vehicles Work Best for This Strategy?
The best vehicles for trading the gold-silver ratio depend on your account size and experience level. Here's what we teach our members about selecting the right vehicle for their specific needs:
- ETF Pairs (Best for Most Traders): Buying SLV and shorting GLD is the most accessible method. It allows for precise position sizing down to a single share, and you can easily balance your dollar allocation.
- Futures Spreads (Advanced): Using COMEX gold and silver futures provides high capital efficiency. The number of contracts on each side must be calculated based on current notional values to achieve a dollar-neutral hedge. This requires significant margin and carries higher risk.
- Physical Bullion (Long-Term Investors): Some investors trade physical coins, swapping gold for silver at local dealers when the ratio is high. This avoids margin calls but incurs heavy dealer premiums that eat into profits.
We strongly suggest starting with ETFs. Mastering the mechanics with SLV and GLD is essential before touching highly leveraged futures contracts.
Can Industrial Demand Break the Gold-Silver Mean Reversion Model?
No strategy is perfect. The biggest threat to this mean reversion trade is a fundamental shift in silver demand. You must understand the underlying drivers of both metals.
Unlike gold, which acts primarily as a monetary asset and safe haven, silver has massive industrial applications. It is heavily used in solar panels, electronics, and electric vehicles.
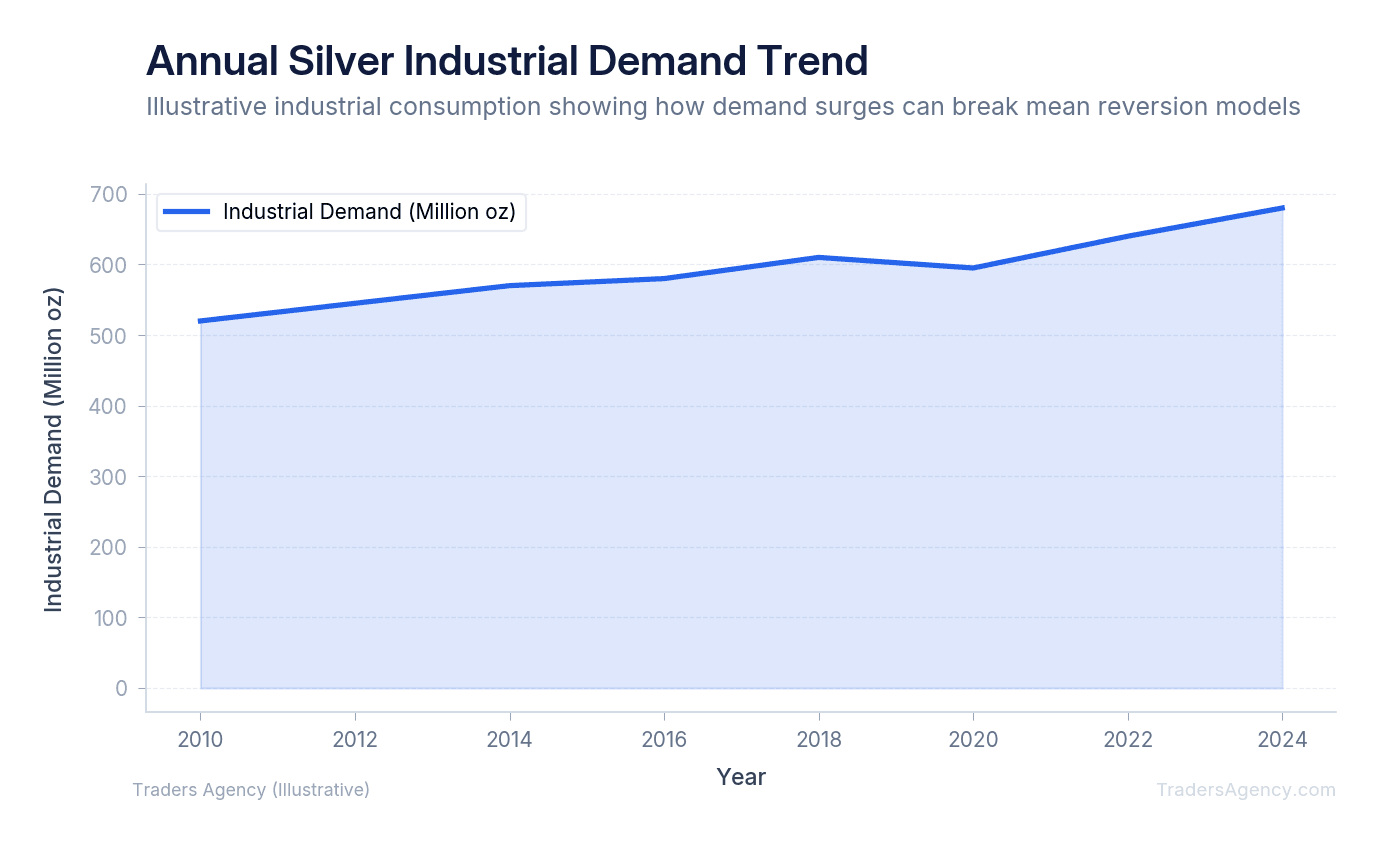
If global manufacturing slows down, industrial demand for silver plummets. In this scenario, the ratio can stay elevated well above 80 to 1 for years. You must monitor industrial economic data, not just precious metals charts.
Watch Out: We teach our traders to avoid ratio trades during severe economic recessions. During market panics, investors flock to gold for safety while dumping silver due to its industrial ties. This can cause the ratio to blow past historical extremes and trigger your stop losses.
Risk Management and Strategy Integration
Trading the ratio requires immense patience. Mean reversion can take months or even years to fully play out. This is a swing trading or position trading strategy, not a day trading setup.
Our team recommends keeping your allocation small. Never commit more than 5% of your total trading capital to a single pairs trade. Because you are shorting an asset, your theoretical risk is technically unlimited if gold prices skyrocket.
You must also set a hard stop loss based on the ratio itself. If you enter a trade when the ratio is 85, you might place a stop loss if the ratio closes above 95 to 1 on a weekly chart. Do not hold a losing pairs trade hoping it will eventually turn around.
Key Concept: This strategy pairs well with trend-following confirmation tools. Use moving average crossovers on the ratio chart to confirm the reversal has actually started. Waiting for momentum to shift in your favor is always better than trying to catch a falling knife at the exact top or bottom.
Here's a quick summary of our risk management rules for ratio trading:
- Position Size: No more than 5% of total capital per pairs trade
- Stop Loss: Exit if the ratio moves 10 points against your entry on a weekly close
- Time Horizon: Expect 3 to 18 months for full mean reversion
- Confirmation: Use a 50-day moving average crossover on the ratio chart before entering
- Avoid: Do not enter during active recessions or financial panics
Want expert trading insights delivered daily?
Join thousands of traders who rely on Traders Agency for market analysis and trade ideas.
Join Traders AgencyKey Takeaways
- The gold-silver ratio measures how many ounces of silver it takes to buy one ounce of gold. At $2,000 gold and $25 silver, that ratio is 80:1.
- Mean reversion trading on this ratio means buying the undervalued metal and shorting the overvalued one simultaneously, so you profit from the relationship normalizing rather than from predicting market direction.
- Position sizing should stay at no more than 5% of total capital per pairs trade, with a stop loss triggered if the ratio moves 10 points against your entry on a weekly close.
- Full mean reversion typically takes 3 to 18 months, so this is a medium-term strategy that requires patience rather than active day trading.
- Avoid entering ratio trades during active recessions or financial panics, when industrial demand disruptions can break the historical mean reversion model entirely.
DISCLAIMER: Traders Agency does not offer financial advice. The information provided is for educational purposes only and should not be considered financial advice. Traders Agency is not responsible for any financial losses or consequences resulting from the use of the information provided. Trading carries inherent risks and may not be suitable for all individuals. You are advised to conduct your own research and seek personalized advice before making any investment decisions, recognizing the potential risks and rewards involved.
See more from Traders Agency on Google
Make us a preferred source and our market analysis will appear more prominently in your Google Search, Top Stories, and AI results.
Add to Preferred Sources